Abstract
4-Hydroxybenzoyl-CoA (4-HB-CoA) thioesterase from Arthrobacter is the final enzyme catalyzing the hydrolysis of 4-HB-CoA to produce coenzyme A and 4-hydroxybenzoic acid in the bacterial 4-chlorobenzoate dehalogenation pathway. Using a mutation E73A that blocks catalysis, stable complexes of the enzyme and its substrate can be analyzed by Raman difference spectroscopy. Here we have used Raman difference spectroscopy, in the non-resonance regime, to characterize 4-HB-CoA bound in the active site of the E73A thioesterase. In addition we have characterized complexes of the wild-type enzyme complexed with the unreactive substrate analog 4-hydroxyphenacyl-CoA (4-HP-CoA). Both sets of complexes show evidence for two forms of the ligand in the active site, one population has the 4-hydroxy group protonated, 4-OH, while the second has the group as the hydroxide, 4-O−. For bound 4-HP-CoA X-ray data show that glutamate 78 is close to the 4-OH in the complex and it is likely that this is the proton acceptor for the 4-OH proton. Although the pKa of the 4-OH group on the free substrate in aqueous solution is 8.6, the relative populations of ionized and neutral 4-HB-CoA bound to E73A remain invariant between pH 7.3 and pH 9.8. The invariance with pH suggests that the 4-OH and the -COO− of E78 constitute a tightly coupled pair where their separate pKas lose their individual qualities. Narrow band profiles are seen in the C=O double bond and C-S regions suggesting that the hydrolyzable thioester group is rigidly bound in the active site in a syn gauche conformation.
Keywords: Raman difference spectroscopy, thioesterase, ionization, conformation, enzyme-substrate complex
Introduction
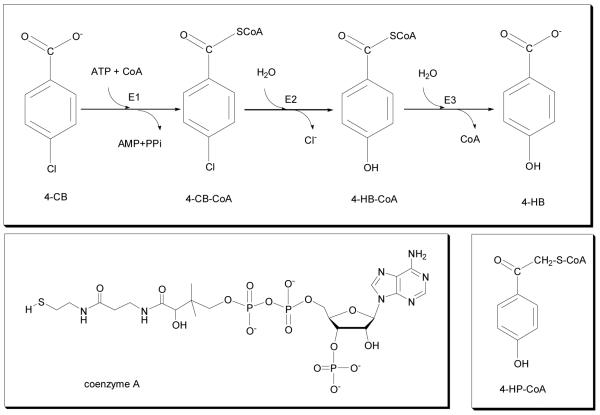
The industrially produced 4-chlorobenzoate (4-CB, Scheme 1) is a toxic compound occurring in soils where chemical residues have been dumped in the past century. However, some bacteria found in the soil have reconfigured their genetic make-up in order to use 4-CB as a source of carbon by converting 4-CB to the benign 4-hydroxybenzoic acid (4-HB) and chloride.[1] The 4-HB is further metabolized by the ortho- or meta- pathway. The bacteria use three enzymes to carry out the 4-CB to 4-HB conversion[2] the last of which is a thioesterase that converts 4-hydroxybenzoyl - coenzyme A (4-HB-CoA) to 4-hydroxybenzoic acid (Scheme 1). The thioesterase from the bacterium Arthrobacter is the subject of this paper.
Scheme 1.
(Top) 4-Chlorobenzoate dehalogenation pathway showing the three enzymes involved: E1, 4-chlorobenzoyl CoA ligase; E2, 4-chlorobenzoyl CoA dehalogenase; E3, 4-hydroxybenzoyl CoA thioesterase, and the chemicals 4-CB and 4-HB; (Left bottom) structure of coenzyme A; (Right bottom) 4-HP-CoA analog.
We have published kinetic, Raman and NMR data for a thioesterase from Pseudomonas bacteria that is in the same superfamily and has the same 3D fold (the so-called hot-dog family) as that from Arthrobacter.[3] However, the two 4-HB-CoA thioesterases are products of separate evolutionary pathways within the hotdog-fold enzyme superfamily.[4] Thus, the amino acid residues that form the Arthrobacter sp SU 4-HB-CoA thioesterase and the Pseudomonas sp strain CBS3 4-HB-CoA thioesterase active sites are quite different. The work reported in this paper examines the interaction between the substrate, and its unreactive analog 4-hydroxyphenylacyl-CoA (4-HP-CoA, see structure in Scheme 1), and the active site of the Arthrobacter sp SU 4HB-CoA thioesterase, using UV and Raman spectroscopy measurements to probe the alteration in the electron distribution in the 4-HB-CoA as it moves from water solvent into the active site of the enzyme. The results obtained are interpreted as evidence for the substrate bound as the phenolate anion and as the phenol. In contrast, 4-HB-CoA bound to the Pseudomonas sp strain CBS3 thioesterase is found only in the phenol form. [3] Comparison of respective liganded active site structures revealed Glu78, present in the thioesterase from Arthrobacter sp SU but not in the thioesterase Pseudomonas sp strain CBS3, as the residue most likely to deprotonate the ring hydroxyl group.
Although knowledge of protonation states of enzyme-bound substrates is vital for a complete description of enzyme mechanism such information is difficult to obtain - mainly because X-ray crystallographic electron densities usually have insufficient resolution to identify individual hydrogen atoms. The present work demonstrates a powerful advantage for Raman spectroscopic analysis. Not only are key protonation states determined but mixed populations of the bound substrate are identified where the 4-hydroxy groups are present as 4-O− and 4-OH.
Experimental
Materials.
4-Hydroxyphenacyl-CoA (4-HP-CoA) and 4-HB-CoA were prepared according to the published procedures.[4,5] 13C C=O and 13C phenyl C labeled 4-HB-CoA were prepared by the same approach, except that 13C labeled 4-hydroxybenzoate at the carbonyl and at the ring carbons were used as the starting material. Recombinant Arthrobacter sp. strain SU 4-hydroxybenzoyl-CoA thioesterase (kcat = 6.7 s−1 and Km = 1.2 μM at pH 7.5 and 25 °C; kcat optimal over pH range of 6–10) was purified as previously described.[6] Mutagenesis was carried out using a PCR strategy [7] based on the WT-Arthio/pET-23b plasmid as template, commercial primers, and with the PCR kit supplied by Stratagene, and the Power Block IITM System thermal cycler manufactured by ERICOMP. PCR-amplified DNAs were cloned into pET-23b vector (Novagen) for expression in E. coli BL21(DE3). The mutated genes were verified by DNA sequencing. The mutant proteins were purified by the same procedure used for the wild-type Arthrobacter thioesterase [6] and shown to be homogeneous by SDS-PAGE gel analysis.
Raman Spectroscopic Analysis.
The nonresonant Raman spectra were obtained using 647.1 nm laser excitation from Innova 400 krypton laser system (Coherent, Inc.), a back-illuminated charge-coupled device (CCD) detector (Model 1024EHRB/1, Princeton Instruments, Inc.) operating at 183K, and a Holospec f/1.4 axial transmission spectrometer (Kaiser Optical Systems, Inc.) employed as a single monochromator, as described in previous reports. [8] Enzyme samples, contained in cuvettes, were 50 μL in volume and buffered with 25 mM Tris-HCl at pH 7.5. Enzyme and 4-HB-CoA or 4-hydroxyphenacyl-CoA concentrations used are given in the figure legends. Data were collected immediately after the complex had been made, using a laser power of ~ 900 mW and CCD exposure times of 5 min. The Raman spectrum of the buffer was subtracted from that of the ligand in buffer (giving the spectrum of free ligand), while the spectrum of the enzyme in buffer was subtracted from that of the enzyme ligand complex to give the spectrum of the bound ligand. The concentrations of enzyme and ligand were adjusted according to the known association constants such that all ligand was present in the bound form. Wavenumber calibration yields Raman band positions to within ±1 cm−1 for sharp bands.
UV-visible absorption difference spectral analysis of the formation of ligand-enzyme complexes.
UV-visible absorption difference spectra were measured by Beckman DU 7400 diode array spectrometer. In 1-mL quartz tandem cell, one compartment contains 0.5 ml of wild-type or E73A Arthrobacter thioesterase solution (80 μM) and the other contains 0.5 mL of ligand solution at 80 μM (all solutions were buffered with 50 mM K+Hepes, pH 7.5, at 25 °C). The spectra before and after mixing were recorded and a difference spectrum of the enzyme-ligand complex was obtained by subtracting the former spectrum from the final mixture spectrum. At 300 nm the OD before mixing was 0.2 and after mixing 0.6.
Results and Discussion
4-HB-CoA and 4-HP-CoA bind to Arthrobacter thioesterase in two forms 4-OH and 4-O−
Absorption spectra
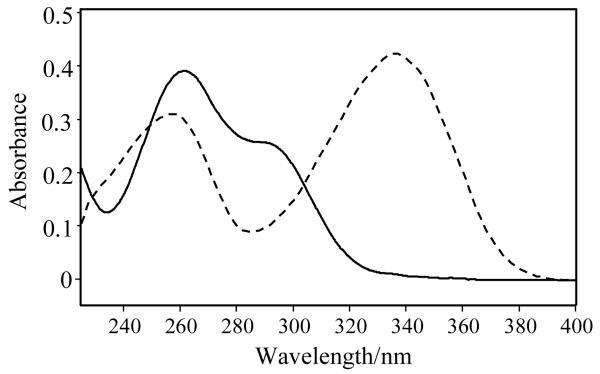
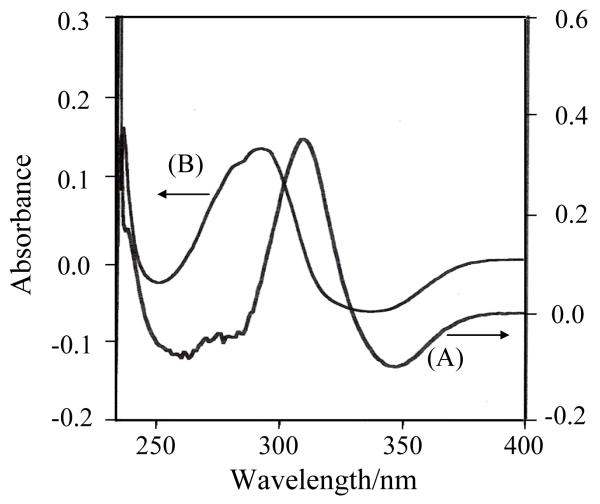
4-HB-CoA has an absorption maximum for its 4-OH form near 260 nm (295 nm, sh), with the most intense absorbance red shifting to 330 nm for the 4-O− entity.[9] The pKa for the ligand in aqueous solution is 8.6. [10] The corresponding absorption spectra for 4-HP-CoA can be seen in Fig. 1 and all values are listed in Table 1. Also, in Table 1 the features from the absorption difference spectra for 4-HB-CoA and 4-HP-CoA binding to the two thioesterases are listed. Fig. 2 compares the absorbance difference spectra for 4-HP-CoA binding to WT Arthro and Pseudo enzymes. There is evidence for positive features near 310 and 290 nm, respectively. Apart from the small red shift for Arthro compared to Pseudo, there is nothing to suggest a major difference in binding behavior for the ligands in the active sites of the two enzymes
Fig.1.
UV absorption spectra of 4-HP-CoA at pH 4 (solid line) and pH 12 (dashed line) superimposed.
Table 1.
Absorption data for 4-HB-CoA and 4-HP-CoA
| 4-HB-CoA | 4-HP-CoA | |
|---|---|---|
| Free 4-OH | 260, 295 nm | 260, 290(sh) nm |
| Free 4-O− | 260, 330 nm | 255, 335 nm |
| Bound to Arth WT | NA* | 310 nm |
| Bound to E73A Arth | 313 nm | 310 nm |
| Bound to Pseudo WT | NA* | 290 nm |
These values could not be measured since 4-HB-CoA is a substrate
Fig. 2.
UV difference absorption spectra of 4-HP-CoA bound to WT Arthrobacter (A) and Pseudomonas (B) thioesterase.
Raman data
The Raman spectra presented in this work are from free and enzyme-bound forms of 4-HB-CoA and 4-HP-CoA. To a good approximation each spectrum is a superposition of modes from 4-hydroxybenzoyl, or 4-hydroxyphenylacyl, and CoA. The former two groups are key since their “ring modes” are intense and very sensitive to ionization of the 4-OH group and can be used to characterize this event. The most intense ring features are set out in Table 2 for both free ligands in their 4-OH and 4-O− states and these can be identified in Fig. 3A and B and 4A and B. In addition to the assignments in Table 2 the Raman features in Fig. 3A can be assigned as follows:
Adenine ring modes at 1514, 1486, 1451, 1380, 1340, 1309, 730 and 537 cm−1 [11]
non-bridging PO2− 1118 cm−1 [12], 980 cm−1 PO42−
Less intense Phe ring modes 1414 cm−1 (19b) and 632 cm−1 (6b)
Sulfur linkages 833 cm−1 (C-S stretch), 660 cm−1 (S-C stretch)
Table 2.
Characteristic Raman band positions of 4-HB-CoA and 4-HP-CoA (cm−1)
| 4-HB-CoA | 4-HP-CoA | |||||
|---|---|---|---|---|---|---|
| Vibrational Mode 1 |
C=O region |
ring 8a, 8b region |
ring 7a′, 9a region |
C=O region |
ring 8a, 8b region |
ring 7a′, 9a region |
| Protonated Form |
1646 (C=O + 8b) |
1604 (8a), 1587 (8b + C=O) |
1224 (7a′), 1174 (9a) |
1658 | 1601, 1584 |
1215, 1176 |
| Deprotonated Form |
1624 (C=O + 8a) |
1574 (8a + C=O), 1530 (7a + 19a) |
1234 (7 a′ + 14), 1158 (9a) |
1626 | 1573, 1532 |
1215, 1167 |
Assignments are given in brackets by the numerical alphabet notation of Wilson according to our previous density functional theory based normal mode analysis published in Dong, et al., Biochemistry 1999, 38, 4198-4206
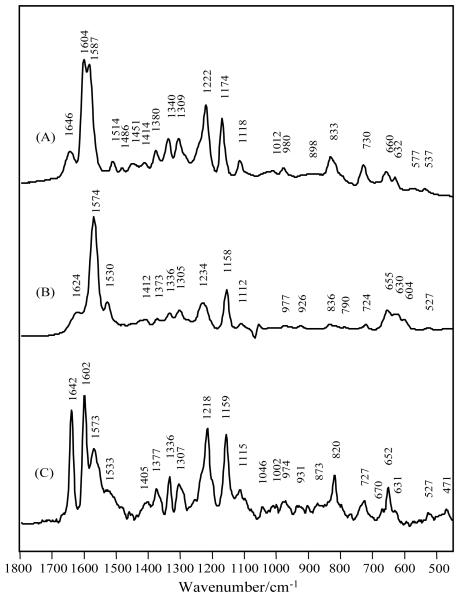
Fig. 3.
Raman spectra of (A) 4-HB-CoA in pH 7.5; (B) 4-HB-CoA in pH 10.5; (C) 4-HB-CoA bound to Arthrobacter E73A thioesterase in pH 7.5 Tris buffer, [E73A]=1.24 mM, [4-HB-CoA] = 0.62 mM.
Fig. 4.
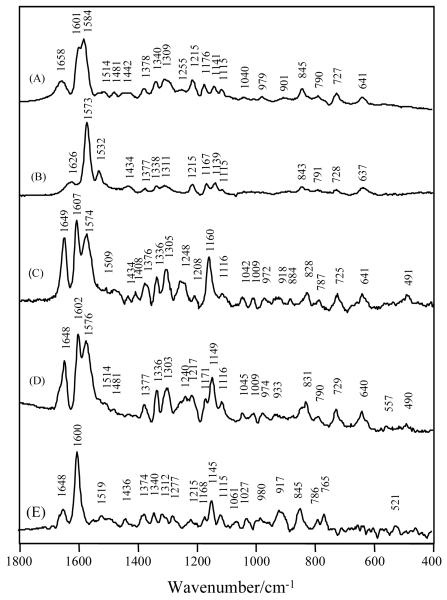
Raman spectra of (A) 4-HP-CoA 1.08 mM in 25 mM Tris pH 7.5 buffer, 0.15 M KCl; (B) 4-HP-CoA 1.9 mM in pH 11.5 buffer; (C) 4-HP-CoA bound to 1.8 mM WT Ar. thioesterase, 25 mM Tris, 0.15 M KCl, pH 7.5 [E]:[L] = 3.5:1.0; (D) 4-HP-CoA bound to E73A Ar. enzyme in pH 7.5. [E]:[L]= 2.5:1.0; (E) 4-HP-CoA in 1.0 mM WT Ps. Thioesterase, 25 mM Tris pH 7.5, 0.15 M KCl, [E]:[L]=3.1:1.0.
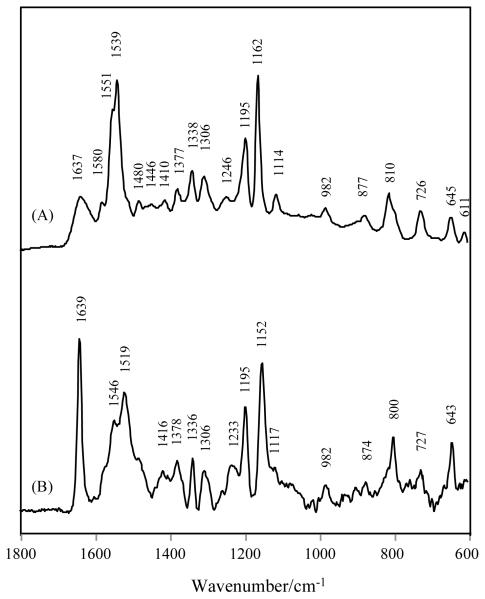
Fig. 3 compares the Raman spectra of the 4-OH and 4-O− forms of 4-HB-CoA in solution, Fig. 3A and 3B, respectively, with the difference spectrum for the ligand bound to the E73A variant of Arthro., Fig 3C. It is apparent immediately that the bound ligand spectrum has contributions from both the 4-OH, giving rise to the band at 1602 cm−1, and 4-O− forms, giving rise to the band at 1573 cm−1, of the ligand. It is likely that the neutral 4-OH form predominates. The last statement comes from the fact that the 647 nm excited spectrum of the 1574 peak for the ionized form, Fig. 3B, is more intense than the 1604 cm−1 band for the neutral 4-OH, using the adenine triplet at 1305, 1336 and 1375 cm−1 as an internal intensity standard. In Fig. 3C, 1602 and 1573 cm−1 are signatures for the neutral and anionic 4-OH ligands. The conclusion that two ionization states are present is reinforced by the appearance of the shoulder on the 1218 band near 1230 cm−1. Of the phenyl ring modes only the 1174 cm−1 band, for 4-OH, is not resolved in Fig 3C. This may be due to the nature of the interaction between the 4-OH and the acid side chain E76 that probably acts as the proton acceptor, see below.
The same conclusion can be drawn for binding of 4-HP-CoA to both WT and E73A variants of Arthro. Fig. 4C and 4D show that bound difference spectra can be interpreted, in particular in the 1500 - 1629 cm−1 region, by a superposition of the 4-OH and 4-O− spectra of the free ligand.
Thus, there is strong evidence from the Raman data that for Arthro. thioesterase there are two species of ligand binding for both 4-HB and 4-HP where there are likely equilibrium populations of both the 4-hydroxy (4-OH) and 4-hydroxide (4-O−) forms present. In contrast, the Raman difference data for 4-HP-CoA binding Pseudo. , Fig 4E, show no evidence for the presence of a form having 4-O−.
The Raman findings provide a simple explanation for the absorption data in Table 1. For Arthro., the difference peak for all experiments involves a superposition of absorption bands for the 4-OH and 4-O− species, resulting in a maximum near 310 nm that reflects the red shift due to the presence of 4-O− forms (Fig.1 and 2). However, for 4-HP-CoA binding to Pseudo., the 4-O− population is missing and the peak in the difference absorption spectrum, due to the 4-OH population alone, is now blue shifted, compared to those for Arthro. complexes, to 285 nm.
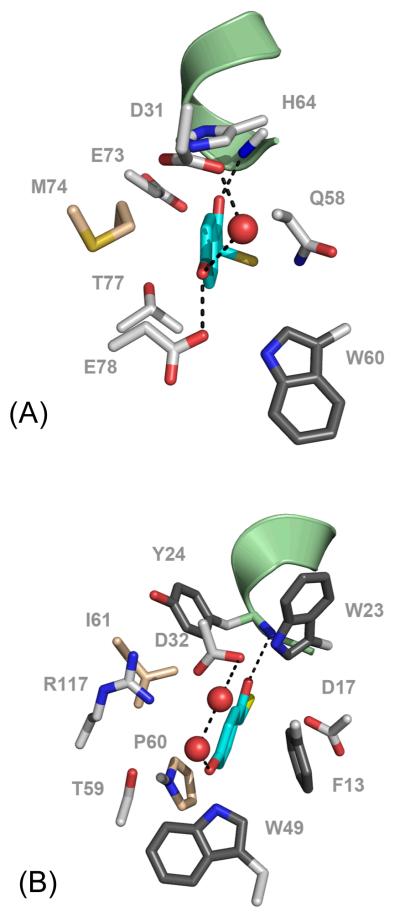
The reason for the presence of two forms in the active site of Arthro but only the 4-OH ligand in the active site of Pseudo is readily understood be comparing the X-ray structures of the ligands in the active sites. As can be seen in Fig. 5 for 4-HP-CoA in the active site of Arthro the side chain of E78 is in close proximity to the 4-OH group of 4-HP. The Raman data show the presence of the neutral and ionized forms for the 4OH. This suggests that the 4-OH proton may be shared between the oxygens of the glutamate and the ligand’s 4-hydroxy group. If the proton is in a double well potential it may be tunneling, in the quantum mechanical sense, between the two positions [13] with the Raman data capturing an “instantaneous” snapshot of the equilibrium populations of the two forms. For the corresponding Pseudo complex there is no amino acid side chain close to the 4-OH group that can act as a proton acceptor and a population of the 4-O− ligand is absent (Fig 5B).
Fig. 5.
Active site structure of (A) Arthrobacter sp SU 4-HB-CoA thioesterase (PDB code #1Q4T) and (B) Pseudomonas sp strain CBS3 4-HB-CoA thioesterase bound with 4-HP-CoA (PDB code #1Q4T). The 4-HP-CoA carbon atoms are colored cyan, oxygen atoms red, sulfur atom yellow; only the 4-hydroxyphenacylthioether unit is displayed. The carbon atoms of the enzyme nonpolar aliphatic side chains are colored wheat where as those of the polar side chains are colored white and those of the aromatic side chains are colored charcoal. The oxygen atoms are colored red, oxygen atoms red and sulfur atoms yellow. The N-terminal region of the polarizing helix is shown in pale green cartoon.
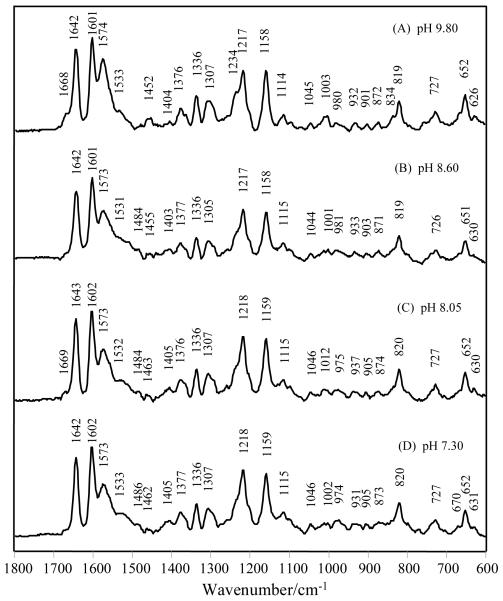
Fig. 6 shows that the relative populations of the 4-OH and 4-O− forms of 4-HB-CoA bound to Arthro. are essentially invariant between pH 7.30 and pH 9.80, whereas based on the microscopic pKa for the ligand in solution pKa 8.6 [10] we would predict mainly the protonated and ionized form of the para-hydroxy group, respectively, at these extremes. As Edsall et al. have discussed [14] the idea of microscopic pKas become subsumed into macroscopic pKas when two ionizable groups are coupled. In other words, in Arthro. the interaction between the 4-OH group and the -COO− side chain of E78 is so favorable that they lose the properties of the free groups and resists change - the system remaining invariant to pH change between pHs 7.3 and 9.8. The interaction may well feature the hydrogen quantum tunneling in a two minima potential well between the -COO− and 4-hydroxy oxygen and we can postulate that this is energetically favored over the 4-hydroxy group taking exclusive possession of the hydrogen and moving slightly away from E78. In the difference spectrum a negative feature due to the -COO− form of E78 might be expected near 1400 cm−1, but it is likely that this is too weak in intensity to appear in Fig. 3, 4 or 6.
Fig. 6.
Raman spectra of 4-HB-CoA bound to E73A Arthrobacter thioesterase at pH 9.80, 8.60, 8.05 and 7.30. The enzyme and ligand concentrations are [E73A]=1.26 mM, [4-HB-CoA]=0.84 mM at pH 9.80; [E73A]=1.32 mM, [4-HB-CoA]=0.88 mM at pH 8.60; [E73A]=1.31 mM, [4-HB-CoA]=0.65 mM at pH 8.05; [E73A]=1.24 mM, [4-HB-CoA]=0.62 mM at pH 7.30.
4-HBA-CoA and 4-HP-CoA bound to Arthrobacter thioesterase have a distinctive C=O group frequency mode that is unusually intense and sharp
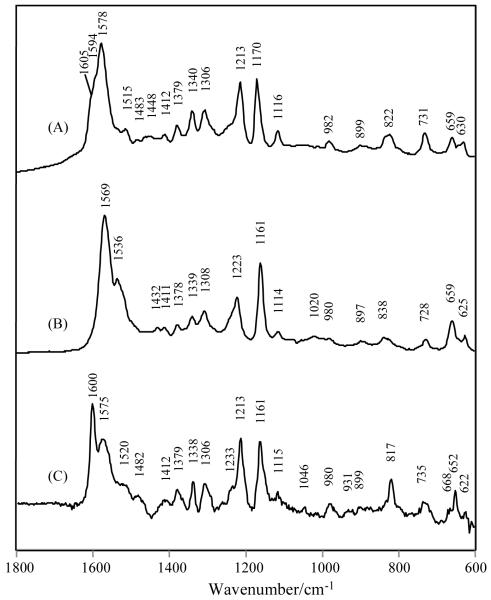
Fig. 3C and 4C and 4D all show an intense band near 1647 cm−1 with a narrow band width at half height, e.g. 13.5 cm−1 in Fig. 3C (Table 3). This can be assigned to the stretch of the thioester C=O from the 4-OH form, but, in our experience, this is most unusual since carbonyls in many similar systems appear less intense and have a broader band profile.[15,16] The C=O stretch from the bound 4-O− form must lie under the profile around 1600 cm−1 and cannot be identified. Another interesting aspect is that the mode giving rise to the 1647 cm−1 feature appears to be almost a pure group frequency. Fig. 7 compares the spectra of 13C=O labeled 4-HB-CoA free in its 4-OH (7A), 4-O− (7B) forms and bound to Arthro. (7C). In Fig.7C the C=O has down-shifted about 42 cm−1 compared to the unlabeled complex. This is very close to the 37 cm−1 predicted for a simple C=O diatomic oscillator. As for the unlabeled complex the spectrum for the Arthro. bound 13C=O ligand is a mixture of the signatures for the 4-OH and 4-O− forms. The group frequency theme is reinforced by Raman data from 4-HB-CoA that has all six phenyl Cs labeled with 13C. By comparing Fig 8A with 3A, for free 4-HB-CoA, the intense 8a and 8b phenyl ring modes are downshifted by about 50 cm−1 upon 13C substitution in the ring. However, the effect on the C=O stretch is small lowering it by 9 cm−1. Similarly, the effect on the C=O stretch for the Phe 13C labeled bound ligand is only to lower it by 3 cm−1. This situation in Fig. 8B produces the unusual spectacle of an intense sharp C=O mode sitting alone in a spectral window.
Table 3.
Peak widths at half height for various C=O and C-S bands (cm−1) in 4-HB-CoA and 4-HP-CoA in aqueous free state and bound to Ar. thioesterase
| Ligand | C=O | C-S | |
|---|---|---|---|
| 4-HB-CoA | pH 7.5, free | 38.6 | 29.0 |
| pH 10.5, free | 40.4 | 31.2 | |
| bound to E73A | 15.1 | 14.5 | |
| 4-HB-CoA with 13C in all phenyl carbons |
pH 7.5, free | 55.3 | 31.2 |
| bound to E73A | 14.5 | 18.6 | |
| 4-HB-CoA with 13C=O |
pH 7.5, free | N.A. | 29.5 |
| pH 10.6, free | 33.8 | ||
| bound to E73A | 15.6 | ||
| 4-HP-CoA | pH 7.5, free | 43.2 | N.A. |
| pH 11.5, free | 55.4 | ||
| bound to WT | 22.2 | ||
| bound to E73A | 25.0 | ||
Fig. 7.
Raman spectra of (A) 13C=O labeled 4-HB-CoA 18.9 mM in pH 7.5 50 mM Tris buffer; (B) 13C=O 4-HB-CoA 6.5 mM in pH 10.6 100 mM NaHCO3; (C) 13C=O 4-HB-CoA bound to 0.620 mM E73A Arthrobacter thioesterase in pH 7.5 50 mM Tris buffer. [S]:[E] = 1.0:1.6.
Fig. 8.
Raman spectra of (A) ring 13C labeled 4-HB-CoA 10 mM in pH 7.5 50 mM Tris buffer; (B) ring 13C labeled 4-HB-CoA in E73A Arthrobacter thioesterase. [E]:[S]=3:1, [E]=1.11 mM.
A further notable aspect of the C=O features is that they appear to undergo only modest polarization in the active sites. In Clarkson et al. (1997) [17] we derived a semi-empirical relationship between the effective H-bonding strength at a benzoyl thioester C=O and the shift in the C=O’s vibrational wavenumbers. The effective H-bond strength is defined as the strength of a H-bond from a single, hypothetical H-bond donor that would down-shift the C=O stretching wavenumbers by the measured amount. The relationship was derived using FTIR to study complexes between 4-methylbenzoyl S-ethyl thioester and H-bond donors in CCl4 as a function of temperature.[17] The key finding is that the change in the enthalpy of the effective hydrogen bonding strength (ΔH) is related to the shift of the C=O stretch wavenumbers (ΔνC=O) by the equation:
| (1) |
νC=O (in the absence of H-bonds) can be estimated at 1666 cm−1 as the average of two literature values, viz. for 4-bromobenzoyl S-ethyl thioester in CCl4 1669 cm−1 [18] and 4-methyl S-ethyl thioester in CCl4 is 1663 cm−1. [17] The value for 4-HB-CoA in the active site of Arthro. is 1642 cm−1. Using equation (1) this gives an effective H-hydrogen bond strength of 21 kJ/mol in the active site. This is more than that for the free ligand H-bonding in water, νC=O = 1658 cm−1 (Fig. 3) with an effective H-bonding strength of ~2 kJ/mol but much less than the effective H-bonding strength for 4-HB-CoA of 67 kJ/mol in the active site in dehalogenase.[16] These numbers should regarded as semi-empirical but there is no doubt that substrate C=Os in the active site of dehalogenase can be subjected to much stronger total polarizing forces compared to the same entity in the active site of Arthro. thioesterase. Although we do not have comparable studies for the 4-hydroxyphenyl acyl group, the position of its C=O group in Pseudo. thioesterase, c. 1648 cm−1 (Fig. 4), suggests that the effect of the active site of Pseudo on C=O polarization is very similar to that for Arthro.
In summary, the thioester C=O groups of 4-HB-CoA and 4-HP-CoA bound to E73A or WT Arthro. appear to be in an environment that provides an effective, albeit modest, H-bonding strength of about 20 kJ/mol. Moreover, the unusually narrow band profile strongly suggests that the C=O is held in a rigid non-fluctuating environment. This compares to the rapidly fluctuating environment for the C=O groups in aqueous solution (Fig. 3A, 4A). For the latter, the “flickering” bombardment of the water molecules about the C=O, constantly making and breaking H-bonds in slightly different orientations leads to a broader flatter C=O profile. For 4-HB-CoA, as can be seen in Table 3 the C=O bandwidths at half height are 14 - 16 cm−1 bound to E73A Arthro, but 40 - 55 cm−1 for the free aqueous ligand. For 4-HP-CoA the corresponding values are 22-25 cm−1 bound to Arthro. and 43 -55 cm−1 for the free ligand (Table 3). The Raman evidence for a constrained C=O group in the active site of the Arthro enzyme is consistent with the X-ray data. The latter show that the B-factor of the C=O of bound 4-HP-CoA is small and typifies those for constrained residues in a macromolecule(PDB code #1Q4T).
Further evidence for the rigidity of the 4-HB-CoA binding in the active site of E73A Arthro. thioesterase comes from analysis of the band near 830 cm−1 which to a reasonable approximation may be assigned to the stretching motion of the thioester (=O)C—S bond.[8] This occurs near 840 cm−1 in the free aqueous 4-HB-CoA but near 820 cm−1 in the Arthro. -bound form (Fig. 3). Since the C-S bond is the catalytically relevant bond that undergoes cleavage during the catalytic reaction, the downshift of this peak suggests a C-S bond with a weakened strength (reduced bond order) upon binding. In addition, the decrease of its band width (see Table 3) reflects the sensitivity of the C-S stretch to changes in the torsional angles of the C(=O)-S—C-C fragment.[19,20] Conformational studies of a variety of X-C(=O)-S-C compounds indicate that the syn anti and syn gauche conformations (C=O double bond syn with respect to the S–C single bond. See Structure A and B in Scheme 2) prevail over the anti anti one (see Structure C in Scheme 2). [19] Furthermore, thioester compounds showing rotational isomerism with respect to the S-C bond (namely, the syn anti and syn gauche conformers in Scheme 2) in the pure states can have different C–S vibrational wavenumbers, the syn anti conformer being 7 cm−1 higher than the syn gauche conformer. Thus, the observation that the C-S stretch band width at half height is 29-34 cm−1 in solution and 15 - 19 cm−1 for Arthro. bound (Table 3) is ascribed to a greater conformational flexibility (both syn anti and syn gauche conformers) in the free compared to the bound ligand (syn gauche conformer only). The X-ray structure (Fig. 5) shows that the thioester S atom is hydrogen bonded to Gln58 and it is likely that this interaction contributes to the sulfur’s relative immobility. Taken together these findings imply that the benzoyl thioester moiety is constrained in the active site in a syn gauche conformer (B in Scheme 2). This conclusion is in agreement with the conformation found by X-ray analysis.[21]
Scheme 2.
Molecular structures of (A) the syn anti conformer; (B) the syn gauche conformer; and (C) the anti anti conformer of S-ethyl 4-hydroxythiobenzoate.
Acknowledgement
The authors gratefully acknowledge support from the NIH: GM-54072 (to P.R.C.) and GM-28688 (to D.D.-M.). J. D. thanks the financial support from the National Natural Science Foundation of China (No. 20974063) and Department of Science and Technology of Zhejiang Province (No. 2009R10040).
References
- [1].Dunaway-Mariano D, Babbitt PC. Biodegradation. 1994;5:259. doi: 10.1007/BF00696464. [DOI] [PubMed] [Google Scholar]
- [2].Scholten JD, Chang KH, Babbitt PC, Charest H, Sylvestre M, Dunaway-Mariano D. Science. 1991;253:182. doi: 10.1126/science.1853203. [DOI] [PubMed] [Google Scholar]
- [3].Zhuang ZH, Song F, Zhang WH, Taylor K, Archambault A, Dunaway-Mariano D, Dong J, Carey PR. Biochemistry. 2002;41:11152. doi: 10.1021/bi0262303. [DOI] [PubMed] [Google Scholar]
- [4].Thoden JB, Holden HM, Zhuang ZH, Dunaway-Mariano D. J. Biol. Chem. 2002;277:27468. doi: 10.1074/jbc.M203904200. [DOI] [PubMed] [Google Scholar]
- [5].Luo LS, Taylor KL, Xiang H, Wei YS, Zhang WH, Dunaway-Mariano D. Biochemistry. 2001;40:15684. doi: 10.1021/bi011536f. [DOI] [PubMed] [Google Scholar]
- [6].Zhuang Z, Gartemann KH, Eichenlaub R, Dunaway-Mariano D. Appl. Environ. Microbiol. 2003;69:2707. doi: 10.1128/AEM.69.5.2707-2711.2003. [DOI] [PMC free article] [PubMed] [Google Scholar]
- [7].Erlich HA. PCR Technology Principles and Applications for DNA Amplification. W.H. Freeman & Co.; New York: 1992. [Google Scholar]
- [8].Dong J, Xiang H, Luo LS, Dunaway-Mariano D, Carey PR. Biochemistry. 1999;38:4198. doi: 10.1021/bi982668k. [DOI] [PubMed] [Google Scholar]
- [9].Mieyal JJ, Webster LT, Siddiqui UA. J. Biol. Chem. 1974;249:2633. [PubMed] [Google Scholar]
- [10].Taylor KL, Liu RQ, Liang PH, Price J, Dunaway-Mariano D, Tonge PJ, Clarkson J, Carey PR. Biochemistry. 1995;34:13881. doi: 10.1021/bi00042a020. [DOI] [PubMed] [Google Scholar]
- [11].Chen YY, Eldho NV, Dayie TK, Carey PR. Biochemistry. 2010;49:3427. doi: 10.1021/bi902117w. [DOI] [PMC free article] [PubMed] [Google Scholar]
- [12].Gong B, Chen JH, Yajima R, Chen YY, Chase E, Chadalavada DM, Golden BL, Carey PR, Bevilacqua PC. Methods. 2009;49:101. doi: 10.1016/j.ymeth.2009.04.016. [DOI] [PMC free article] [PubMed] [Google Scholar]
- [13].Nagel ZD, Klinman JP. Chem. Rev. 2010;110:PR41. doi: 10.1021/cr1001035. [DOI] [PMC free article] [PubMed] [Google Scholar]
- [14].Edsall JT, Martin RB, Hollingworth BR. Proc. Natl. Acad. Sci. U. S. A. 1958;44:505. doi: 10.1073/pnas.44.6.505. [DOI] [PMC free article] [PubMed] [Google Scholar]
- [15].Carey PR, Tonge PJ. Chem. Society Rev. 1990;19:293. [Google Scholar]
- [16].Dong J, Lu XF, Wei YS, Luo LS, Dunaway-Mariano D, Carey PR. Biochemistry. 2003;42:9482. doi: 10.1021/bi0347656. [DOI] [PubMed] [Google Scholar]
- [17].Clarkson J, Tonge PJ, Taylor KL, Dunaway-Mariano D, Carey PR. Biochemistry. 1997;36:10192. doi: 10.1021/bi970941x. [DOI] [PubMed] [Google Scholar]
- [18].Nyquist RA, Potts WJ. Spectrochim. Acta. 1959;7:514. [Google Scholar]
- [19].Ulic SE, Coyanis EM, Romano RM, Della Vedova CO. Spectrochim. Acta Part A-Mol. Biomol. Spectrosc. 1998;54:695. [Google Scholar]
- [20].Lestard MED, Tuttolomondo ME, Wann DA, Robertson HE, Rankin DWH, Ben Altabef A. J. Chem. Phys. 2009;131:214303. doi: 10.1063/1.3267633. [DOI] [PubMed] [Google Scholar]
- [21].Thoden JB, Zhuang ZH, Dunaway-Mariano D, Holden HM. J. Biol. Chem. 2003;278:43709. doi: 10.1074/jbc.M308198200. [DOI] [PubMed] [Google Scholar]


