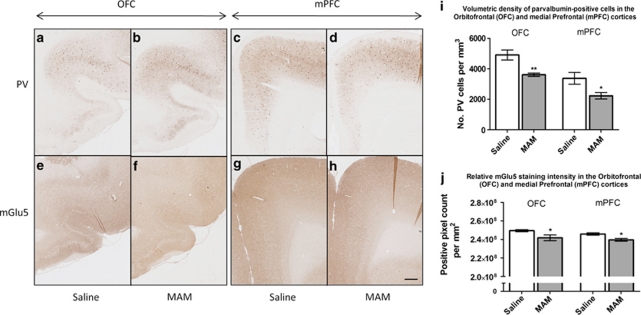
Figure 5.
: (a-h) Photomicrographs of parvalbumin (PV) (a-d)- and mGlu5 (e-h)- immunostained sections from saline (a, c, e, g)- and MAM (b, d, f, h)-treated animals, aged 3 month-old. Scale bar =500 μm. (i-j) Graph bars express the mean±SEM of PV-positive neurons per mm3 (i) and mGlu5-immunoreactivity per mm2 (j) measured in the orbitofrontal cortex (OFC) and the medial prefrontal cortex (mPFC) of saline- (white bars) and MAM-treated animals (gray bars). *p<0.05; **p<0.01 vs the saline-treated controls.

