Abstract
Cytotoxic chemotherapy targets elements common to all nucleated human cells, such as DNA and microtubules, yet it selectively kills tumor cells. Here we show that clinical response to these drugs correlates with, and may be partially governed by, the pre-treatment proximity of tumor cell mitochondria to the apoptotic threshold, a property called mitochondrial priming. We used BH3 profiling to measure priming in tumor cells from patients with multiple myeloma, acute myelogenous and lymphoblastic leukemia, and ovarian cancer. This assay measures mitochondrial response to peptides derived from pro-apoptotic BH3 domains of proteins critical for death signaling to mitochondria. Patients with highly primed cancers exhibited superior clinical response to chemotherapy. In contrast, chemoresistant cancers and normal tissues were poorly primed. Manipulation of mitochondrial priming might enhance the efficacy of cytotoxic agents.
Cancers that respond well to one cytotoxic agent often respond well to other cytotoxic agents even when these agents act through very different mechanisms (as in acute lymphoblastic leukemia). Conversely, cancers that respond poorly to one type of cytotoxic agent often respond poorly to all types of chemotherapy (as in pancreatic cancer or renal cell carcinoma). One important determinant of chemosensitivity is cellular proliferation rate (1). However, the observation that some rapidly dividing tumors are resistant to chemotherapy and that some slowly dividing tumors are chemosensitive suggests that additional factors play a role (2–6). While there are likely agent-specific mechanisms underlying chemosensitivity, such as drug uptake and metabolism, we hypothesized that there might also be a central signaling node engaged by many different forms of chemotherapy and that variation in this node might contribute to differences in drug response. Because many chemotherapeutic agents kill cells through the mitochondrial apoptosis pathway, we focused on this pathway and investigated whether tumor cells show pretreatment variation in the propensity to undergo apoptosis and whether this variation correlates with clinical response to cytotoxic chemotherapy.
Death signaling from chemotherapy ultimately results in activation of pro-apoptotic or inactivation of anti-apoptotic BCL-2 family proteins. If the changes are of sufficient magnitude, the pro-apoptotic proteins BAX and BAK are activated and oligomerize at the mitochondrion, causing mitochondrial outer membrane permeabilization (MOMP) and commitment to programmed cell death (7–9). Preconditions of the mitochondrial apoptotic pathway rely on at least a dozen members of the BCL-2 family (10).
To measure MOMP, we developed a functional assay called BH3 profiling which uses peptides derived from the BH3 domains of pro-apoptotic BH3-only proteins of the BCL-2 family (11–13). In this assay, test mitochondria in whole cells are exposed to BH3 peptides and the resulting MOMP is measured and compared (fig. S1) (13). The peptides gain access by diffusion through a plasma membrane that has been permeabilized with low concentrations of digitonin. MOMP is measured indirectly by the fluorescent dye JC-1, which measures potential across the mitochondrial inner membrane. This potential rapidly degrades in response to MOMP. We previously demonstrated how the pattern of response to selectively interacting peptides such as BAD BH3 and NOXA BH3, which selectively interact with BCL-2 and MCL-1, respectively, can indicate BCL-2 or MCL-1 dependence (11, 12, 14, 15). In this study, to measure overall “priming” for death, irrespective of dependence on individual anti-apoptotic proteins, we instead used the PUMA, BMF and BIM BH3 peptides, which interact more promiscuously with the five main anti-apoptotic proteins (11, 16, 17). All promiscuous peptides gave similar results when used at concentrations that provided a useful dynamic range (fig. S2, A to F). The assay was reproducible when repeated with the same sample on different days (fig. S2, G to I). We use the term “priming” here simply to describe proximity to the apoptotic threshold, as revealed by mitochondrial depolarization induced by promiscuously interacting BH3 peptides, without any comment on the molecular biology underlying this state in any individual cell.
To investigate whether the pretreatment state of the mitochondrial apoptotic apparatus of human cancers correlates with the response to chemotherapy in the clinical setting, we studied 85 total patient tumors, 51 with individual clinical follow-up. The spectrum of cancer types studied—multiple myeloma, acute myelogenous leukemia (AML), acute lymphoblastic leukemia (ALL), and ovarian cancer—was based on availability of viable pretreatment primary cancer specimens. ALL and AML samples were obtained from a local tissue bank, while multiple myeloma and ovarian cancer samples were acquired prospectively. All BH3 profiling was performed by investigators who were blinded to individual clinical outcomes.
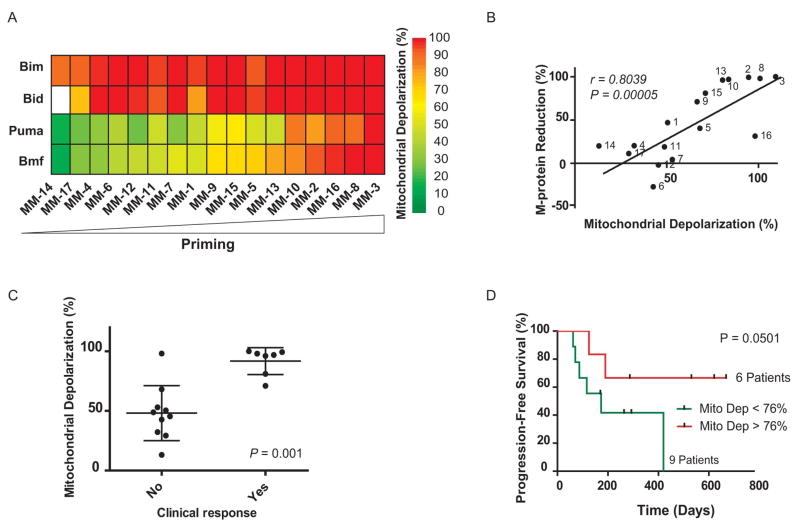
For the analysis of multiple myeloma, we obtained pretreatment bone marrow samples from 17 different patients with the disease (table S1) (18–21) and performed BH3 profiling on CD138 positive myeloma cells in these samples (Fig. 1A and figs. S1A and S3). In most cases of multiple myeloma, serum levels of the monoclonal protein (M-protein) secreted by the malignant clone can be used as a marker of total tumor burden (22). We found a tight correlation between priming and maximal M-protein decrease following treatment whether priming was measured by BMF BH3 (r = 0.80, P = 0.00005, Fig. 1B) or PUMA BH3 (r = 0.78, P = 0.0001, fig. S4A). We also divided patients into responders, who experienced partial responses or better, and non-responders, who had stable disease or inferior responses. (22). Again, strong mitochondrial response to either BMF (P = 0.001, Fig. 1C) or PUMA BH3 (P = 0.01, fig. S4B) peptides prior to treatment was closely associated with better clinical response to chemotherapy. Finally, when we classified the myeloma specimens (from the 15 patients who did not go to bone marrow transplant) into low versus high depolarization response (Fig. 1D), we found that the patients with highly primed myeloma had a longer progression-free survival. Of note, based on a comparison of samples from previously treated versus untreated patients, prior treatment with chemotherapy was strongly associated with reduced priming in cancer cells (fig. S4E).
Fig. 1.
Mitochondrial priming correlates with clinical response to chemotherapy in multiple myeloma. (A) Heat map of mitochondrial depolarization caused by the BIM, BID, PUMA and BMF peptides (measurements of “priming”) in bone marrow samples from 17 patients with multiple myeloma. Individual patient codes are shown along the x axis and samples are ordered according to increasing depolarization by the BMF peptide. Unless indicated otherwise, the concentration of peptide in the assays was 100 μM. Data shown are the mean of 2–3 replicate wells for each peptide. (B) Mitochondrial depolarization caused by the BMF peptide in myeloma patient samples compared with percent reduction in serum level of M-protein, a biomarker of disease burden in multiple myeloma. Each point is labeled with patient code. (C) Mitochondrial depolarization caused by BMF peptide in myeloma patients that were grouped according to their clinical response (see supplementary methods). (D) Patients with highly primed myeloma exhibited superior progression-free survival.
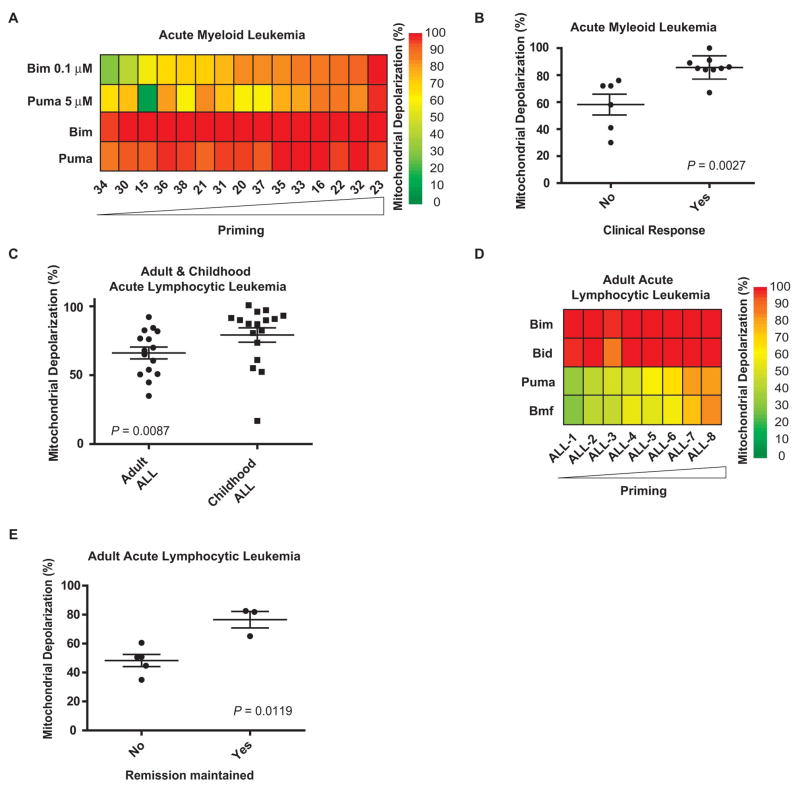
We next studied AML, a leukemia primarily of adults that is curable by intensive chemotherapy alone in approximately 40% of patients (23). We performed FACS-based BH3 profiling (12) (fig. S1B) on malignant myeloblasts from banked, pretreatment bone marrow specimens from 15 adult AML patients (Fig. 2A and table S2). Myeloblasts from patients who achieved a complete remission were more primed than those from patients who did not (P = 0.0027, Fig. 2B and fig. S5, A and B).
Fig. 2.
Mitochondrial priming correlates with clinical response to chemotherapy in AML and ALL. (A) Heat map of mitochondrial depolarization caused by BIM (0.1 and 100 μM) and PUMA (5 and 100 μM) peptides in malignant myeloblasts from bone marrow aspirates of 15 AML patients. Samples are ordered according to increased depolarization by BIM (0.1 μM) peptide. (B) Mitochondrial depolarization caused by BIM (0.1 μM) peptide in AML samples that were grouped according to their clinical response (see supplementary methods). (C) Mitochondrial depolarization caused by PUMA peptide in primary lymphoblasts from bone marrow aspirates of 15 adult and 17 pediatric ALL patients. (D) Heat map of mitochondrial depolarization caused by BIM, BID, PUMA and BMF peptides in primary lymphoblasts from bone marrow aspirates of 8 adult ALL patients with clinical follow-up. Samples are ordered according to increased depolarization by PUMA peptide. (E) Mitochondrial depolarization caused by PUMA peptide in primary lymphoblasts from bone marrow aspirates of 8 adult ALL patients grouped according to whether clinical remission was maintained.
A different leukemia type, ALL, carries a different prognosis in children and adults. Pediatric ALL responds better to therapy and has a better long-term survival rate than adult ALL (80–90% vs. 40%) (24). Examination of 15 adult and 17 childhood ALL samples by BH3 profiling revealed that the adult ALL samples were less primed than the pediatric samples (P = 0.007, Fig. 2C). We were able to obtain individual clinical response information for 8 of the adult samples in Fig. 2C, which we could use to compare with mitochondrial priming. Since complete response is common in ALL, we compared patients who responded and subsequently relapsed versus those who responded and did not relapse (Fig. 2D and table S3). Again, superior clinical outcome associated closely with increased mitochondrial priming (P = 0.0012, Fig. 2E and fig. S5, C to F).
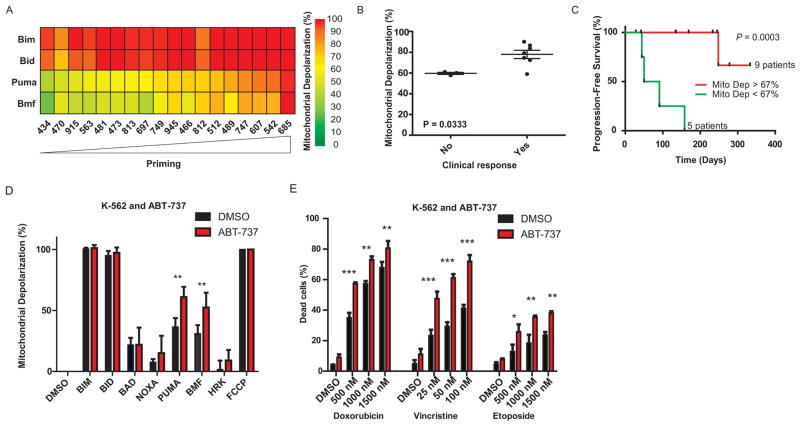
To complement these studies of hematological malignancies, we studied a solid tumor, ovarian cancer, using normalization of CA125, an ovarian tumor marker, as an index of response. We performed BH3 profiling on 18 ovarian cancers (Fig. 3A, fig. S6, and table S4). Of these, 10 cases had persistent elevation of CA125 a month after surgery and prior to chemotherapy so that response to chemotherapy could be scored by normalization of CA125. We found that pre-chemotherapy mitochondrial priming was associated with clinical normalization of CA125. (P = 0.033, Fig. 3B). We examined progression-free survival in 14 cases; of the 18, 4 had no follow-up CA125 values, and thus could not be evaluated. Using a CA125 value that is abnormal and rising after initiation of chemotherapy as an index of progression, we found that highly primed ovarian cancer mitochondria correlated with superior progression free survival (Fig. 3C, P = 0.0003). The results using the PUMA peptide in Fig. 3, A to C, were similar to those using the BMF or BIM peptides (fig. S2, C to F, and fig. S7, A to D). Thus, in multiple myeloma, AML, ALL and ovarian cancer, pretreatment mitochondrial priming was a consistent correlate of better response and clinical outcome, suggesting a fundamental relationship between mitochondria and response to cytotoxic chemotherapy in vivo.
Fig. 3.
Analysis of mitochondrial priming and clinical response in ovarian cancer ](A) to (C)] and analysis of the effect of in vitro perturbation of priming on chemosensitivity of a leukemia cell line [(D) and (E)]. (A) Heat map of mitochondrial depolarization caused by the BIM, BID, PUMA, AND BMF peptides in 18 primary ovarian tumors. Samples are ordered according to increased depolarization by PUMA peptide. (B) Mitochondrial depolarization caused by PUMA peptide in primary ovarian tumors from 10 patients in which CA-125 values remained elevated after surgery and prior to start of chemotherapy. Patients are grouped according to clinical response to chemotherapy (normalization of CA-125). (C) Patients with highly primed ovarian tumors exhibited superior progression-free survival. (D) Mitochondrial depolarization response to BH3 peptides (BH 3 profile) for the K-562 leukemia cell line with and without pretreatment with 2 μM ABT-737 treatment for 16hr. DMSO is a solvent negative control and the ionophore FCCP is a positive control for depolarization. (E) Assessment of cell viability (Annexin V/Propidium Iodide (PI) staining) in K-562 cell line following pretreatment with ABT-737 (mean ± s.d, n = 2) and 48 hour treatment with indicated compounds.
The series of experiments described above revealed interesting correlations between pre-treatment priming of tumor cells and clinical response. We found similar correlations in related in vitro experiments (figs. S7, E and F, and S8 to S10). To explore whether priming was not only a correlate but perhaps a determinant of chemosensitivity, we tested if modulation of priming would alter chemosensitivity. We used ABT-737, a BH3 mimetic drug which binds to anti-apoptotic proteins BCL-2, BCL-XL, and BCLw (25) to increase priming in the myeloid leukemia cell line K562 (Fig. 3D). This resulted in an increase in sensitivity to the chemotherapeutic agents doxorubicin, vincristine, and etoposide (Fig. 3E). This result, in agreement with priming modulation experiments in fig. S11, supports the hypothesis that mitochondrial priming may be a determinant of chemosensitivity.
Clinical success of chemotherapy depends not only on the sensitivity of cancer cells, but also on the relative insensitivity of normal cells in order to provide a “therapeutic index”. Differences in proliferation may play a role, as one of the most rapidly proliferating tissues, the bone marrow, is also the most consistently sensitive to chemotherapy. However, many chemosensitive tumors divide more slowly than tissues such as epidermis and gut epithelium (26–28), and yet experience vastly greater cytoreduction, even elimination, by chemotherapy. This discrepancy suggests that differences in proliferation alone may not fully explain the chemotherapeutic index.
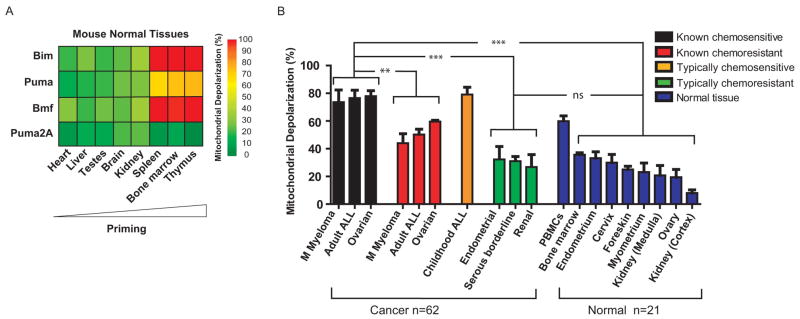
It has been proposed that cancer cells are more sensitive than normal cells to chemotherapy because they are inherently more sensitive to apoptosis, presumably due to their oncogenic lesions (29). To test this model and the possible role of mitochondrial priming as its mechanistic basis, we examined normal tissues of mouse and human origin. We found that relatively chemoresistant murine normal tissues (heart, liver, testes, brain, and kidney) indeed were poorly primed (Fig. 4A and fig. S12). Likewise, relatively chemoresistant normal human tissues [kidney (both cortex and medulla), ovary, myometrium, foreskin, cervix, and endometrium] were poorly primed (Fig. 4B and fig. S13).
Fig. 4.
Low mitochondrial priming in normal mouse and human cells correlates with resistance to chemotherapy. (A) Heat map of mitochondrial depolarization caused by the BIM, PUMA, BMF, and PUMA2A peptides in normal murine tissues. Tissues are ordered according to increased depolarization by PUMA peptide. PUMA2A is a double alanine substituted (loss of function) PUMA peptide serving as a negative control to establish background signal. (B) Comparison of mitochondrial priming among all primary human cancers and normal tissues in this paper. The cancers with clinical follow-up were classified as known chemosensitive or known chemoresistant. Cancers classified as typically chemoresistant (Serous borderline n = 3, Endometrial n = 3 and Renal n = 3) (fig. S14) or typically chemosensitive (childhood ALL n = 17) lacked individual clinical follow-up data. Data shown are mean ± s.d. across all specimens tested. ANOVA was used to demonstrate statistical significance between the different categories with a Tukey’s multiple comparison post test. ns - P value > 0.05; **P value < 0.01 and ***P value < 0.001.
In Fig. 4B we compare the priming of primary human normal and cancer tissues studied in this paper. Additionally, we present results from the typically chemosensitive childhood ALL and typically chemoresistant endometrial cancer, serous borderline ovarian tumor, and renal cell carcinoma samples for which individual clinical chemotherapeutic response data were not available. This comparison shows that mitochondria from chemosensitive cancers are consistently more primed than those from chemoresistant cancers and chemoresistant normal tissues. Priming levels were similar among typically chemoresistant cancers and chemoresistant normal tissues, which may explain why we are unable to find conventional chemotherapy regimens of tolerable toxicity to successfully treat these cancers. Note that the chemosensitive hematologic tissues, including murine bone marrow, thymus, and spleen, and human bone marrow and peripheral blood mononuclear cells (PBMC) are the most highly primed normal tissues tested. Prior work has demonstrated that these are also the most radiosensitive tissues in mice, and the tissues most sensitive to p53 activation (30, 31), suggesting that the apoptotic death observed following these insults may also be regulated by the mitochondrial preset measured by BH3 profiling.
Cytotoxic chemotherapy has been the mainstay of clinical cancer therapy for the past 60 years despite an incomplete understanding of why it works - why it is more toxic to some cancer cells than others, and, most importantly, why it is more toxic to tumors than to normal tissues. Here we show that differential mitochondrial priming correlates with, and may be a determinant of, differential chemosensitivity. One implication of these results is that agents that selectively increase priming in cancer cells, even if they do not cause cell death by themselves, might enhance the response of tumors to conventional chemotherapy (Fig. 3, D and E). A tool like BH3 profiling, which can detect changes in priming, might be useful in identifying such agents.
Acknowledgments
We thank I. Galinsky, J. Feather, R. Berkowitz, N. Horowitz, C. Feltmate, M. Muto, E. Kantoff, K. Daniels, and C. Doyle for assistance with human tumor sample procurement; K.-k. Wong and T. Mitchison for critical review; and K. Stevenson for help with biostatistical analysis. We thank Abbott Laboratories for providing ABT-737. We gratefully acknowledge funding from the Multiple Myeloma Research Foundation (T.N.C.), American Cancer Society Postdoctoral Fellowship 121360-PF-11-256-01-TBG (K.S.), Women’s Cancer Program at DFCI (KS), Gabriel’s Angel Foundation for Cancer Research (T.-T.V.), FLAMES Fund of the Pan-Mass Challenge, NIH RO1CA129974, NIH P01CA068484, and NIH P01CA139980. A.L. is a Leukemia and Lymphoma Society Scholar. A.L. is a Co-founder of, and a paid Advisor to Eutropics Pharmaceuticals, which has purchased a license to BH3 profiling from Dana-Farber Cancer Institute. P.R. is a paid Advisor to Millennium Pharmaceuticals, Celgene Corporation, Novartis Pharmaceuticals, Johnson & Johnson, and Bristol Myers Squibb. T.N.C. and J.A.R. are paid consultants to Eutropics Pharmaceuticals. R.D. is a paid consultant for Novartis Pharmaceuticals and Forma Therapeutics. C.S.M. is a paid consultant for Millennium, Celgene, Novartis, Bristol-Myers Squibb, Merck & Co., Kosan Pharmaceuticals, Pharmion, Centocor, and Amnis Therapeutics. The authors (A.L.) and Dana-Farber Cancer Institute have applied for a patent relating to the use of BH3 profiling in predicting chemosensitivity.
References and Notes
- 1.Skipper HE. Cancer. 1971;28:1479. doi: 10.1002/1097-0142(197112)28:6<1479::aid-cncr2820280622>3.0.co;2-m. [DOI] [PubMed] [Google Scholar]
- 2.Bosch F, et al. Clin Cancer Res. 2008;14:155. doi: 10.1158/1078-0432.CCR-07-1371. [DOI] [PubMed] [Google Scholar]
- 3.Marcus R, et al. Blood. 2005;105:1417. doi: 10.1182/blood-2004-08-3175. [DOI] [PubMed] [Google Scholar]
- 4.Noguchi S. Cancer Sci. 2006;97:813. doi: 10.1111/j.1349-7006.2006.00265.x. [DOI] [PMC free article] [PubMed] [Google Scholar]
- 5.Pasieka JL. Curr Opin Oncol. 2003;15:78. doi: 10.1097/00001622-200301000-00012. [DOI] [PubMed] [Google Scholar]
- 6.Hurwitz JL, McCoy F, Scullin P, Fennell DA. Oncologist. 2009;14:986. doi: 10.1634/theoncologist.2009-0026. [DOI] [PubMed] [Google Scholar]
- 7.Danial NN, Korsmeyer SJ. Cell. 2004;116:205. doi: 10.1016/s0092-8674(04)00046-7. [DOI] [PubMed] [Google Scholar]
- 8.Wei MC, et al. Science. 2001;292:727. doi: 10.1126/science.1059108. [DOI] [PMC free article] [PubMed] [Google Scholar]
- 9.van Delft MF, Smith DP, Lahoud MH, Huang DC, Adams JM. Cell Death Differ. 2010;17:821. doi: 10.1038/cdd.2009.166. [DOI] [PMC free article] [PubMed] [Google Scholar]
- 10.Chipuk JE, Moldoveanu T, Llambi F, Parsons MJ, Green DR. Mol Cell. 2010;37:299. doi: 10.1016/j.molcel.2010.01.025. [DOI] [PMC free article] [PubMed] [Google Scholar]
- 11.Certo M, et al. Cancer Cell. 2006;9:351. doi: 10.1016/j.ccr.2006.03.027. [DOI] [PubMed] [Google Scholar]
- 12.Deng J, et al. Cancer Cell. 2007;12:171. doi: 10.1016/j.ccr.2007.07.001. [DOI] [PubMed] [Google Scholar]
- 13.Ryan JA, Brunelle JK, Letai A. Proc Natl Acad Sci USA. 2010;107:12895. doi: 10.1073/pnas.0914878107. [DOI] [PMC free article] [PubMed] [Google Scholar]
- 14.Brunelle JK, Ryan J, Yecies D, Opferman JT, Letai A. J Cell Biol. 2009;187:429. doi: 10.1083/jcb.200904049. [DOI] [PMC free article] [PubMed] [Google Scholar]
- 15.Del Gaizo Moore V, et al. J Clin Invest. 2007;117:112. doi: 10.1172/JCI28281. [DOI] [PMC free article] [PubMed] [Google Scholar]
- 16.Chen L, et al. Mol Cell. 2005;17:393. doi: 10.1016/j.molcel.2004.12.030. [DOI] [PubMed] [Google Scholar]
- 17.Kuwana T, et al. Mol Cell. 2005;17:525. doi: 10.1016/j.molcel.2005.02.003. [DOI] [PubMed] [Google Scholar]
- 18.Anderson KC. Semin Hematol. 2005 Oct;42:S3. doi: 10.1053/j.seminhematol.2005.10.001. [DOI] [PubMed] [Google Scholar]
- 19.Chauhan D, et al. Oncogene. 1997;15:837. doi: 10.1038/sj.onc.1201253. [DOI] [PubMed] [Google Scholar]
- 20.Hideshima T, et al. Cancer Res. 2001;61:3071. [PubMed] [Google Scholar]
- 21.Chauhan D, et al. Blood. 2010;115:834. doi: 10.1182/blood-2009-03-213009. [DOI] [PMC free article] [PubMed] [Google Scholar]
- 22.Durie BG, et al. Leukemia. 2006;20:1467. doi: 10.1038/sj.leu.2404284. [DOI] [PubMed] [Google Scholar]
- 23.Burnett A, Wetzler M, Lowenberg B. J Clin Oncol. 2011;29:487. doi: 10.1200/JCO.2010.30.1820. [DOI] [PubMed] [Google Scholar]
- 24.Pui CH, Evans WE. N Engl J Med. 2006;354:166. doi: 10.1056/NEJMra052603. [DOI] [PubMed] [Google Scholar]
- 25.Oltersdorf T, et al. Nature. 2005;435:677. doi: 10.1038/nature03579. [DOI] [PubMed] [Google Scholar]
- 26.Kubben FJ, et al. Gut. 1994;35:530. doi: 10.1136/gut.35.4.530. [DOI] [PMC free article] [PubMed] [Google Scholar]
- 27.van Gent R, et al. Cancer Res. 2008;68:10137. doi: 10.1158/0008-5472.CAN-08-2325. [DOI] [PubMed] [Google Scholar]
- 28.Weinstein GD, McCullough JL, Ross P. J Invest Dermatol. 1984;82:623. doi: 10.1111/1523-1747.ep12261462. [DOI] [PubMed] [Google Scholar]
- 29.Evan GI, Vousden KH. Nature. 2001;411:342. doi: 10.1038/35077213. [DOI] [PubMed] [Google Scholar]
- 30.Gudkov AV, Komarova EA. Nat Rev Cancer. 2003;3:117. doi: 10.1038/nrc992. [DOI] [PubMed] [Google Scholar]
- 31.Ringshausen I, O’Shea CC, Finch AJ, Swigart LB, Evan GI. Cancer Cell. 2006;10:501. doi: 10.1016/j.ccr.2006.10.010. [DOI] [PubMed] [Google Scholar]
- 32.McMillin DW, et al. Nat Med. 2010;16:483. doi: 10.1038/nm.2112. [DOI] [PMC free article] [PubMed] [Google Scholar]
- 33.Arumugam T, et al. Cancer Res. 2009;69:5820. doi: 10.1158/0008-5472.CAN-08-2819. [DOI] [PMC free article] [PubMed] [Google Scholar]
- 34.Tai YT, et al. J Immunol Methods. 2000;235:11. doi: 10.1016/s0022-1759(99)00199-4. [DOI] [PubMed] [Google Scholar]
- 35.Durie BG, Salmon SE. Cancer. 1975;36:842. doi: 10.1002/1097-0142(197509)36:3<842::aid-cncr2820360303>3.0.co;2-u. [DOI] [PubMed] [Google Scholar]


