Abstract
Natural illuminant and reflectance spectra can be roughly approximated by a linear model with as few as three basis functions, and this has suggested that the visual system might construct a linear representation of the spectra by estimating the weights of these functions. However, such models do not accommodate nonlinearities in color appearance, such as the Abney effect. Previously, we found that these nonlinearities are qualitatively consistent with a perceptual inference that stimulus spectra are instead roughly Gaussian, with the hue tied to the inferred centroid of the spectrum [J. Vision 6(9), 12 (2006)]. Here, we examined to what extent a Gaussian inference provides a sufficient approximation of natural color signals. Reflectance and illuminant spectra from a wide set of databases were analyzed to test how well the curves could be fit by either a simple Gaussian with three parameters (amplitude, peak wavelength, and standard deviation) versus the first three principal component analysis components of standard linear models. The resulting Gaussian fits were comparable to linear models with the same degrees of freedom, suggesting that the Gaussian model could provide a plausible perceptual assumption about stimulus spectra for a trichromatic visual system.
1. INTRODUCTION
Normal human color vision is trichromatic and thus can represent the color of lights and surfaces with only three numbers derived from the excitations of the three classes of cone receptors. Considerable research has been undertaken to address how—and how well—the underlying illuminant and reflectance spectra can be reconstructed from three spectral samples of the color signal reaching the eye. If illuminant and reflectance spectra varied in random and arbitrary ways, then the visual system could form little useful intuition about the nature of the spectra. Yet natural spectra are instead broad and smoothly varying and thus highly redundant [1–3]. As a result, they can in general be represented with a small number of parameters. However, which specific parameters the visual system might try to estimate remains unknown.
Most analyses of spectral estimation are based on linear models in which the spectra are approximated by a weighted combination of basis functions describing the principal components of variation in the stimulus. These models have provided powerful techniques for recovering spectra in imaging and computer vision, and for understanding the capacities and limitations of the human visual system for representing color [4–6]. Estimates of the requisite number of basis functions for a given task vary, yet many natural spectra can be reasonably well approximated by as few as three components [7–9]. This insight has proven a key factor in understanding the problem of color constancy—and specifically for analyzing the extent to which the color appearance of surfaces can be maintained despite changes in the illuminant [10–12]. It has also led to suggestions that the visual system itself might try to encode spectra by estimating the weights of the inferred functions [13].
Alternatives to linear models remain relatively unexplored. Golz and MacLeod [14,15] provided a theoretical analysis of color constancy by approximating illuminant and reflectance spectra as Gaussian functions. The spectra were thus described by three parameters corresponding to the spectral peak, standard deviation, and amplitude. As these authors noted, a Gaussian model provides a number of computational advantages, including a seamless representation from narrow to broadband spectra, functions with all-positive values consistent with physical spectra, and low dimensionality (because linear models typically include different components for surfaces and illuminants and thus require six parameters to specify the color signals, while the product of two Gaussians is itself a Gaussian). The Gaussian model also has the theoretical advantage of an intuitive correspondence between the dimensions of stimulus variation and the dimensions of color appearance. Simple aperture colors are described by three perceptual attributes corresponding to the hue, saturation, and brightness of the light, and these attributes have at least a rough correspondence to the peak, standard deviation, and intensity of the spectrum.
Mizokami et al. [16] examined inferences underlying color coding by measuring how the hue of Gaussian spectra changed as its spectral bandwidth was varied. Linear models of color vision (which are distinct from linear models of spectra) assume that a given hue corresponds to a fixed balance of activity across the cones or color-opponent mechanisms (e.g., as a fixed ratio of the red–green and blue–yellow dimensions of color appearance). Stimuli with the same hue but different saturation should thus plot along a straight line emanating from the white point in color space. However, varying the saturation of Gaussian spectra instead alters the cone ratios, because as the bandwidth increases the spectrum becomes differentially filtered by the eye’s bandpass spectral sensitivity. Thus the chromaticities of Gaussian spectra with the same peak but different bandwidths fall along curved loci in color space. Mizokami et al. [16] found that when observers made hue matches between narrow and broad Gaussians, they tended to choose stimuli with the same spectral peak and thus different cone ratios. Their result suggested that the visual system might nonlinearly compensate for the eye’s spectral filtering in order to tie the attribute of hue to a fixed property of the stimulus (e.g., spectral peak) rather than a fixed property of the response (e.g., constant response ratios in color-opponent mechanisms). The fact that constant matches were predicted by a property such as the spectral peak was further at least suggestive of the possibility that the visual system might incorporate an inference such as Gaussian spectra to represent color signals.
The nonlinear hue matches observed for Gaussian spectra is also qualitatively consistent with a widely studied nonlinearity in color appearance known as the Abney effect—in which the hue of most wavelengths changes when mixed with a white light [17–22]. In studies of the Abney effect, the wavelength is diluted by adding a fixed desaturant (rather than broadening the spectrum). In this case, the chromaticity of the mixture varies between the fixed chromaticities of the wavelength and the added white, and thus lies on a straight line. Yet over most of the spectrum, to match the hue, observers must change the dominant wavelength of the mixture as the purity varies, so that lines of constant hue are instead curved. The nonlinear response can again be predicted if observers are “inferring” that the stimuli are Gaussian spectra and trying to match the spectral peaks [16]. This suggests that the Abney effect occurs because the visual system is fooled into making the “right” response to the “wrong” stimulus and in particular is applying a Gaussian inference to a non-Gaussian stimulus. Quantitatively this account fails, because as Mizokami et al. noted, the Gaussian assumption predicts much larger hue shifts in the Abney effect at longer wavelengths than is actually observed [16]. Nevertheless, the presence of these nonlinearities in color appearance again suggests that the visual system may be giving substantial weight to a nonlinear inference about spectra.
In the present study, we asked how well a Gaussian model could account for physical spectra. As noted, the utility of linear models is that they can accurately approximate natural spectra with a small number of parameters. The extent to which the spectra can instead be approximated by a simple Gaussian remains untested, though there are some natural reflectances, with, for example, the spectra of cutoff filters or of additive mixtures of different narrowband spectra, for which the fit is likely to be poor [23]. If in general natural color signals are poorly described by Gaussians, then this would arguably be a poor model for simulating or analyzing the interplay between lights and surfaces, and thus a poor assumption for the visual system to adopt. To assess this, we examined a wide range of illuminant and reflectance spectra from available databases, hyperspectral images, and our own measurements to test how well the curves could be fit by either a simple Gaussian with three parameters (amplitude, peak wavelength, and standard deviation) versus the first three principal component analysis (PCA) components of standard linear models. The results suggest that the approximations are nearly comparable in the two cases, and thus suggest that an inference like a Gaussian model provides a viable perceptual assumption for natural spectra.
2. ANALYSIS
A. Models
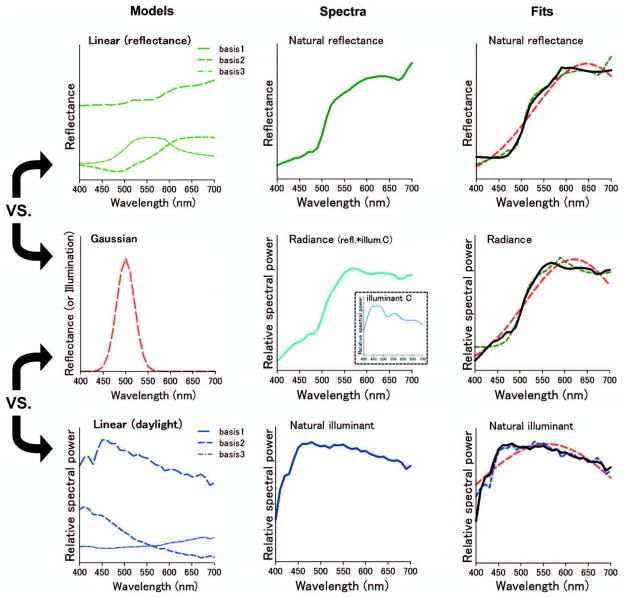
The left panels of Fig. 1 illustrate the Gaussian and linear functions used for fitting the spectra. In the Gaussian model, both illuminant and surface reflectance spectra S(λ) were approximated by varying the amplitude (A), peak wavelength (peak), and standard deviation (σ) of the function:
where positive and negative values of A corresponded to spectra with a peak or a trough, respectively.
Fig. 1.
Gaussian or linear models for reflectance or illuminants and fits to the spectra.
In the linear models, the observed spectrum S(λ) was fit by a weighted sum of basis functions [S1(λ), S2(λ), and S3(λ)]:
where M1–M3 are the weights. The number of components was limited to three so that the models had the same number of parameters.
Note that unlike the Gaussian model, there is not a single form of the linear model because the basis functions are specific to the datasets from which they are acquired. We examined two standard sets of basis functions. For reflectance spectra, the fits were performed with the first three functions derived by Cohen from a principal components analysis of Munsell spectra [24]. Similar functions have been found for a wide range of reflectances, and the Cohen functions have thus been shown to provide a good approximation to many surface spectra [2]. For illuminant spectra, we instead used the principal components derived from a large sample of daylight spectra by Judd et al. [25].
B. Datasets
We fit the spectra for a wide range of natural or naturalistic reflectances and illuminants acquired from the following sources:
Munsell colors matte (Joensuu Spectral Database) [26,27]: the reflectance spectra of 1269 matte Munsell color chips.
Cambridge database of natural spectra [28]: reflectance spectra of fruits eaten by primates, foliage, and young edible leaves in French Guiana and Uganda.
Standard object color spectra database for color reproduction evaluation (SOCS) (Japanese Standards Association) [29]. Only datasets including natural spectra were used, consisting of SOCS flower, SOCS leaves, SOCS Krinov, and SOCS skin.
Hyperspectral images: downloadable scenes from the hyperspectral images of natural rural scenes from the Minho region of Portugal containing rocks, trees, leaves, grass, and earth acquired by Nascimento et al. (scenes 1, 2, 3, 4 from “hyperspectral images of_natural_scenes, 2002”[30] and scenes 1, 2, 3, 4, 5, 8 from “hyperspectral images of_natural_ scenes, 2004” [31]). Spectra were sampled from every 10th pixel in the scenes.
Daylight spectra from India and Nevada: illuminant spectra acquired by the authors as part of another project [32].
Daylight spectra (Joensuu spectral database) [27]: a sample of 15 different daylight illuminants.
C. Fitting Procedure
As shown in Fig. 1, the Gaussian and either PCA (linear) model were fit to each spectrum. Separate fits were estimated for each dataset, because they corresponded to different classes of objects or illuminants, as shown by the open circles in Table 1. The representation of the spectra in the original datasets were in terms of reflectance spectra (Joensuu [Munsell], Cambridge database, and SOCS), radiance (hyperspectral images), or illuminant spectra (daylight samples). Fits were performed both for the reflectance spectra and radiances converted by calculating the product of reflectance and illuminant C.
Table 1.
Spectral Data for Fitting
| Dataset | Spectra Type | N | Fitting Data
|
||
|---|---|---|---|---|---|
| Reflectance | Illuminant | Radiance | |||
| Joensuu (Munsell) | reflectance | 1269 | ○ | — | ○ (illuminant C) |
| Cambridge database | reflectance | 1862 | ○ | — | ○ (illuminant C) |
| SOCS (flowers) | reflectance | 148 | ○ | — | ○ (illuminant C) |
| SOCS (leaves) | reflectance | 92 | ○ | — | ○ (illuminant C) |
| SOCS (Krinov) | reflectance | 341 | ○ | — | ○ (illuminant C) |
| SOCS (skin) | reflectance | 2483 | ○ | — | ○ (illuminant C) |
| Natural scene 1 (02) | radiance | 6068 | — | — | ○ |
| Natural scene 2 (02) | radiance | 5740 | — | — | ○ |
| Natural scene 3 (02) | radiance | 6068 | — | — | ○ |
| Natural scene 4 (02) | radiance | 3534 | — | — | ○ |
| Natural scene 21 (04) | radiance | 13566 | — | — | ○ |
| Natural scene 22 (04) | radiance | 13260 | — | — | ○ |
| Natural scene 23 (04) | radiance | 12954 | — | — | ○ |
| Natural scene 24 (04) | radiance | 12596 | — | — | ○ |
| Natural scene 25 (04) | radiance | 11926 | — | — | ○ |
| Natural scene 28 (04) | radiance | 13668 | — | — | ○ |
| Joensuu (daylight) | illuminant | 15 | — | ○ | — |
| Daylight (Sierra) | illuminant | 782 | — | ○ | — |
| Daylight (India) | illuminant | 131 | — | ○ | — |
For fitting, the spectra data were formatted to 400–700 nm in 10 nm steps except for SOCS_Krinov (ranging from 400–650 nm) and the 2002 hyperspectral image set (ranging from 410 to 700 nm). The spectra were also normalized by the maximum value within each dataset. Fits were performed with the MATLAB optimization toolbox and the “lsqcurvefit” function and the Levenberg–Marquardt algorithm and minimized the root-mean-square (rms) error between the observed and predicted spectra. Predicted spectral values could be negative. Fits to each spectrum were estimated five times with different randomized initial values to avoid convergence at local minima, with the reported results based on the best fit in each case.
3. RESULTS
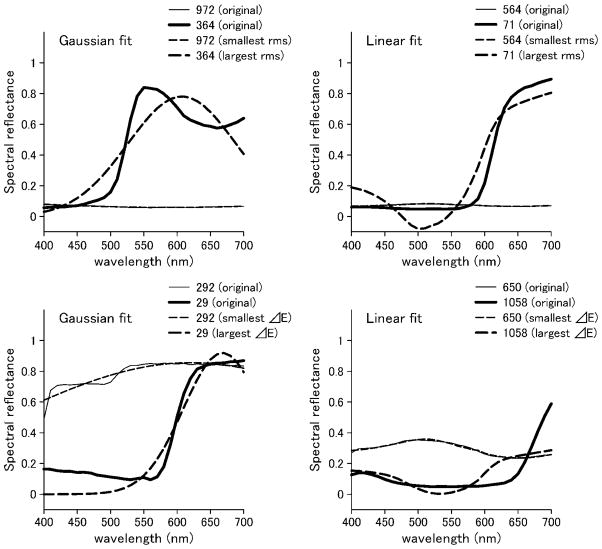
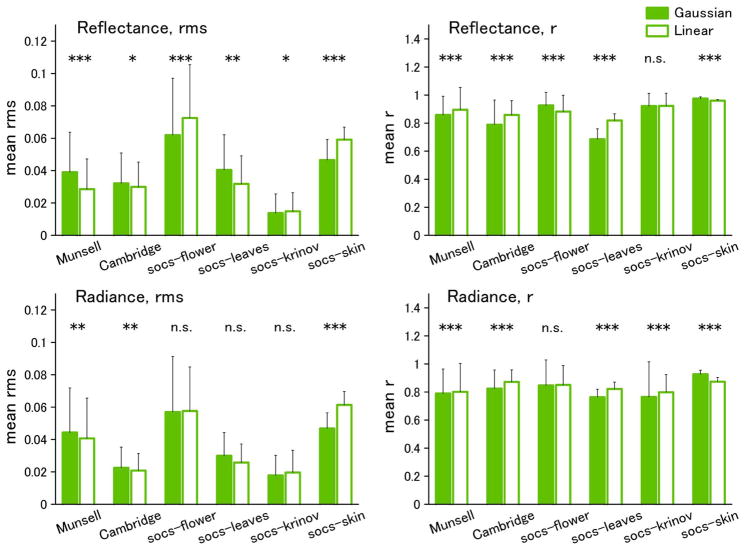
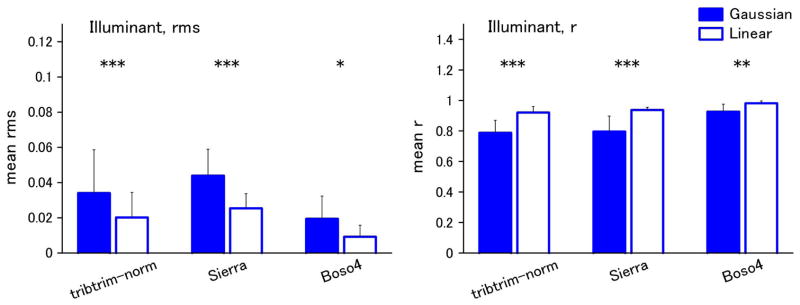
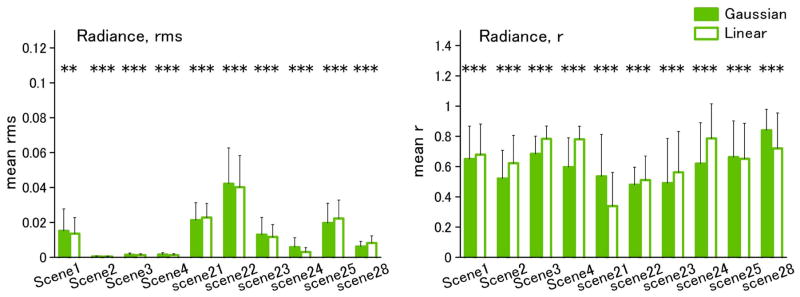
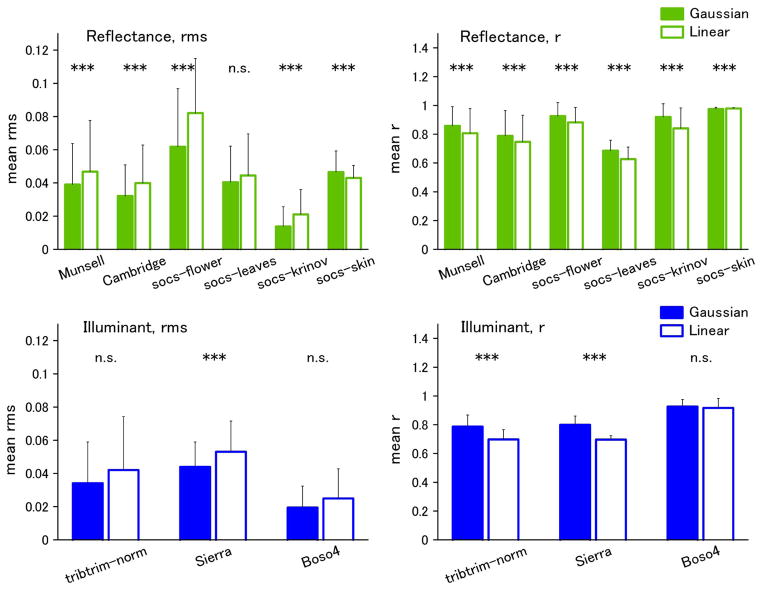
Figure 2 shows examples of the best and worst fits of the Gaussian and linear models for the individual spectra of Munsell reflectances. In the top panels, the criterion is based on rms error, while in the bottom panels, the fits are instead compared in terms of the resulting color difference (ΔEab) in the CIE L*a*b* space. We assessed the differences between the model fits across the full set of spectra for each dataset. These are shown in Figs. 3–5 for fits to the physical spectra, in terms of both the average rms error and mean correlation coefficient between the estimated and actual spectra. Asterisks above the bars in the figures indicate significant differences (p < 0.05) between the average error for the Gaussian versus linear fits, based on the Wilcoxon test. Although the linear fits are superior overall to the Gaussian fits for the reflectance spectra, the approximations from the two models are nevertheless comparable, with smaller mean errors for the Gaussian approximation for three of the six datasets (flower, Krinov, and skin) (Fig. 3). Moreover, the two models perform roughly equally well in approximating the spectra when the spectra are converted to radiance under the illuminant C source. This is also seen in the fits to the radiance spectra for the hyper-spectral images (Fig. 4). Thus the two models reconstruct the radiance spectra with a similar level of accuracy. Conversely, for the illuminant spectra, the fits are consistently better with the linear model (Fig. 5).
Fig. 2.
Examples of best and worst fits to individual spectra from the Munsell set. Top, spectral reflectance of surfaces with the smallest and the largest rms between original and fitting curves. Left: Gaussian fit for reflectance data no. 972 (rms = 0.0018, thin line) and no. 364 (rms = 0.12, thick line). Right, linear fit for reflectance data no. 564 (rms = 0.0015, thin line) and no. 71 (rms = 0.10, thick line). Solid and dashed lines show original and fitting spectra, respectively. Bottom, best and worst fits by the criterion of ΔEab. Left, Gaussian fit for reflectance data no. 292 (ΔEab = 0.49, thin line) and no. 29 (ΔEab = 74, thick line). Right, linear fit for reflectance data no. 650 (ΔEab = 0.096, thin line) and no. 1058 (ΔEab = 33, thick line).
Fig. 3.
(Color online) Results of Gaussian and Linear fits to reflectance databases. Left panels, mean rms error; right panels, mean correlation coefficient (r). Error bars indicate standard deviation within each dataset. Significant differences between the linear and Gaussian fits are shown by the symbols above the bars [*(p < 0.05), ** (p < 0.01), ***(p < 0.001)].
Fig. 5.
(Color online) Gaussian and linear fits for illuminant spectra. Left, mean rms error; right, mean correlation.
Fig. 4.
(Color online) Gaussian and linear fits to the spectra from individual hyperspectral images. Left column, mean rms; right column, mean correlation, r.
A better overall fit with the linear models for the reflectance and illuminant spectra is not surprising, for as noted, we used separate basis sets that were derived from each class of spectra and thus optimized for these spectra. In contrast, the Gaussian model has the same functional form in all cases. The fact that it can nevertheless perform reasonably well suggests that it can provide a reasonable and general approximation for many natural color signals. In contrast, there is no established single set of linear functions appropriate for estimating spectra (and thus no clear general basis set that the visual system should adopt) [6]. For example, Fig. 6 compares the models when we instead used the illuminant basis functions to predict the reflectance spectra and vice versa. In this case, the Gaussian model is superior in most cases.
Fig. 6.
(Color online) Fits to the reflectance spectra with the illuminant basis functions and vice versa. Left, mean rms error; right, mean correlation.
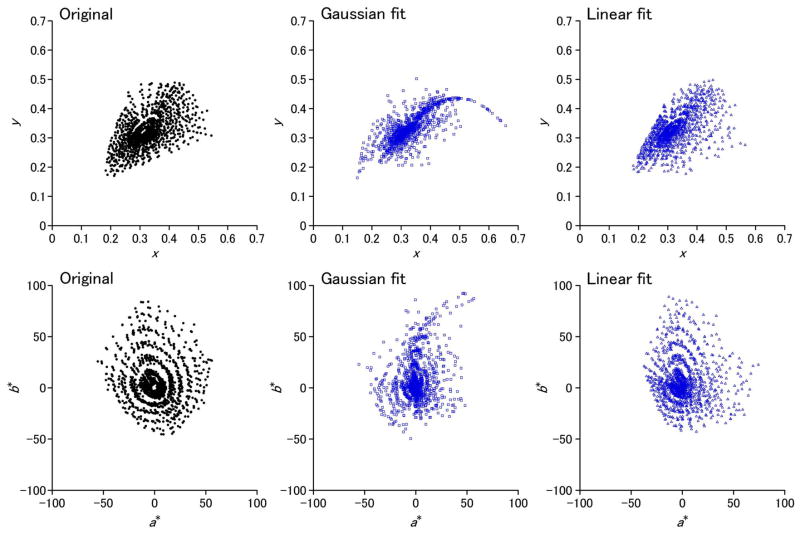
The fits to the physical spectra do not indicate the visual consequences of errors in the approximations. To examine these, we also calculated the chromaticity coordinates for the actual and estimated spectra for the Munsell samples under illuminant C. These coordinates are plotted on the CIE 1931 xy chromaticity diagram and the CIE 1976 a*b* plane in Fig. 7. In this case, the mean color difference ΔEab between the linear approximation and original functions (ΔEab mean, 4.26; s.d., 3.65) is roughly half the error between the Gaussian and original (ΔEab mean, 8.82; s.d., 7.50), which is perhaps again to be expected because the basis functions were directly derived for Munsell samples. Nevertheless, both models preserve the general structure of the chromatic variations.
Fig. 7.
(Color online) Chromaticity coordinates for the actual Munsell spectra under illuminant C (left), or from the best-fitting Gaussian (middle) or linear (right) approximations. Coordinates are shown in the CIE 1931 xy chromaticity diagram (top) or the CIE 1976 a*b* plane (bottom).
However, a notable deviation in the Gaussian model is in the chromaticities for the more saturated orange and reddish spectra, where the predicted chromaticities form a tail converging onto the spectral locus. The lower left panel of Fig. 2 (for Munsell spectrum 29) provides an illustration of why the Gaussian approximation breaks down for these samples. Because a simple Gaussian of the type we modeled has only a single parameter to control dispersion, it cannot capture a steep steplike change from a nonzero baseline. Saturated oranges and reds are approximated by narrowband spectra with longwave peaks. These effectively stimulate only the L and M cones, and thus the chromaticities remain close to the long-wave tail of the spectral locus.
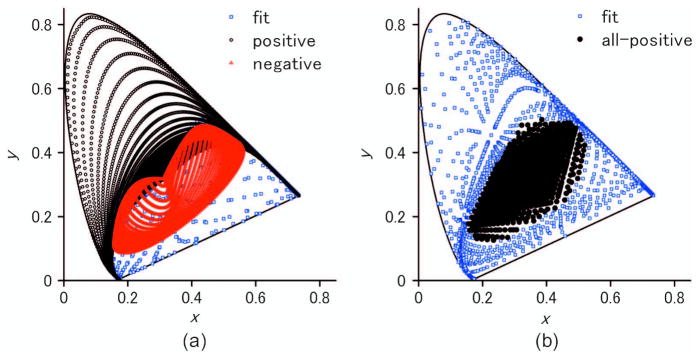
This behavior of the Gaussian model at longer wavelengths can also account for the breakdown of the Gaussian predictions for the Abney effect at longer wavelengths, as noted by Mizokami et al. [16]. Again they found that the predicted hue shifts were much larger than observed at these wavelengths. This is likely because broadening the spectra initially shifts the chromaticity along the spectral locus rather than toward the white point, so that there is in fact no corresponding Gaussian stimulus with the chromaticity of some mixtures of a narrowband long wavelength with white light. This is further shown in Fig. 8(a), which plots the range of chromaticities that can be created by a simple Gaussian spectrum with a positive (black) or negative (red) peak. Over much of the region from purple to red, there is no corresponding spectrum. Consequently, a deficiency of the simple Gaussian model is that it does not entirely pave the space and thus could not provide a common general assumption about all chromaticities. On the other hand, it extends over a much greater gamut than three component linear models that have been derived from and are thus optimized only for broad natural spectra [Fig. 8(b), black symbols].
Fig. 8.
(a) Gamut of chromaticities achievable with positive Gaussian spectra forming peaks (black) or troughs (red), sampled for peak intervals of 1 nm and standard deviation intervals of 5 nm. Gamut achievable with positive and negative Gaussian spectra (blue) is also shown. (b) Gamut for all-positive reflectance functions for the linear reflectance model (black) and the gamut achievable with positive and negative linear spectra (blue).
4. DISCUSSION
As noted in the Introduction, previous studies have modeled natural spectra as Gaussians in order to explore characteristics of color appearance. Golz and MacLeod [14,15] examined color constancy—specifically how well the visual system could recover surface color under a change in illumination. They showed that in a perfect Gaussian world, cone-specific normalization could completely compensate for the chromaticity of the surface but not for the lightness, and they suggested that this pattern was consistent with a major contribution of von Kries adaptation to color constancy [33–36]. This analysis depends on how well simple Gaussians can approximate illuminant and reflectance spectra as well as the photoreceptor sensitivities. Our results suggest that they can describe natural color signals about as well as a linear model with the same number of parameters, and thus they do provide an equally reasonable model for simulating spectra.
Mizokami et al. [16] instead measured the perceived hue of actual Gaussian spectra. Their study was designed to measure hue constancy—specifically whether constant hues could be associated with constant physical features of the spectra. As noted, they found that for lights differing in bandwidth, constant hues were tied to roughly a constant spectral peak, even though these lights corresponded to different vector directions in the cone-opponent space. From this they suggested that the visual system might infer Gaussian-like spectra and try to represent hue by estimating the spectral peak. This inference would seem of questionable value if the spectra varied in ways that did not have a simple maximum. Yet again our results suggest that representing the color signal as a Gaussian would provide roughly the same predictive value as a representation in terms of linear basis functions. Thus in both cases a Gaussian model could provide a viable perceptual inference about natural spectra.
Importantly, the Gaussian model was not better than the linear approximation, and for some classes of spectra (e.g., illuminants) it was consistently worse. These comparisons depend on the specific application, for linear models have the advantage that they can be optimized for specific contexts, while the Gaussian model we used has the advantage that it is independent of any specific choice of samples. Moreover, it is well established that three basis functions are, in many cases, insufficient for accurately characterizing physical spectra [2,8,9]. A Gaussian model performed no better, and on average it accounted for only about 56% of the variance (compared to 60% for the linear models we tested). Thus if the goal of an analysis requires a high fidelity of the represented spectrum, then higher dimensional models will usually be necessary. Finally, while we chose Gaussians for their simplicity, it remains possible that there are other functional forms that would describe spectra more accurately or would have the advantage of capturing the causal structure of color signals [2,5,23]. A chief advantage of the Gaussian model is that it provides a computationally simple model with parameters that can be intuitively associated with the primary attributes of color appearance. Here again, there are very different functions that might share these features. For example, Logvinenko recently proposed an object color space based on step functions which again have parameters that loosely correspond to hue, saturation, and brightness [37]. However, it remains untested how well these functions would fit natural spectra or whether they would predict similar patterns of nonlinear variation in hue and saturation.
Our analyses also highlight further deficiencies in the Gaussian model. An important feature of the model is that it can provide a common description of a wide range of spectra from broadband to narrow. However, as we show in Fig. 8, chromaticities in the red and purple region of the color gamut cannot be realized by a simple Gaussian. This issue was noted previously by Mizokami et al. in the failure of the predictions for the Abney effect at long wavelengths [16]. Moreover, to generate predictions for the Abney effect along the extraspectral line, they had to elaborate the model by using inverted Gaussians with negative minima (so that the modeled spectrum had two components corresponding to the inverted tails). Notably, this again generated constant hue loci that were qualitatively consistent with the Abney effect. However, these problems suggest that a simple Gaussian inference could not be applicable to all regions of color space, in the same way that broadband basis functions cannot extend to narrowband signals.
Finally, an important question remains how the visual system could learn or why it should adopt any inference about the higher order shape of color spectra beyond the relative activity of the cones. Our evidence is only circumstantial in that such inferences have proven to successfully predict many aspects of visual coding, and specifically that assuming this inference for color allowed us to qualitatively predict which cone signals would be associated with a common hue [16]. Understanding how this inference could be achieved would require analysis of the information and mechanisms that could allow the visual system to learn and thus compensate for its spectral sensitivity. In turn, understanding whether and why the visual system might adopt this assumption would benefit from analyses of how natural spectra vary in purity under different contexts and which objects and states should be associated with a common attribute of hue.
Acknowledgments
The authors are supported by the National Institutes of Health (NIH) through grant EY-10834 (MW) and the Ministry of Education, Culture, Sports, Science and Technology of Japan (MEXT) KAKENHI program through grant 23135506 (YM).
References
- 1.Bonnardel V, Maloney LT. Daylight, biochrome surfaces, and human chromatic response in the Fourier domain. J Opt Soc Am A. 2000;17:677–686. doi: 10.1364/josaa.17.000677. [DOI] [PubMed] [Google Scholar]
- 2.Maloney LT. Evaluation of linear models of surface spectral reflectance with small numbers of parameters. J Opt Soc Am A. 1986;3:1673–1683. doi: 10.1364/josaa.3.001673. [DOI] [PubMed] [Google Scholar]
- 3.Stiles WS, Wyszecki G, Ohta N. Counting metameric object-color stimuli using frequency-limited spectral reflectance functions. J Opt Soc Am. 1977;67:779–784. [Google Scholar]
- 4.Hurlbert A. Computational models of color constancy. In: Walsh V, Kulikowski JJ, editors. Perceptual Constancies. Cambridge Univ; 1998. pp. 283–322. [Google Scholar]
- 5.Maloney LT. Physics-based approaches to modeling surface color perception. In: Gegenfurtner KR, Sharpe LT, editors. Color Vision: From Genes to Perception. Cambridge Univ; 1999. pp. 387–416. [Google Scholar]
- 6.Marimont DH, Wandell BA. Linear models of surface and illuminant spectra. J Opt Soc Am A. 1992;9:1905–1913. doi: 10.1364/josaa.9.001905. [DOI] [PubMed] [Google Scholar]
- 7.Dannemiller JL. Spectral reflectance of natural objects: how many basis functions are necessary? J Opt Soc Am A. 1992;9:507–515. [Google Scholar]
- 8.Nascimento SM, Foster DH, Amano K. Psychophysical estimates of the number of spectral-reflectance basis functions needed to reproduce natural scenes. J Opt Soc Am A. 2005;22:1017–1022. doi: 10.1364/josaa.22.001017. [DOI] [PubMed] [Google Scholar]
- 9.Parkkinen JPS, Hallikainen J, Jaaskelainen T. Characteristic spectra of Munsell colors. J Opt Soc Am A. 1989;6:318–322. [Google Scholar]
- 10.Foster DH. Color constancy. Vision Res. 2011;51:674–700. doi: 10.1016/j.visres.2010.09.006. [DOI] [PubMed] [Google Scholar]
- 11.Shevell SK, Kingdom FA. Color in complex scenes. Ann Rev Psychol. 2008;59:143–166. doi: 10.1146/annurev.psych.59.103006.093619. [DOI] [PubMed] [Google Scholar]
- 12.Smithson HE. Sensory, computational and cognitive components of human colour constancy. Philos Trans R Soc London B. 2005;360:1329–1346. doi: 10.1098/rstb.2005.1633. [DOI] [PMC free article] [PubMed] [Google Scholar]
- 13.D’Zmura M, Lennie P. Mechanisms of color constancy. J Opt Soc Am A. 1986;3:1662–1672. doi: 10.1364/josaa.3.001662. [DOI] [PubMed] [Google Scholar]
- 14.Golz J, MacLeod DI. Influence of scene statistics on colour constancy. Nature. 2002;415:637–640. doi: 10.1038/415637a. [DOI] [PubMed] [Google Scholar]
- 15.MacLeod DIA, Golz J. A computational analysis of colour constancy. In: Mausfeld R, Heyer D, editors. Colour Perception: Mind and the Physical World. Oxford University; 2003. pp. 205–242. [Google Scholar]
- 16.Mizokami Y, Werner JS, Crognale MA, Webster MA. Nonlinearities in color coding: compensating color appearance for the eye’s spectral sensitivity. J Vision. 2006;6(9):12. doi: 10.1167/6.9.12. [DOI] [PMC free article] [PubMed] [Google Scholar]
- 17.Burns SA, Elsner AE, Pokorny J, Smith VC. The Abney effect: chromaticity coordinates of unique and other constant hues. Vision Res. 1984;24:479–489. doi: 10.1016/0042-6989(84)90045-2. [DOI] [PubMed] [Google Scholar]
- 18.Kurtenbach W, Sternheim CE, Spillmann L. Change in hue of spectral colors by dilution with white light (Abney effect) J Opt Soc Am. 1984;1:365–372. doi: 10.1364/josaa.1.000365. [DOI] [PubMed] [Google Scholar]
- 19.Pridmore RD. Effect of purity on hue (Abney effect) in various conditions. Color Res Appl. 2007;32:25–39. [Google Scholar]
- 20.de W, Abney W. On the change in hue of spectrum colors by dilution with white light. Proc R Soc London Ser A. 1909;83:120–127. [Google Scholar]
- 21.Ayama M, Nakatsue T, Kaiser PK. Constant hue loci of unique and binary balanced hues at 10, 100, and 1000 Td. J Opt Soc Am A. 1987;4:1136–1144. doi: 10.1364/josaa.4.001136. [DOI] [PubMed] [Google Scholar]
- 22.Kulp TD, Fuld K. The prediction of hue and saturation for non-spectral lights. Vision Res. 1995;35:2967–2983. doi: 10.1016/0042-6989(95)00049-6. [DOI] [PubMed] [Google Scholar]
- 23.Maloney LT. The importance of realistic models of surface and light in the study of human color vision. In: Mausfeld R, Heyer D, editors. Colour Perception: Mind and the Physical World. Oxford University; 2003. pp. 243–246. [Google Scholar]
- 24.Cohen J. Dependency of the spectral reflectance curves of the Munsell color chips. Psychonom Sci. 1964;1:369–370. [Google Scholar]
- 25.Judd DB, MacAdam DL, Wyszecki G. Spectral distribution of typical daylight as a function of correlated color temperature. J Opt Soc Am. 1964;54:1031–1040. [Google Scholar]
- 26.Kohonen O, Parkkinen J, Jääskeläinen T. Databases for spectral color science. Color Res Appl. 2006;31:381–390. [Google Scholar]
- 27.Spectral database. University of Joensuu Color Group; http://spectral.joensuu.fi/ [Google Scholar]
- 28.Cambridge database of natural spectra. http://vision.psychol.cam.ac.uk/spectra/
- 29.Standard object color spectra database for colour reproduction evaluation (SOCS), TR X 0012:2004 (ISO/TR 16066:2003) Japanese Standards Association; [Google Scholar]
- 30.Nascimento SM, Ferreira FP, Foster DH. Statistics of spatial cone-excitation ratios in natural scenes. J Opt Soc Am A. 2002;19:1484–1490. doi: 10.1364/josaa.19.001484. [DOI] [PMC free article] [PubMed] [Google Scholar]
- 31.Foster DH, Nascimento SM, Amano K. Information limits on neural identification of colored surfaces in natural scenes. Visual Neurosci. 2004;21:331–336. doi: 10.1017/s0952523804213335. [DOI] [PMC free article] [PubMed] [Google Scholar]
- 32.Webster MA, Mizokami Y, Webster SM. Seasonal variations in the color statistics of natural images. Network. 2007;18:213–233. doi: 10.1080/09548980701654405. [DOI] [PubMed] [Google Scholar]
- 33.Brainard DH, Wandell BA. Asymmetric color matching: how color appearance depends on the illuminant. J Opt Soc Am A. 1992;9:1433–1448. doi: 10.1364/josaa.9.001433. [DOI] [PubMed] [Google Scholar]
- 34.Chichilnisky EJ, Wandell BA. Photoreceptor sensitivity changes explain color appearance shifts induced by large uniform backgrounds in dichoptic matching. Vision Res. 1995;35:239–254. doi: 10.1016/0042-6989(94)00122-3. [DOI] [PubMed] [Google Scholar]
- 35.Nascimento SM, Foster DH. Detecting natural changes of cone-excitation ratios in simple and complex coloured images. Proc Biol Sci. 1997;264:1395–1402. doi: 10.1098/rspb.1997.0194. [DOI] [PMC free article] [PubMed] [Google Scholar]
- 36.Webster MA, Mollon JD. Colour constancy influenced by contrast adaptation. Nature. 1995;373:694–698. doi: 10.1038/373694a0. [DOI] [PubMed] [Google Scholar]
- 37.Logvinenko AD. An object-color space. J Vision. 2009;9(11):5. doi: 10.1167/9.11.5. [DOI] [PubMed] [Google Scholar]


