Abstract
The Abney effect refers to changes in the hue of lights as they are desaturated. Normally the purity is varied by desaturating with a fixed spectrum. Mizokami et al. (2006, Journal of Vision, 6(9), 996–1007) instead varied purity by using Gaussian spectra and increasing their bandwidth. Under these conditions the hues of lights at short and medium wavelengths tended to remain constant and thus were tied to a fixed property of the stimulus like the spectral peak, possibly reflecting a compensation for the spectral filtering effects of the eye. Here we test this account more completely by comparing constant hue loci across a wide range of wavelengths and between the fovea and periphery. Purity was varied by adding either a fixed spectrum or by varying the spectral bandwidth, using an Agile Light Source capable of generating arbitrary spectra. For both types of spectra, hue loci were approximated by the Gaussian model at short and medium wavelengths, though the model failed to predict the precise form of the hue changes or the differences between the fovea and periphery. Our results suggest that a Gaussian model provides a useful heuristic for predicting constant hue loci and the form of the Abney effect at short and medium wavelengths, and may approximate the inferences underlying the representation of hue in the visual system.
1. Introduction
Many wavelengths change their hue when mixed with white light. For example, narrowband blue lights appear more purple when white is added, while orange lights appear more reddish, both shifting toward the extremes of the visible spectrum. Thus lines of constant hue tend to curve toward the center of the spectrum, and plot as curved loci in the chromaticity diagram (even though the chromaticities of the mixture lie along straight lines). This nonlinear interaction between hue and saturation was described by Abney[1] and Westphal[2] a century ago, and has been extensively studied since[3–8]. Yet the basis for these hue shifts remains uncertain.
Most accounts of the Abney effect have been mechanistic and focused on the implications for color-opponent channels, without considering the possible implications for constancy. For example, measures of equilibrium and hue loci have been important for describing the responses of the opponent mechanisms presumed to underlie the red-green and blue-yellow dimensions of color appearance[9, 10], but have not typically been analyzed to understand whether the responses are tied to functional advantages in color coding. However, Mizokami et al.[11] recently proposed a functional account of the Abney effect. In their study they examined the color appearance of lights with Gaussian spectra, in which purity was varied by changing the bandwidth of the spectra rather than adding a fixed desaturant. As the bandwidth increases, the spectrum is differentially filtered by the eye’s bandpass spectral sensitivity, altering the relative responses in the cones. Despite this, they found that for a range of wavelengths the hue of the spectra tended to remain constant. This led them to suggest that the visual system might be compensating for the spectral filtering in order to tie hue percepts to a constant physical property of the stimulus (the peak wavelength) rather than to a constant neural response (the relative cone excitations). Their results thus suggested that color appearance might be based on something like an inference that the underlying spectrum is Gaussian.
Mizokami et al.[11] showed that this inference could qualitatively predict the pattern of hue shifts observed in conventional measures of the Abney effect. Again, in this case the wavelength is desaturated by adding a fixed (e.g. flat) spectrum. The effective spectrum of this white will again be filtered according to the spectral sensitivity of the eye, but because the stimulus spectrum is fixed, this filtering is constant for different mixtures of the narrow and broad components, and thus the profile of cone excitations remains constant for different mixtures of the components (i.e. the relative cone excitations are scaled by the same factor as purity increases). The Abney effect reflects the fact that the linearly scaled cone excitations do not appear constant in hue. Mizokami et al. found that the form of these departures was roughly predicted if the visual system assumed that the spectra were instead Gaussian, and thus interpreted the cone excitations consistent with this assumption. Thus, according to their model, the conventional Abney effect results because the visual system is “fooled” about the underlying source of the stimulus spectrum, and thus is making the right response to the wrong stimulus. Constant hue loci based on this model were qualitatively consistent with the pattern of hue shifts reported for the Abney effect.
A central assumption of this account of the Abney effect is that the visual system can somehow compensate for its own filtering characteristics, so that changes in cone signals with variations in purity can be interpreted accordingly. In this study we sought to further test this account and to ask how well this compensation is actually matched to the spectral sensitivity of the eye. To examine this, we conducted two sets of experiments in which we measured constant hue loci either when stimuli were desaturated by broadening the spectrum or by adding a fixed white. This allowed us to test how well the model could predict the hue loci across the spectrum, and whether these loci could in turn predict the specific pattern of Abney effects. We also measured the hue shifts both in the fovea and in the nearby periphery. Spectral sensitivity at these two retinal locations differs in part because of differences in screening by macular pigment[12]. Comparisons of the hue loci at the two locations therefore allowed us to assess to what extent color appearance might be corrected for the specific spectral sensitivity of the observer.
2. Methods
Participants
Five observers, including three of the authors, participated in different parts of the study. All had normal or corrected to normal vision, and normal color vision as assessed by the Cambridge Colour Test. Participation was with informed consent and all procedures followed protocols approved by the university’s institutional review board.
Apparatus and Stimuli
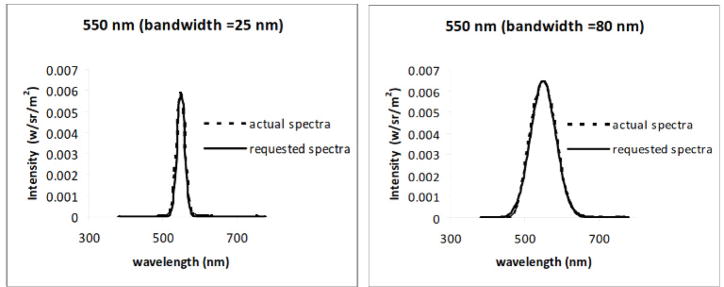
Spectral stimuli were generated with an OL 490 Agile Light Source (Gooch & Housego), a commercially available device that uses programmable DLP micromirrors to filter the light spectrum from a 500W Xenon lamp source to allow for the presentation of arbitrarily complex spectra[13]. The device is similar in principle to the spectral filtering techniques developed by Bonnardel et al.[14], who used an LCD display to generate comb-filtered spectra, but takes advantage of the higher contrast resolution provided by DLP displays[15]. Light is output from the display via a fiber optic cable which was fed into an integrating sphere, with the stimulus provided by the 2° aperture of the sphere. Spectra were calibrated with a PR650 Spectroradiometer (Photo Research. Results reported are based on the actual measured spectra. Figure 1 shows examples of the requested spectra and the measured output, and shows that the device could reproduce the desired stimuli with high fidelity.
Figure 1.
Comparison of requested and generated Gaussian spectra with the OL490 light source.
Constant hue loci were measured for two types of stimuli, which differed in how the purity was varied:
Gaussian spectra
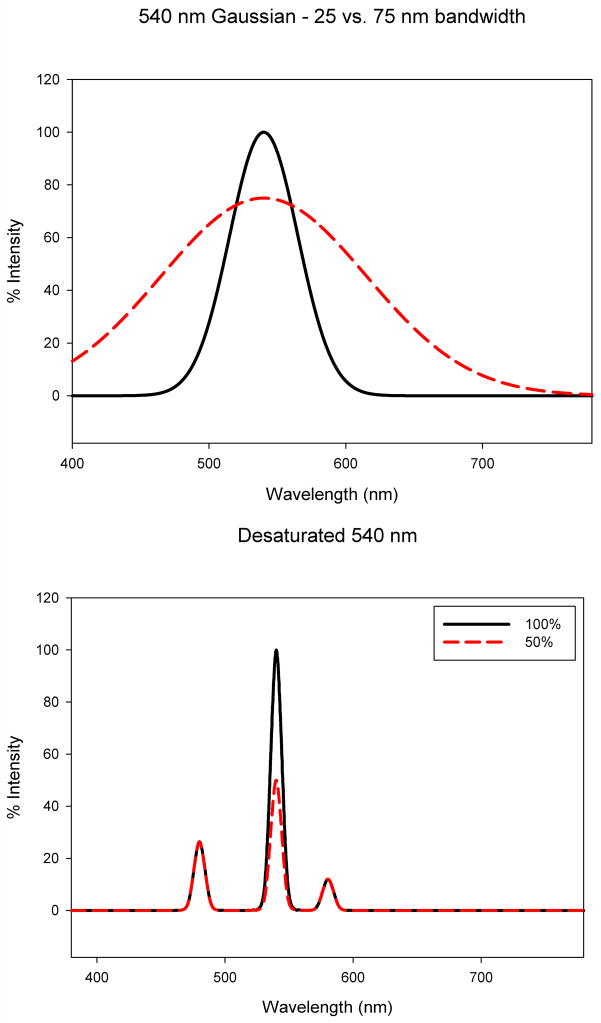
In the first case the display was used to create spectra defined by Gaussian functions of wavelength (Figure 2a). The peak wavelengths ranged from 450 to 650 nm and bandwidths (full-width at half-height) from 25 nm to 100 nm). Luminance levels were equated by lowering the peak output of the desaturated stimuli so that the luminances were approximately equal to the most saturated stimulus of the same wavelength
Figure 2.
(Color online) Schematic examples of the two types of stimuli tested. Left: spectra which varied as a Gaussian but differed in bandwidth. Right: Spectra composed of two components – a single peak wavelength of variable height mixed with a fixed pair of complementary wavelengths providing a desaturating white.
Abney spectra
In the second case measuring the conventional Abney effect, reference stimuli were narrowband Gaussians (with a bandwidth of 10 nm), which had peak wavelengths ranging from 420 to 560 nm. The desaturated comparison stimulus was formed by the mixture of 3 peaks. Two of these formed the “white” stimulus and consisted of complementary wavelengths of 480 and 580.4 nm which were adjusted in relative intensity to find the mixture that appeared closest to perceptual white. These components remained fixed throughout the conditions. The pair was combined with a third narrowband component with variable peak (Figure 2b). The intensity of this variable component was adjusted to create four different levels of desaturation, which were given values describing the percentage of maximum output of the variable component. This meant that the luminance of the stimuli also decreased as they were desaturated, though in control settings we found that this had little effect on the perceived hues (and was chosen over the alternative of varying the level of the white component to maintain constant total luminance, since any rendering errors could introduce a shift in the white chromaticity). During the experiment, the wavelength of the variable component for each desaturated stimulus was adjusted to match the perceived hue of the narrowband reference.
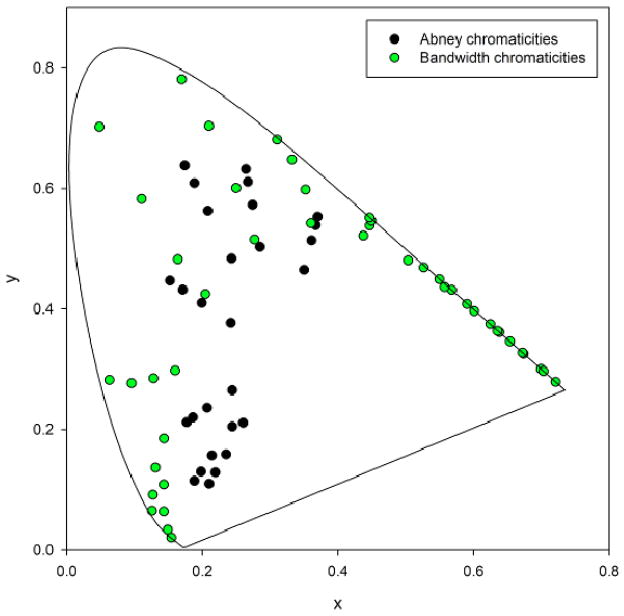
Figure 3 shows examples of the chromaticities of both the Gaussian and Abney spectra. Because of the different ways they were generated, the two sets of stimuli varied in the range of purities they sampled, with the Gaussian spectra confined to higher saturations and the Abney spectra more desaturated. This had the disadvantage that we could not directly compare performance with the two different stimulus sets (e.g. by measuring metamer sets for individual observers for stimuli with either wavelength profile). On the other hand, for each set we could directly compare the measured hues to the predictions of the Gaussian model, and thus the two experiments allowed us to evaluate these predictions over a wide range of color space.
Figure 3.
(Color online) Representative CIE 1931 chromaticities of the Gaussian (green) and Abney (black) spectra.
Procedure
Constant hue loci for Gaussian spectra
Subjects judged the relative hue of two spectra presented in temporal sequence. On each trial they were shown a fixed reference Gaussian with a 75 nm bandwidth, followed by a variable test stimulus with a bandwidth of 25, 50, or 100 nm. Both lights were shown for 1 sec with a gap between them of 0.5 sec. A handheld keypad was used to make a forced-choice response to indicate how the test hue differed from the reference. For example, for a bluish reference, they would respond “too reddish” or “too greenish” while for a greenish reference the choices were “too bluish or “too yellowish.” The peak of the test wavelength was varied in two randomly interleaved staircases (1 up: 1 down) until the probability of either response was the same. Wavelengths were initially adjusted using a coarse 10 nm step size, which was decreased to 4 nm after 2 reversals and 1 nm after 6 reversals. Each staircase continued until 12 reversals were made, with the mean setting was based on the average of the final 6. Settings were made either in the fovea by directly fixating the field or at 8° in the periphery by fixating a dim fixation spot. The different stimulus and viewing conditions were tested in counterbalanced order.
Constant hue loci for Abney spectra
Hue matches were again made between the narrowband and desaturated spectra by varying the spectral peak of the test with a staircase. In pilot runs we varied the narrowband stimulus to match the desaturated reference. However, this prevented us from testing shorter wavelengths where the effects of eccentricity were predicted to be largest (since the desaturated stimuli at these wavelengths shifted strongly toward the short-wave end of the spectrum). We therefore changed the procedure so that the narrowband stimulus remained fixed, and observers adjusted the variable-peak component of the desaturated stimulus. For these runs we also added an adapting white background to ensure that any differences between the fovea and periphery were not due to differences in adaptation. The background consisted of the white from the complementary wavelength pair and was shown for 60 sec prior to each run and between each stimulus presentation. Measurements were made for 4 levels of desaturation achieved by setting the intensity of the variablepeak component to 25, 50, 75, or 100% of its maximum available intensity. The different combinations of reference wavelength, purity, and eccentricity were again tested in counterbalanced order.
Flicker Photometry
The OL490 is capable of switching spectra at high rates (up to 12,500 Hz). We used the same device to estimate the macular pigment density of each observer by using flicker photometry[16] at a more modest frequency of 17 Hz. The field alternated between 460 and 570 nm, the former corresponding to the peak absorbance of macular pigment. The intensity of the 570 nm light was fixed and observers adjusted the intensity of the 460 nm light. On each trial, observers were presented with a continuously flickering field and minimized the apparent flicker. Six settings were taken in both fovea and 8° periphery, with half of the trials started at a high intensity and half at a low intensity. The macular pigment density was then estimated from the settings by calculating the absorbance spectra of macular pigment required for the observed difference. Estimated densities for the four observers tested (MW, MC, EK, and SO) were 0.72, 0.39, 0.31, and 0.27, respectively.
Results
Before considering the actual measurements, it is worth illustrating that at shorter wavelengths the hue shifts resulting from the Abney effect can be pronounced. Observers reported that the hue changes in the “bluish” wavelengths were large in our display, and clear though weaker effects are evident even with the broader band spectra characteristic of monitors. For example, in Figure 3 the central circle corresponds to the pure blue gun of the monitor, while the color of the four corner circles is a mixture of equal luminances of the blue gun and the gray background. The desaturated corner colors appear more purple, or shifted toward a shorter peak wavelength. In our experiments we were again interested in testing whether this hue shift depends on how the stimuli are desaturated, and whether it varies within the same observer at different eccentricities. A hue shift with eccentricity may also be possible to see in the figure, though it depends strongly on characteristics of the reproduction medium (and for our monitors was much more conspicuous for CRT than for LCD displays). The effect is strongest when the central dot subtends roughly 1°. At this distance many observers report that the central dot looks darker when directly fixated and brighter when fixation is instead on one of the corner colors, without a strong change in hue. In contrast, each corner color looks more purple when directly fixated. Consequently, this suggests that the size of the Abney effect (i.e. the hue shift between the saturated center stimulus and desaturated corner stimulus) is stronger in the fovea than in the periphery, an observation which our measurements confirm.
Gaussian spectra
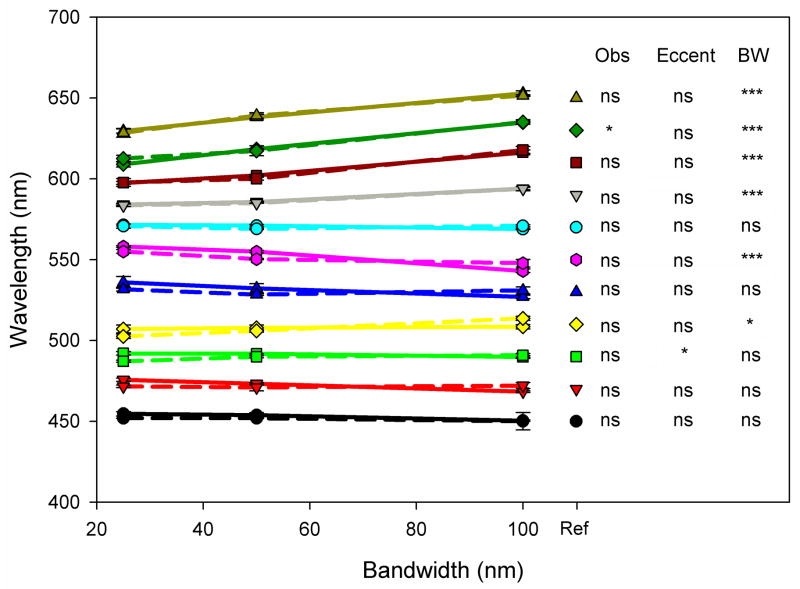
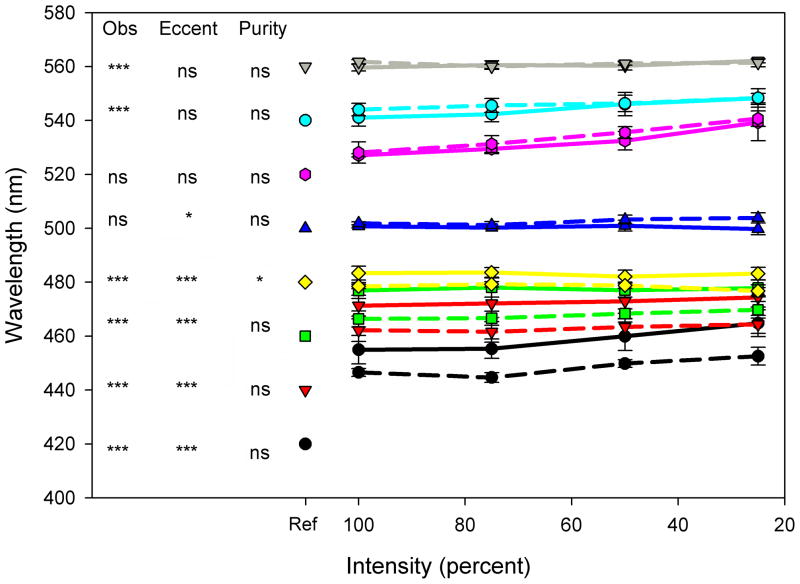
For measurements of the constant hue loci we consider first the results for Gaussian spectra. Figure 5 plots the hue matches between spectra with varying bandwidth. Points show the mean and standard error of the peak wavelengths chosen to match the hues of Gaussian spectra that differ in bandwidth. The means are based on the average settings across the 4 observers. Individual lines plot the matches for different reference spectra with peak wavelengths ranging from 450 to 650 nm, for stimuli presented in the fovea (solid lines) or periphery (dashed).
Figure 5.
(Color online) Average observer settings for Gaussian stimuli with bandwidths of 25, 50, and 100 nm. Symbols plot the peak wavelengths (connected symbols) at three bandwidths that were chosen to match the hue of the reference bandwidth of 75 nm (unconnected symbols at right). Solid lines represent foveal settings and dashed lines represent peripheral settings. Error bars represent the standard error of the mean, and where not shown are smaller than the symbols. Tukey significance columns are for the effects of observer, eccentricity, and bandwidth at each wavelength; *: p < 0.05; **: p < 0.01; ***; p < 0.001; ns = not significant. The interaction was not significant at any wavelength.
If the matches were determined entirely by the spectral peaks – so that spectra with different bandwidths had the same perceived hue when their physical peaks were the same – then all of the curves in Figure 5 should be flat and aligned with the reference peak. That is, there should be no effect on the matches of the stimulus bandwidth or eccentricity, and no differences between the observers. To assess this, at each wavelength we used ANOVA to test for the effects of observer, bandwidth, or eccentricity. The results of these comparisons are shown on the right side of the figure. Settings were largely invariant across the 4 observers and at the two eccentricities, with only 1 of the 11 test wavelengths revealing a significant effect for either factor. In contrast, the settings showed a significant change with bandwidth for roughly half the wavelengths tested. In general, the matches at shorter wavelengths remained constant with bandwidth, while large shifts of up to 20 nm occurred when matching the longer wavelengths. This pattern replicates the basic findings of Mizokami et al.[11], who tested wavelengths between unique blue and yellow. The present display allowed us to extend the measurements to both longer and shorter wavelengths, and show that for orange and reddish stimuli in particular, the wavelength required to maintain a constant hue instead varies with bandwidth.
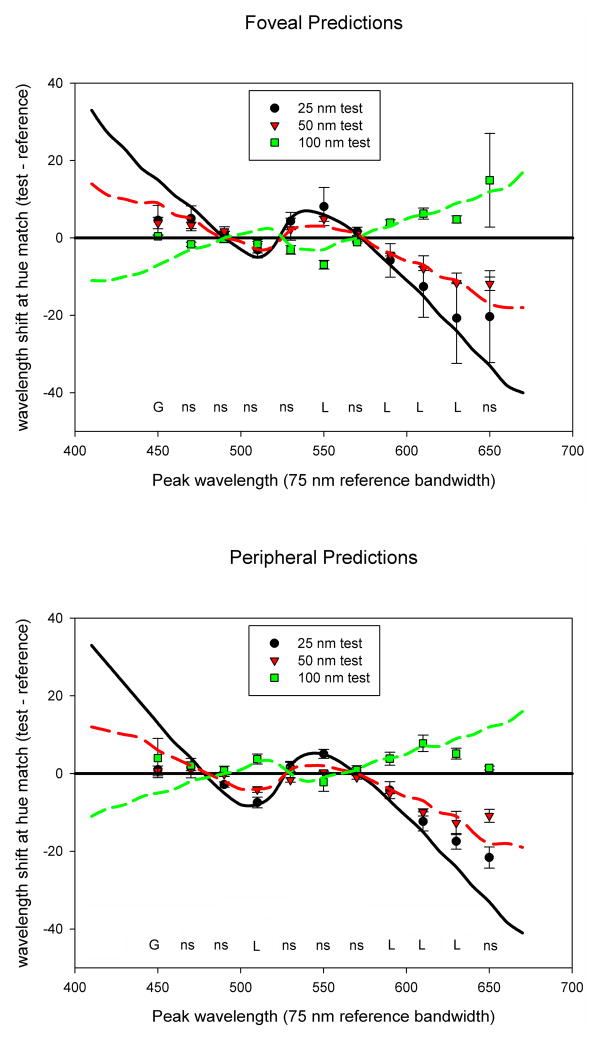
Figure 6 replots the settings to show the difference in chosen peak wavelength between the reference bandwidth (75 nm) and each test bandwidth (25, 50, or 100 nm), this time as a function of peak wavelength. The two panels plot the results for the foveal and peripheral matches. We compared these settings to the matches predicted by either the Gaussian model or the linear cone ratios. Again the Gaussian model predicts no difference under any of the conditions and thus corresponds to the line at 0 in the figure. The linear prediction instead corresponds to the different peak wavelengths required to equate the relative cone ratios, and is shown by the three curves representing the matches predicted at different bandwidths. At each wavelength, we used t tests to compare the relative fit of each model to the observed settings, by comparing the absolute error in the predictions across the three bandwidths. The results of these tests are indicated along the bottom of the figure. At the shortest wavelength tested in both the fovea and periphery, the matches are closer to a constant physical match. Alternatively, at the longer wavelengths the hue matches instead deviate from constant peaks and are instead better fit by constant cone ratios. Finally, at intermediate wavelengths the predictions for the two models are similar in predicting little change with bandwidth. Thus in this spectral region the observed matches are roughly consistent with either model. The settings are thus intermediate to the Gaussian and linear predictions, and in particular, the Gaussian model provides a reasonable approximation to the hue matches only at short and medium wavelengths. (Indeed, Figure 6 could be taken to imply that the linear prediction provides a better overall approximation of perceived hue, since the Gaussian model was superior only at 450 nm. However, this is a consequence of the specific bandwidths and wavelengths we tested, which were chosen in part to evaluate failures of the Gaussian model at longer wavelengths. As we show next, the deviations from linearity are pronounced for shorter and more desaturated spectra. Again these deviations correspond to the hue shifts described by the Abney effect, and we show in the following section that they are more clearly in line with the Gaussian predictions.)
Figure 6.
(Color online) Shifts in observer settings at each matching bandwidth as a function of the reference peak wavelength. Positive numbers on the Y-axis indicate a shift toward longer wavelengths when the narrower-band light is shown. Lines indicate the predicted pattern if matches are made by maintaining a constant spectral peak (horizontal line, constant prediction for all conditions) or by maintaining constant cone ratios (linear predictions, shown for each stimulus bandwidth). Labels below each set of matches indicate whether the observed matches were better fit by the Gaussian prediction (G) or the linear cone ratios (L); ns = errors of prediction in the two models did not significantly differ.
Abney spectra
We next measured hue matches when the wavelengths were desaturated with the fixed white. Figure 7 again plots the average settings for the observers at each wavelength, this time as a function of decreasing purity of the matching stimulus. As expected from previous measurements of the Abney effect, in this case there are dramatic shifts in matching wavelengths at the shorter end of the spectrum, with differences of up to 50 nm in the peak wavelength of the narrowband and desaturated match. Moreover, there are also now pronounced differences in the settings between the fovea and periphery, as well as large individual differences in the matches. Wavelengths at which the effects of observer, eccentricity or purity were significant are again indicated to the right of the plotted matches. (Note that the purity effects were assessed as the difference between the desaturated match wavelength vs. the reference wavelength. In further analyses we also assessed whether the settings varied with the purity of the match stimulus. A significant effect was found only for 1 of the 8 wavelengths tested, at 540 nm.)
Figure 7.
(Color online) Average observers’ settings for hue matches with the Abney spectra. Unconnected symbols represent the dominant wavelength of the narrowband reference light; corresponding lines show settings for 4 purity levels of the desaturated matching light, corresponding to the relative intensity of the chromatic component of the 3-primary spectrum (with 100% corresponding to the highest saturation). Foveal settings are represented by solid lines and peripheral settings by dashed lines. Error bars represent the standard error of the mean. Significance columns are for the effects of observer, eccentricity, and relative purity at each wavelength, with *: p < 0.05; **: p < 0.01; ***; p < 0.001; ns = not significant.
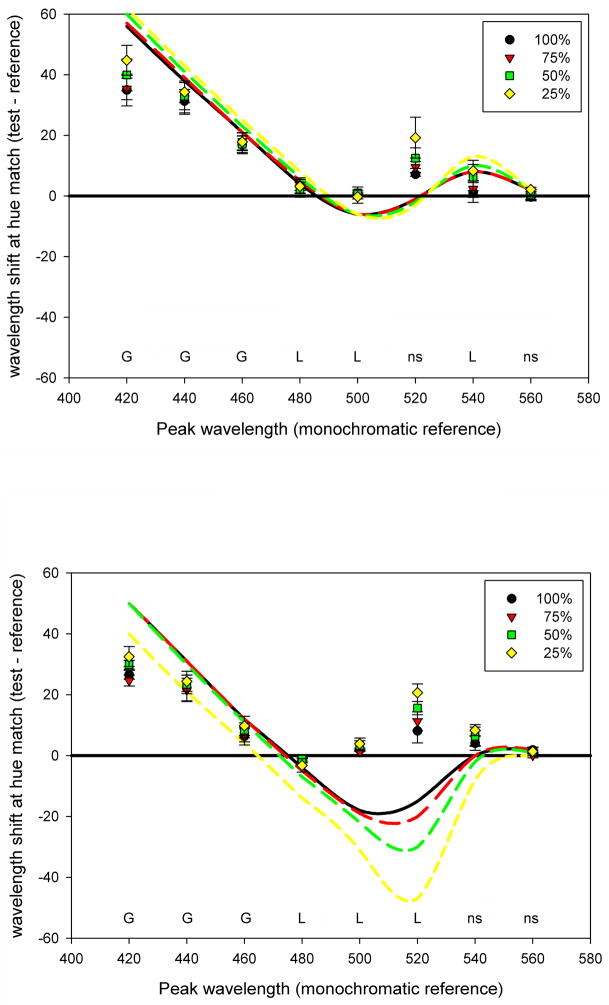
Figure 8 compares the matches to the predictions for the Gaussian and linear models in the fovea or periphery. In the case of the Abney stimuli, the linear cone ratios remain constant as the purity varies, and thus the predicted settings plot as the single line at 0. Conversely, the predictions that the matches instead depend on matching the peaks of the equivalent Gaussian spectra now vary with wavelength and purity. Again, these predictions are based on the assumption that the visual system infers that the Abney stimulus is in fact Gaussian, and that color appearance is adjusted to compensate for the changes in cone ratios as the Gaussian spectra are broadened. The large shifts in the matches at shorter wavelengths are reasonably well predicted by the compensation model. This re-emphasizes that even if this model does not completely describe the hue loci, it can nevertheless roughly approximate the pronounced nonlinearities in color appearance in the purple and blue region of the spectrum. In turn, the results also show that the model does in fact account reasonably well for the pattern of conventional Abney effects at shorter wavelengths. That is, the actual degree of curvature is largely what would be required in order to adjust the cone ratios so that perceived hue is tied to the peak of the Gaussian spectra.
Figure 8.
(Color online) Shifts in the matching wavelength chosen at each saturation level in the Abney stimuli as a function of the reference peak wavelength. Positive numbers on the Y-axis indicate a shift toward longer wavelengths when the narrower band light is shown. Lines indicate the predicted pattern if matches preserve constant cone ratios (horizontal line, constant prediction for all conditions) or preserve constant spectral peaks of Gaussian spectra with the same chromaticity (Gaussian predictions, shown for each stimulus bandwidth). Labels below each set of matches indicate whether the observed matches were better fit by the Gaussian prediction (G) or the linear cone ratios (L); ns = errors of prediction in two models did not significantly differ.
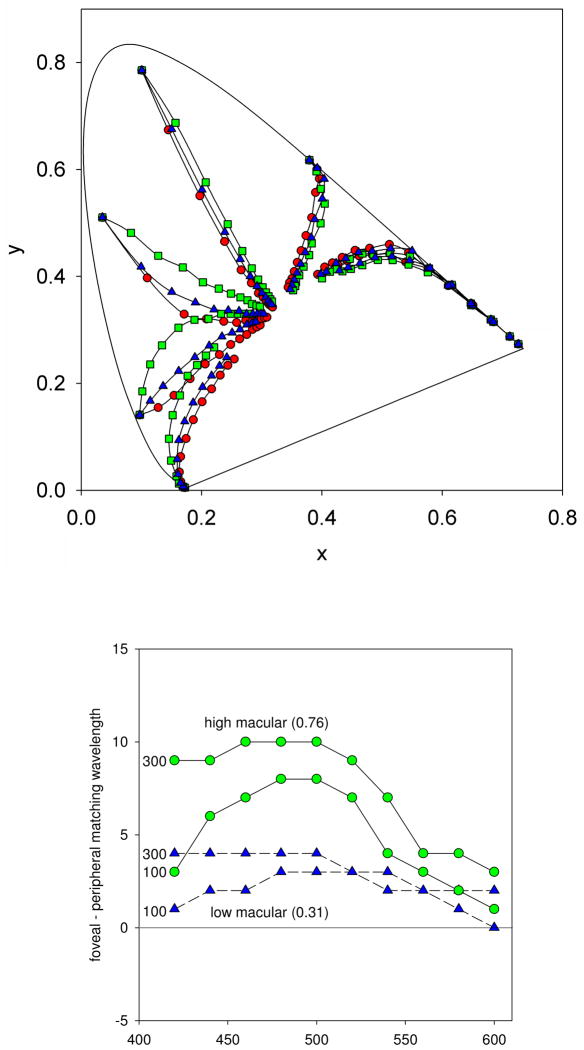
The predictions in Figures 6 and 8 were based on the spectral sensitivity of the standard observer and thus would differ for individuals with different spectral filtering. Specifically, if color appearance were calibrated to maintain hue constancy for Gaussian-like spectra, then different corrections would need to be applied for different observers, or for the same observer at different retinal locations, in order to correct for both inter- and intra-individual differences in spectral sensitivity. For example, Figure 9 illustrates this point by showing the predicted constant hue loci when the spectral sensitivity of the standard observer was adjusted to reflect no screening by macular pigment, or a peak macular pigment density of 0.31 or 0.76 (corresponding to the approximate measured range for our observers). Because the macular pigment selectively absorbs shorter wavelengths, it narrows the bandpass tuning of the visual system, and thus produces a larger bias in the cone ratios as the stimulus spectrum is broadened. Consequently, the size of the predicted compensation should be larger for observers with a higher pigment density. Similarly, for many wavelengths there should be stronger Abney effects – or more curved hue loci – in the fovea than in the periphery. Finally, an observer with more dense macular pigment should show a larger difference between the Abney effects in the fovea and periphery. This is illustrated in the second panel of Figure 9, which plots the expected differences between the Abney effects in the fovea and periphery, expressed as the difference in dominant wavelength of the equivalent Gaussian spectra. Differences of up to 10 nm are predicted for the high density observer, while the differences are about 4 nm for the low density observer.
Figure 9.
(Color online) a) Predicted Abney effects for observers with different densities of macular pigment (assuming each observer chooses the cone ratios such that constant hues correspond to constant peaks in Gaussian spectra). The three curves show the predictions assuming no macular pigment (e.g. the periphery, red circles) or a peak density of 0.31 (low MP, blue triangles) or 0.76 (high MP, green squares). b) The differences in peak wavelength chosen between the fovea and periphery predicted by the difference in macular pigment, as a function of the reference wavelength. Predictions are shown for two levels of macular pigment density (high or low), and for two different saturation levels of the stimuli corresponding to equivalent Gaussian spectra with a bandwidth of 100 or 300.
As Figure 7 showed, different Abney effects were in fact found for the different observers and between the fovea and periphery. This result is therefore at least consistent with the possibility that individuals are compensating color appearance for some features of their own idiosyncratic spectral filtering. To evaluate this, Figure 10 compares the actual settings between the fovea and periphery for the observers, by plotting the difference in the wavelengths chosen in the hue matches at the two locations. The differences at short wavelengths are again in the direction predicted by the compensation hypothesis, with weaker Abney shifts in the periphery (which as noted, may be seen in the hues in Figure 3 during direct or eccentric fixation). Moreover, the effects of eccentricity were again strongest in the observer with the highest macular pigment density (MW). However, the foveal vs. peripheral differences were substantially larger than the difference predicted by compensation for macular pigment (Figure 9b). For example, the peak wavelengths of the hue matches at the two loci differed by up to 20 nm, or more than twice the expected difference of 10 nm for the highest measured density difference. Moreover, one observer showed a consistent change in the direction of this difference at 520 nm, an effect which would not be expected from the change in macular pigment screening (which for all wavelengths predicts the same or stronger Abney effects in the fovea; Figure 9). While these differences could again reflect a failure of the Gaussian prediction, they could also arise because the spectral sensitivity at the two loci differ because of a number of additional factors, including differences in the relative numbers of cones and the density of rods. To ensure that rod intrusion was not influencing the settings, two observers (SO and MW) repeated the hue matches after a bleach from an adapting light seen in Maxwellian view. In this case, the settings were tracked with a method of adjustment over a period of 15 minutes. However, the matches for both observers remained stable throughout this time, suggesting that rods played little role. Whatever its basis, these results suggest that there is poor hue constancy for the Abney spectra.
Figure 10.

(Color online) Observed differences in the magnitude of foveal and peripheral hue shifts for the Abney spectra. Positive differences correspond to larger changes in peak wavelength in the fovea. Each panel plots the results for a single observer, with the different lines corresponding to the different purities of the matching stimulus (as indicated by the % intensity of the variable matching component).
Discussion
This study was conducted with three aims. The first was to extend our previous measurements of the color appearance of Gaussian spectra in order to more systematically evaluate whether the perceived hue of the spectra are consistent with a functional compensation for the filtering effects of the eye’s spectral sensitivity, so that hues are more consistently tied to physical properties of the world (e.g. the inferred spectral peak of the stimulus) rather than fixed physiological properties of the observer (e.g. fixed relative signals in the cones). The hue matches predicted by this assumption provided a good approximation to the actual hue loci measured at short and medium wavelengths, and thus replicated the results of Mizokami et al.[11] in pointing to an approximate compensation for spectral screening effects of the eye. The results from the two different stimulus sets suggest that for both, the perceived hue loci of lights from the short end of the spectrum to yellow could be reasonably well predicted simply from the peak wavelength of the Gaussian spectrum with the corresponding chromaticity. In turn, this raises the possibility that the visual system might adopt an inference of this kind in the representation of hue. The results are thus consistent with the possibility that the well-established nonlinearities in color appearance may not be an epiphenomenon of neural processing, but instead are designed to calibrate color appearance for the sensitivity limits imposed by this processing. Such adjustments are a common feature of many aspects of visual processing in general and color vision in particular. For example, the stimulus that appears white shows effectively complete compensation for changes in spectral screening as the observer ages[17] and for changes in spectral sensitivity across the visual field[18, 19]. Similarly, hue percepts are highly stable with age[20] or in the nearby periphery[21] despite large temporal and spatial variations in the observer’s sensitivity to wavelength.
In contrast, at longer wavelengths the simple model of compensation we explored breaks down for the perceived hue of the lights in the yellow to red range. Instead, the settings tended to be biased in a manner predicted by the cone ratios. Thus, these hues do not remain tied to a fixed peak wavelength. Mizokami et al.[11] pointed to this limit previously by noting that the Abney effects predicted by the model were too strong at these wavelengths. Here we have confirmed this empirically by measuring the hue matches at longer wavelength regions of the spectrum than we could previously test. A simple reason for this breakdown is that in this region the S cones are effectively insensitive to the lights. As a result increasing the bandwidth moves the chromaticity along the spectrum locus rather than inward toward white. That is, changes in the bandwidth do not in fact desaturate the stimulus. However, this highlights the point that Gaussian spectra fail to even adequately generate lights of reduced purity at these longer wavelengths, so that the visual system would need to rely on a different rule for assigning hues. It is also telling that in this region the Abney effect itself is perceptually much less salient. The effect is usually described as a bending of the hue loci away from either end of the spectrum. Yet while our results are consistent with a hue shift in this direction, the hue shifts produced by adding white to a longer wavelength are perceptually very weak compared to the pronounced reddening of short wavelengths as they become desaturated (as was illustrated in Figure 3).
Finally, in middle regions of the spectrum the differences between a Gaussian prediction and linear cone ratios are small, so that there is not a clear basis for distinguishing between them. However, it is notable that some of the fine structure of the hue matches did tend to follow the linear prediction in this region (Figures 5 and 9). This might suggest that – if the visual system does indeed adopt a Gaussian inference – it may be manifest only at shorter wavelengths which results in a critical level of S-cone excitation. Similarly, the results for both medium and longer wavelengths may point to a special role of S cone signals in the compensation of the observer’s spectral sensitivity.
A second aim of our work was to directly relate the hue changes resulting from Gaussian spectra versus the more conventional fixed-component mixtures that have traditionally been used to measure the Abney effect. Our results show that the hue loci predicted by the peaks of the Gaussian spectra provide a reasonable approximation to the hue changes in Abney spectra at the shorter wavelengths, again providing empirical support for the correspondence we noted previously between the two measures. Of course, this general correspondence is not surprising because the visual system obviously does not know the underlying spectrum. However, the similar patterns under the two conditions reinforce both the predictions and limitations of the model and the extent to which it could provide a viable account of color appearance. Long and Purves[22] also generated predictions of the Abney effect under the assumption that color coding was adjusted for the probability distribution of color signals in the visual environment. However, their predicted loci do not clearly show the correct direction of curvature for some regions of the spectrum. This could reflect a discrepancy in the model or in the specific distribution, just as our results could fail because the visual system might not specifically adopt a Gaussian model. In any case, quantitative comparisons with the actual form of the hue loci will be important for testing the predictive validity of different models.
At a finer level, a third aim was to assess the extent to which the visual system could correct for the specific spectral sensitivity of the cone receptors. At this level the correspondence between the hue loci for Abney and Gaussian spectra is weaker. Observers vary widely in their sensitivity to wavelength because of differences in the density of preretinal screening pigments and in the number and sensitivity of the different classes of cones[23–25]. To perceive constant hue loci consistently for Gaussian spectra, two observers with different spectral sensitivities would need to apply different corrections to their cone signals, because their eyes would filter the same stimulus in different ways. They should therefore show different patterns of Abney effects when tested with additive mixtures, in which the differential filtering effects associated with saturation changes are now removed. That is, observers who agree on hue loci for Gaussian spectra should disagree when presented with Abney spectra. (A similar argument has been suggested for unique hues for broad versus narrow spectra[26], though we found previously that these differences do not occur for Gaussian spectra since the hues remain roughly independent of the bandwidth[11].)
To examine this, we focused on differences in spectral sensitivity within the observer, by comparing hue matches in the fovea and at an eccentricity of 8°. Again, these conditions were chosen to test whether differences in the settings were consistent with compensation for differences in the screening effects of macular pigment. Our results provide partial support for this hypothesis, in that the Abney effects were weaker in the periphery than in the fovea, and this difference was larger for the observer with a higher macular pigment density. Both effects are consistent with the direction of the effects predicted by compensation for the differences in spectral sensitivity at the two loci. However, for both the Gaussian and Abney spectra the changes with eccentricity could not be quantitatively fit by the differences in macular pigment alone. It thus remains uncertain to what extent the hue loci are matched to the specific wavelength filtering of the individual’s eye. A potential test of this possibility would be to choose Gaussian or Abney spectra that are metameric for the standard observer, and then ask whether there are greater individual differences in the hues matched to these stimuli (e.g. with a narrowband test) for the Abney spectra. We are currently exploring this test.
Clearly, the evidence for a Gaussian inference in color appearance is largely circumstantial because it partially accounts for the hue matches without a strong a priori argument for why the visual system would adopt this assumption. In this regard analyses of natural color signals and how they vary with lighting and material changes would provide insights into the physical viability of this hypothesis, or might point to a functional form for spectra which might better account for measures of color appearance. Gaussian models for illuminant and reflectance spectra have been considered only rarely[27], yet we have recently found that they can describe natural color signals nearly as well as the linear models that are routinely used to estimate spectra when restricted to the same number of parameters[28]. This result suggests that Gaussian spectra can provide a useful approximation to natural color signals. Here we have shown that an inference of Gaussian spectra also provides an approximation to how observers perceive the hue of these signals.
Figure 4.
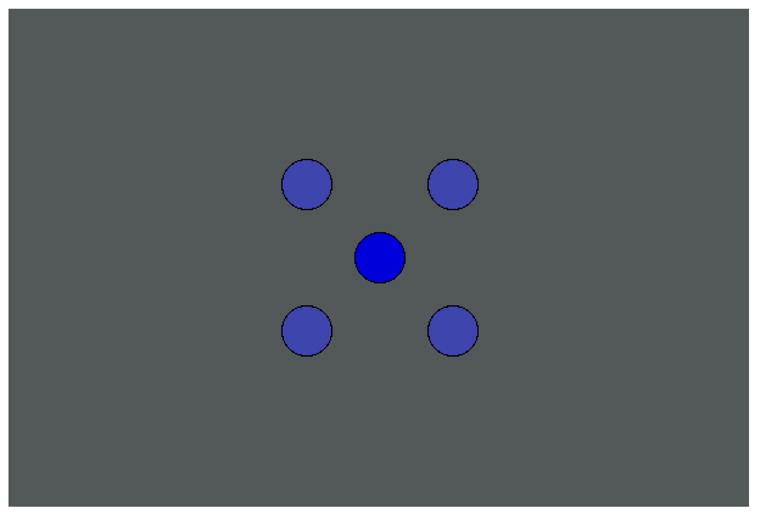
(Color online) An illustration of the Abney effect. The center spot shows the undiluted blue from the monitor, while the corner spots are a mixture of equal luminances of the blue and the gray background. Note that the corner spots appear more purple and that the spots may appear to change in hue when directly fixated. The effect is best seen from a distance where each spot subtends ~1°.
Acknowledgments
Supported by EY-10834 (MW) and AG04058 (JSW).
References
- 1.Abney W. On the changes in hue of spectrum colors by dilution with white light. Proceedings of the Royal Society of London. 1910;82:120–127. [Google Scholar]
- 2.Westphal H. Unmittlebare Bestimmung der Urfarben. Zeitschrift fur Sinnephysiologie. 1909;44:479–486. [Google Scholar]
- 3.Ayama M, Nakatsue T, Kaiser PK. Constant hue loci of unique and binary balanced hues at 10, 100, and 1000 Td. Color Research and Application. 1987;14:1136–1144. doi: 10.1364/josaa.4.001136. [DOI] [PubMed] [Google Scholar]
- 4.Burns SA, Elsner AE, Pokorny J, Smith VC. The Abney effect: chromaticity coordinates of unique and other constant hues. Vision Res. 1984;24(5):479–489. doi: 10.1016/0042-6989(84)90045-2. [DOI] [PubMed] [Google Scholar]
- 5.Ikeda M, Uehira I. Unique hue loci and implications. Color Research and Application. 1989;6:318–324. [Google Scholar]
- 6.Kulp TD, Fuld K. The prediction of hue and saturation for non-spectral lights. Vision Res. 1995;35(21):2967–2983. doi: 10.1016/0042-6989(95)00049-6. [DOI] [PubMed] [Google Scholar]
- 7.Kurtenbach W, Sternheim CE, Spillmann L. Change in hue of spectral colors by dilution with white light (Abney effect) Journal of the Optical Society of America. 1984;4:365–372. doi: 10.1364/josaa.1.000365. [DOI] [PubMed] [Google Scholar]
- 8.Pridmore RD. Effect of purity on hue (Abney effect) in various conditions. Color Research and Application. 2007;32:25–39. [Google Scholar]
- 9.Larimer J. Opponent-process additivity--I: red-green equilibria. Vision Res. 1974;14(11):1127–1140. doi: 10.1016/0042-6989(74)90209-0. [DOI] [PubMed] [Google Scholar]
- 10.Larimer J, Krantz DH, Cicerone CM. Opponent process additivity. II. Yellow/blue equilibria and nonlinear models. Vision Res. 1975;15(6):723–731. doi: 10.1016/0042-6989(75)90291-6. [DOI] [PubMed] [Google Scholar]
- 11.Mizokami Y, Werner JS, Crognale MA, Webster MA. Nonlinearities in color coding: compensating color appearance for the eye’s spectral sensitivity. J Vis. 2006;6(9):996–1007. doi: 10.1167/6.9.12. [DOI] [PMC free article] [PubMed] [Google Scholar]
- 12.Snodderly DM, Auran JD, Delori FC. The macular pigment. II. Spatial distribution in primate retinas. Invest Ophthalmol Vis Sci. 1984;25(6):674–685. [PubMed] [Google Scholar]
- 13.Crognale MA, Webster MA, Fong A. Application of digital micromirror devices to vision science: shaping the spectrum of stimuli. SPIE Photonics West MOEMs-MEMs Emerging DMDBased Systems and Applications. 2009;7210(4):1–7. [Google Scholar]
- 14.Bonnardel V, Bellemare H, Mollon JD. Measurements of human sensitivity to combfiltered spectra. Vision Res. 1996;36(17):2713–2720. doi: 10.1016/0042-6989(96)00014-4. [DOI] [PubMed] [Google Scholar]
- 15.Mollon JD. Specifying, generating and measuring colours. In: Robson J, Carpenter R, editors. A Practical Guide to Visual Research. Oxford University Press; Oxford: 1998. [Google Scholar]
- 16.Wooten BR, Hammond BR, Jr, Land RI, Snodderly DM. A practical method for measuring macular pigment optical density. Invest Ophthalmol Vis Sci. 1999;40(11):2481–2489. [PubMed] [Google Scholar]
- 17.Werner JS, Schefrin BE. Loci of achromatic points throughout the life span. Journal of the Optical Society of America A. 1993;10(7):1509–1516. doi: 10.1364/josaa.10.001509. [DOI] [PubMed] [Google Scholar]
- 18.Beer D, Wortman J, Horwitz G, MacLeod D. Compensation of white for macular filtering [Abstract] Journal of Vision. 2005;5(8):282a. [Google Scholar]
- 19.Webster MA, Leonard D. Adaptation and perceptual norms in color vision. Journal of the Optical Society of America A. 2008;25(11):2817–2825. doi: 10.1364/josaa.25.002817. [DOI] [PMC free article] [PubMed] [Google Scholar]
- 20.Schefrin BE, Werner JS. Loci of spectral unique hues throughout the life span. J Opt Soc Am A. 1990;7(2):305–311. doi: 10.1364/josaa.7.000305. [DOI] [PubMed] [Google Scholar]
- 21.Webster MA, Halen K, Meyers AJ, Winkler P, Werner JS. Colour appearance and compensation in the near periphery. Proceedings of the Royal Society B-Biological Sciences. 2010;277(1689):1817–1825. doi: 10.1098/rspb.2009.1832. [DOI] [PMC free article] [PubMed] [Google Scholar]
- 22.Long F, Yang Z, Purves D. Spectral statistics in natural scenes predict hue, saturation, and brightness. Proc Natl Acad Sci U S A. 2006;103(15):6013–6018. doi: 10.1073/pnas.0600890103. [DOI] [PMC free article] [PubMed] [Google Scholar]
- 23.Webster MA, MacLeod DI. Factors underlying individual differences in the color matches of normal observers. J Opt Soc Am A. 1988;5(10):1722–1735. doi: 10.1364/josaa.5.001722. [DOI] [PubMed] [Google Scholar]
- 24.Hofer H, Carroll J, Neitz J, Neitz M, Williams DR. Organization of the human trichromatic cone mosaic. J Neurosci. 2005;25(42):9669–9679. doi: 10.1523/JNEUROSCI.2414-05.2005. [DOI] [PMC free article] [PubMed] [Google Scholar]
- 25.Roorda A, Williams DR. The arrangement of the three cone classes in the living human eye. Nature. 1999;397(6719):520–522. doi: 10.1038/17383. [DOI] [PubMed] [Google Scholar]
- 26.Jordan G, Mollon JD. Rayleigh matches and unique green. Vision Res. 1995;35(5):613–620. doi: 10.1016/0042-6989(94)00153-d. [DOI] [PubMed] [Google Scholar]
- 27.MacLeod DIA, Golz J. A computational analysis of colour constancy. In: Mausfeld R, Heyer D, editors. Colour Perception: Mind and the Physical World. Oxford University Press; New York: 2003. pp. 205–242. [Google Scholar]
- 28.Mizokami Y, Webster MA. Are Gaussian spectra a viable perceptual assumption in color appearance? Journal of the Optical Society of America A. doi: 10.1364/JOSAA.29.000A10. (under review) [DOI] [PMC free article] [PubMed] [Google Scholar]


