

Abstract
This study evaluated early renal functional, structural, and biochemical changes in high-calorie/high-fat diet fed mice, a model of prediabetes and alimentary obesity. Male C57BL6/J mice were fed normal (11 kcal% fat) or high-fat (58 kcal% fat) diets for 16 wk. Renal changes were evaluated by histochemistry and immunohistochemistry, Western blot analysis, ELISA, enzymatic assays, and chemiluminometry. High-fat diet consumption led to increased body and kidney weights, impaired glucose tolerance, hyperinsulinemia, polyuria, a 2.7-fold increase in 24-h urinary albumin excretion, 20% increase in renal glomerular volume, 18% increase in renal collagen deposition, and 8% drop of glomerular podocytes. It also resulted in a 5.3-fold increase in urinary 8-isoprostane excretion and a 38% increase in renal cortex 4-hydroxynonenal adduct accumulation. 4-hydroxynonenal adduct level and immunoreactivity or Sirtuin 1 expression in renal medulla were not affected. Studies of potential mechanisms of the high-fat diet induced renal cortex oxidative injury revealed that whereas nicotinamide adenine dinucleotide phosphate reduced form oxidase activity only tended to increase, 12/15-lipoxygenase was significantly up-regulated, with approximately 12% increase in the enzyme protein expression and approximately 2-fold accumulation of 12(S)-hydroxyeicosatetraenoic acid, a marker of 12/15-lipoxygenase activity. Accumulation of periodic acid-Schiff -positive material, concentrations of TGF-β, sorbitol pathway intermediates, and expression of nephrin, CAAT/enhancer-binding protein homologous protein, phosphoeukaryotic initiation factor-α, and total eukaryotic initiation factor-α in the renal cortex were indistinguishable between experimental groups. Vascular endothelial growth factor concentrations were reduced in high-fat diet fed mice. In conclusion, systemic and renal cortex oxidative stress associated with 12/15-lipoxygenase overexpression and activation is an early phenomenon caused by high-calorie/high-fat diet consumption and a likely contributor to kidney disease associated with prediabetes and alimentary obesity.
Over the last decade, profound changes in the quality, quantity, and source of food consumed in many developed countries, combined with a decrease in the levels of physical activity among the population, have led to an increase in the prevalence of type 2 (non-insulin dependent) diabetes and its complications (1). Prediabetes, i.e. a condition characterized by impaired fasting glucose (100–125 mg/dl), impaired glucose tolerance (2 h postglucose load of 140–199 mg/dl), or both as well as closely associated alimentary obesity and the metabolic syndrome are serious risk factors for the development of cardiovascular disease (2) and peripheral (3) and cardiac autonomic (4) neuropathies as well as nephropathy (5). Furthermore, many people with prediabetes develop end-stage microvascular disease that manifest in blindness, amputations, and kidney failure similar to those seen in patients with overt diabetes (6).
Evidence from epidemiological studies suggest that increased dietary fat consumption plays an important role in the growing epidemic of obesity [reviewed in Ref. (7)]. Furthermore, the link between a high-fat, Western-style diet and the onset of type 2 diabetes is firmly established (8). We and others demonstrated that high-calorie/high-fat diet (HFD)-fed rats and mice develop impaired glucose tolerance, insulin resistance, and obesity, in the absence of overt hyperglycemia (7, 9). It is remarkable that consumption of a single high-fat meal has been associated with a transient impairment of vascular function in humans (10). Therefore, it is not surprising that steady HFD consumption leads to diabetes-like endothelial dysfunction (11), peripheral (9) and autonomic (12) neuropathies, and impaired wound healing (13).
Evidence for diabetes-like renal changes induced by HFD is emerging (14–17). Pioneering studies (14, 15) identified increased glomerular volume and glomerular filtration rate and collagen IV immunoreactivity as well as mesangial cell dedifferentiation and reduced glomerular filtration rate, an approximately 5-fold increase in albuminuria, probably resulting from a 3-fold reduction in glomerular capillary loop nephrin expression, and mesangial expansion, in C57BL6/J mice maintained on HFD for 16 and 26 wk, respectively. A robust structural and biochemical characterization of HFD-induced nephropathy at its earliest stage has never been performed. This study was designed to provide a comprehensive characterization of early functional, structural, and biochemical consequences of HFD feeding. We evaluated renal cortex sorbitol pathway activity, variables of oxidative and endoplasmic reticulum stresses, and growth factors previously implicated in the pathogenesis of diabetic nephropathy [reviewed in Ref. (18)]. Identification of HFD-induced profound systemic and renal cortex oxidative stress consequently led us to evaluation of this phenomenon in renal medulla, which are particularly vulnerable to oxidative damage (19).
Materials and Methods
Reagents
Rabbit polyclonal anti-Wilms tumor gene product-1 antibody was purchased from Santa Cruz Biotechnology (Santa Cruz, CA), and rabbit polyclonal 4-hydroxynonenal (HNE) antibody was from Calbiochem, EMD Chemicals USA (Philadelphia, PA). Alexa Fluor 594 goat antirabbit antibody was obtained from Invitrogen (Eugene, OR). Other reagents for immunohistochemistry were purchased from Vector Laboratories (Burlingame, CA). For Western blot analysis, rabbit polyclonal (clone H-100) anti-12/15-lipoxygenase (12/15-LO) antibody was obtained from Santa Cruz Biotechnology, and rabbit polyclonal antinephrin antibody was from Abcam (Cambridge, MA). Mouse monoclonal CAAT/enhancer-binding protein homologous protein (CHOP) antibody and rabbit polyclonal antibodies for total and phosphorylated eukaryotic initiation factor-α (eIF2α) were purchased from Cell Signaling (Danvers, MA). The mouse monoclonal anti-Sirtuin 1 (Sirt 1) antibody and all the other chemicals were obtained from Sigma-Aldrich (St. Louis, MO). All chemicals were of reagent-grade quality.
Animals
The experiments were performed in accordance with regulations specified by The Guide for the Care and Handling of Laboratory Animals (National Institutes of Health publication no. 85-23) and the Pennington Biomedical Research Center Protocol for Animal Studies. Mature male C57BL6/J mice were purchased from Jackson Laboratories (Bar Harbor, ME). The mice had access to water ad libitum and were assigned to receive normal or high-fat diets [D12328, 11 kcal% fat, and D 12330, 58 kcal% fat with corn starch, respectively (Research Diets, Inc., New Brunswick, NJ)] for 16 wk, ad libitum. At the end of the study, the mice were placed in individual metabolic cages (Lab Products, Inc., Seaford, DE) for a 7-d adaptation before 48-h urine collection in experiment 1 or assessment of food/calorie intake on 3 consecutive days (the result was averaged) in experiment 2. Urine specimen were centrifuged at 12,000 × g (4 C, 10 min) and frozen for subsequent assessment of albumin and 8-isoprostane by ELISA. One day before the animals were killed, mice were subjected to glucose tolerance test as we described previously (9). Blood samples for nonfasting glucose measurements were taken from the tail vein at the time of euthanasia.
Anesthesia, euthanasia, and tissue sampling
The mice were sedated by CO2 and immediately killed by cervical dislocation. In experiment 1, kidneys were weighed. Fragments of the external part (cortex) of one kidney were rapidly (∼30–40 sec after euthanasia) cut off and frozen in liquid nitrogen subsequently for the following: 1) Western blot analyses of nephrin, 12/15-LO, CHOP, and total and phosphorylated eIF2α; 2) ELISA measurements of TGF-β1 and vascular endothelial growth factor (VEGF), 12(S)-hydroxyeicosatetraenoic acid [12(S)HETE], and HNE adducts; 3) enzymatic spectrofluorometric measurements of glucose and sorbitol pathway intermediates; and 4) chemiluminometric evaluation of nicotinamide adenine dinucleotide phosphate reduced form [NAD(P)H] oxidase activity. The second kidney was fixed in normal buffered 4% formaldehyde for further assessment of renal glomerular volume, collagen deposition, podocyte counts, and periodic acid-Schiff (PAS) staining as well as HNE adduct immunoreactivity in renal medulla. In experiment 2, kidneys were either used for isolation of renal medulla for subsequent HNE adduct measurements or were immediately frozen in liquid nitrogen for further assessment of Sirt 1 expression.
Specific methods
Urinary albumin and 8-isoprostane
Urinary albumin and 8-isoprostane were assessed by ELISA with an AssayMax mouse albumin ELISA kit (AssayPro, St. Charles, MO) and a urinary isoprostane ELISA kit (Oxford Biomedical Research, Oxford, MI), respectively. The assays were performed in accordance with the manufacturers' instructions.
Renal TGF-β1, VEGF, HNE adduct, and 12(S)HETE concentrations
For measurements of TGF-β1, renal cortex samples were homogenized on ice in radioimmunoprecipitation assay buffer [1:10 (wt/vol)] containing 50 mm Tris-HCl, pH 7.2; 150 mm NaCl; 0.1% sodium dodecyl sulfate; 1% Tergitol-type NP-40 (nonyl phenoxypolyethoxylethanol); 5 mm EDTA; 1 mm EGTA; 1% sodium deoxycholate and the protease/phosphatase inhibitors leupeptin (10 μg/ml), aprotinin (20 μg/ml), benzamidine (10 mm), phenylmethylsulfonyl fluoride (1 mm), and sodium orthovanadate (1 mm). Homogenates were sonicated (3 × 5 sec) and centrifuged at 14,000 × g (4 C, 20 min). TGF-β1 concentrations were measured with the Quantikine mouse/rat/porcine/canine TGF-β1 kit (R&D Systems, Minneapolis, MN). For VEGF measurements, renal cortex samples were homogenized in 20 mm PBS (pH 7.4) [1:20 (wt/vol)] on ice. Homogenate was used for VEGF measurements with the Quantikine Mouse VEGF ELISA kit (R&D Systems). For HNE adduct measurements, samples of renal cortex or medulla were homogenized in 20 mm PBS (pH 7.4) [1:10, (wt/vol)] on ice and centrifuged at 14,000 × g (4 C, 20 min). HNE adducts were measured in supernatants with the OxiSelect HNE-His adduct ELISA kit (Cell BioLabs, Inc., San Diego, CA). For 12(S)HETE evaluation, renal cortex samples were homogenized on ice in 15 mm Tris-HCI buffer [1:100 (wt/vol)] containing 140 mm NaCl (pH 7.6) and centrifuged. The assay was performed in supernatants with the 12(S)HETE enzyme immunoassay kit (Assay Designs, Ann Arbor, MI). All the ELISA measurements were performed in accordance with the manufacturers' instructions. Protein was measured with the bicinchoninic acid protein assay (Pierce Biotechnology, Rockford, IL).
Western blot analysis
Western blot analyses of renal cortex 12/15-LO, nephrin, CHOP, and total and phosphorylated eIF2α as well as renal medullary Sirt 1 were performed as described previously (19, 20). Protein bands were visualized with the Amersham ECL Western blotting detection reagents and analysis system (GE Healthcare, Buckinghamshire, UK). Membranes were then stripped and reprobed with β-actin antibody to verify equal protein loading. The data were quantified by densitometry (Quantity One 4.5.0 software; Bio-Rad Laboratories, Richmond, CA).
NAD(P)H oxidase activity
NADPH oxidase activity was measured by the lucigenin-enhanced chemiluminescence method (21). To the frozen cortex, 200 μl of ice-cold lysis buffer containing 20 mm KH2PO4 (pH 7.0), 1 mm EGTA, 1 mm phenylmethylsulfonyl fluoride, 10 μg/ml aprotinin, and 0.5 μg/ml leupeptin were added. The samples were homogenized with 100 strokes in a Dounce homogenizer on ice. The lysates were centrifuged at 800 × g for 10 min at 4 C. Protein was determined in the clear supernatant using the Bio-Rad protein assay reagent. To start the assay, 100 μl of the supernatant was added into 900 μl of 50 mm phosphate buffer (pH 7.0) containing 1 mm EGTA, 150 mm sucrose, 5 μm lucigenin, and 100 μm NAD(P)H. Photon emission in terms of relative light units was measured every 30 sec for 5 min in a luminometer. The superoxide production was expressed as relative light units per milligram of protein.
Immunohistochemical studies
All renal sections were processed by a single investigator and evaluated blindly. To determine glomerular volume, glomerular-capillary tuft area was measured using ImageJ 1.44k software (National Institutes of Health, Bethesda, MD). For each mouse, 15–20 glomeruli that had been cut randomly at vascular pole were selected for analysis. Glomerular volume was calculated using the equation: glomerular volume = 1.2545 (glomerular-capillary tuft area)1.5 (22). Collagen and PAS staining were performed by conventional histochemical methods. At least 10 fields of each section (∼50 glomeruli) were examined to select one representative image. Color intensity of renal sections stained for PAS-positive substances was calculated using the ImageJ 1.44k software (National Institutes of Health). Twenty-five to 40 glomeruli were evaluated in a blinded fashion for each animal. Five-micrometer renal sections were stained for collagen with Masson's trichrome as described (23), after which the percentage of areas positively stained for collagen was quantified in 10 randomly taken microphotographs of each section using the Threshold Color plug-in of the ImageJ 1.44k program, and the average per mouse was calculated. Podocyte nuclei were detected in 3-μm sections with an anti-Wilms tumor gene product-1 antibody and the ATP-binding cassette staining kit and visualized with the diaminobenzidine detection kit (both kits from Vector Laboratories). Podocyte numbers were counted per glomerular section, and 20–25 glomeruli were examined for each animal. Low-power observations of renal sections were made using an Olympus BX41 microscope (Tokyo, Japan). Color images were captured with a MiniVID digital camera (LW Scientific, Inc., Lawrenceville, GA) at 1280 × 1024 resolution.
For the evaluation of HNE adduct immunoreactivity, 3-μm renal sections were incubated with 10% goat serum for 1 h at room temperature, after which anti-4-HNE primary antibody [1:50 dilution in Tris-buffered saline containing 5% goat serum and 0.3% Triton X-100] was applied for 16 h at 4 C. The sections were washed with Tris-buffered saline containing 0.3% Triton X-100 and incubated with Alexa Fluor 594 antibody (1:400; Invitrogen) for 1 h at room temperature. The microphotographs of medullary sections were taken at ×100 magnification using a 3I Everest imaging system (Intelligent Imaging Innovations, Inc., Denver, CO) equipped with Axioplan 2 microscope (Zeiss, Oberkoechen, Germany). The intensity of fluorescence was measured using NIH ImageJ software, version 1.44k.
Renal cortex glucose and sorbitol pathway intermediate concentrations
Renal cortex glucose, sorbitol, and fructose concentrations were assessed by spectrofluorometric enzymatic methods with hexokinase/glucose 6-phosphate dehydrogenase, sorbitol dehydrogenase, and fructose dehydrogenase as we described previously (24).
Statistical analysis
The results are expressed as mean ± se. Individual comparisons between control and diabetic rats or mice were made using the unpaired two-tailed Student's t test or Mann-Whitney rank sum test where appropriate. Significance was defined at P ≤ 0.05.
Results
Mice fed a HFD for 16 wk had a 46 and 41% increase in body weight in experiments 1 and 2, respectively (Table 1). Nonfasting blood glucose concentrations tended to increase, but the difference with the group maintained on the control diet did not achieve statistical significance. Daily food consumption (grams) was similar in the mice fed normal and the HFD, whereas daily calorie intake was 34% greater in the HFD-fed group (Table 1). The HFD-fed mice displayed a 168% increase in urine volume and a 173% increase in urinary albumin excretion. They also had clearly manifested the whole kidney as well as glomerular hypertrophy.
Table 1.
Body weights, blood glucose concentrations, urination volumes, daily food and calorie consumption, urinary albumin excretions, total kidney weights, and glomerular volumes in mice fed control or high-fat diet
| Variable | Control diet | High-fat diet |
|---|---|---|
| Experiment 1 | ||
| Body weight (g) | 33.20 ± 1.11 | 48.64 ± 0.94a |
| Blood glucose (mmol/liter) | 8.48 ± 0.27 | 9.35 ± 0.41 |
| Urination (ml) | 0.60 ± 0.11 | 1.61 ± 0.23a |
| Urinary albumin excretion (μg per 24 h) | 13.68 ± 3.17 | 37.40 ± 4.61a |
| Total kidney weight (g) | 0.374 ± 0.011 | 0.413 ± 0.008a |
| Glomerular volume (μm3) | 253,122 ± 5,782 | 303,688 ± 13,528a |
| Experiment 2 | ||
| Body weight (g) | 30.3 ± 1.05 | 42.6 ± 0.72a |
| Blood glucose (mmol/liter) | 7.54 ± 0.28 | 8.47 ± 0.61 |
| Daily food consumption (g) | 3.48 ± 0.06 | 3.41 ± 0.12 |
| Daily calorie intake (kcal) | 14.16 ± 0.25 | 18.93 ± 0.65a |
Data are expressed as means ± sem and n = 10–14 per group in experiment 1 and n = 14–15 per group in experiment 2.
P < 0.01 vs. mice fed the control diet.
The HFD-fed mice had impaired glucose tolerance (Fig. 1A) despite severe hyperinsulinemia (Fig. 1B).
Fig. 1.

Glucose tolerance curves (A) and serum insulin concentrations (B) in mice fed normal or high-fat diets. ND, Mice fed a normal diet; HFD, Mice fed the HFD. Mean ± sem, n = 12 per group. *, **, P < 0.05 and P < 0.01 vs. the group fed the normal diet.
Glomerular podocyte count was reduced by 8% in the HFD-fed mice compared with the control group (P < 0.01, Fig. 2, A and B). A 16-wk HFD feeding resulted in a 20% increase of renal collagen deposition (Fig. 2, C and D), in the absence of mesangial expansion (Fig. 2, E and F).
Fig. 2.

Representative microphotographs of glomerular podocyte immunostainings and podocyte counts (A and B), representative microphotographs and percentage of positively stained for collagen areas (C and D),and representative microphotographs and color intensities of PAS-positive substance stainings (E and F) in the renal cortex of mice fed normal or high-fat diets. Magnification, ×200 (C) and ×400 (A and E). ND, Mice fed a normal diet; HFD, mice fed HFD. Mean ± sem, n = 10–13 per group. *, **, P < 0.05 and P < 0.01 vs. group fed normal diet.
Renal cortex TGF-β1 concentrations were similar in the mice maintained on control or high-fat diets (Fig. 3A). Surprisingly, renal cortex VEGF concentrations were reduced by 26% in the HFD-fed mice compared with the control group (Fig. 3B). The expression of nephrin (Fig. 3, C and D) and three variables of endoplasmic reticulum (ER) stress, CHOP (Fig. 3, E and F), and phosphorylated and total eIF2α (Fig. 3, G–I), were similar in the kidney cortex of the mice fed control or high-fat diets.
Fig. 3.

TGF-β1 (A) and VEGF (B) concentrations and representative Western blot analyses of nephrin (C), CHOP (E), and phosphorylated and total eIF2α (G); and protein contents (densitometry) of nephrin (D), CHOP (F), and phosphorylated (H) and total eIF2α (I) in the renal cortex of mice fed normal or high-fat diets. ND, Mice fed a normal diet; HFD, mice fed a HFD. Mean ± sem, n = 10–14 per group. **, P < 0.01 vs. group fed normal diet.
A 16-wk HFD feeding resulted in a 421% increase in urinary 8-isoprostane excretion (Fig. 4A) and a 38% increase in renal cortex HNE adduct concentration (Fig. 4B), consistent with the development of systemic and renal cortex oxidative stress. In contrast, HNE adduct level (Fig. 5A) and immunoreactivity (Fig. 5, B and C) in renal medulla as well as Sirt 1 expression (Fig. 5, D and E) were not affected. Whereas renal cortex NAD(P)H oxidase activity only tended to increase in the HFD-fed group (Fig. 6A), another enzyme involved in reactive oxygen species production, 12/15-LO, was significantly up-regulated. This is evident from a 12% increase in 12/15-LO protein expression (Fig. 6, B and C; P < 0.01) and a 100% increase in 12(S)HETE concentration (Fig. 6D; P < 0.05).
Fig. 4.

Urinary 8-isoprostane excretion (A) and renal cortex 4-HNE adduct concentrations (B) in mice fed normal or high-fat diets. ND, Mice fed a normal diet; HFD, mice fed a HFD. Mean ± sem, n = 10–15 per group. **, P < 0.01 vs. group fed normal diet.
Fig. 5.

4-HNE adduct concentrations (A); representative microphotograph of 4-HNE immunostaining (B, magnification, ×100) and 4-HNE relative fluorescence intensities (C); and representative Western blot analysis of Sirt 1 (D) and Sirt 1 protein content (E) in the renal medulla of mice fed a normal or high-fat diets. ND, Mice fed a normal diet; HFD, mice fed a high-fat diet. Mean ± sem, n = 6–8 per group.
Fig. 6.
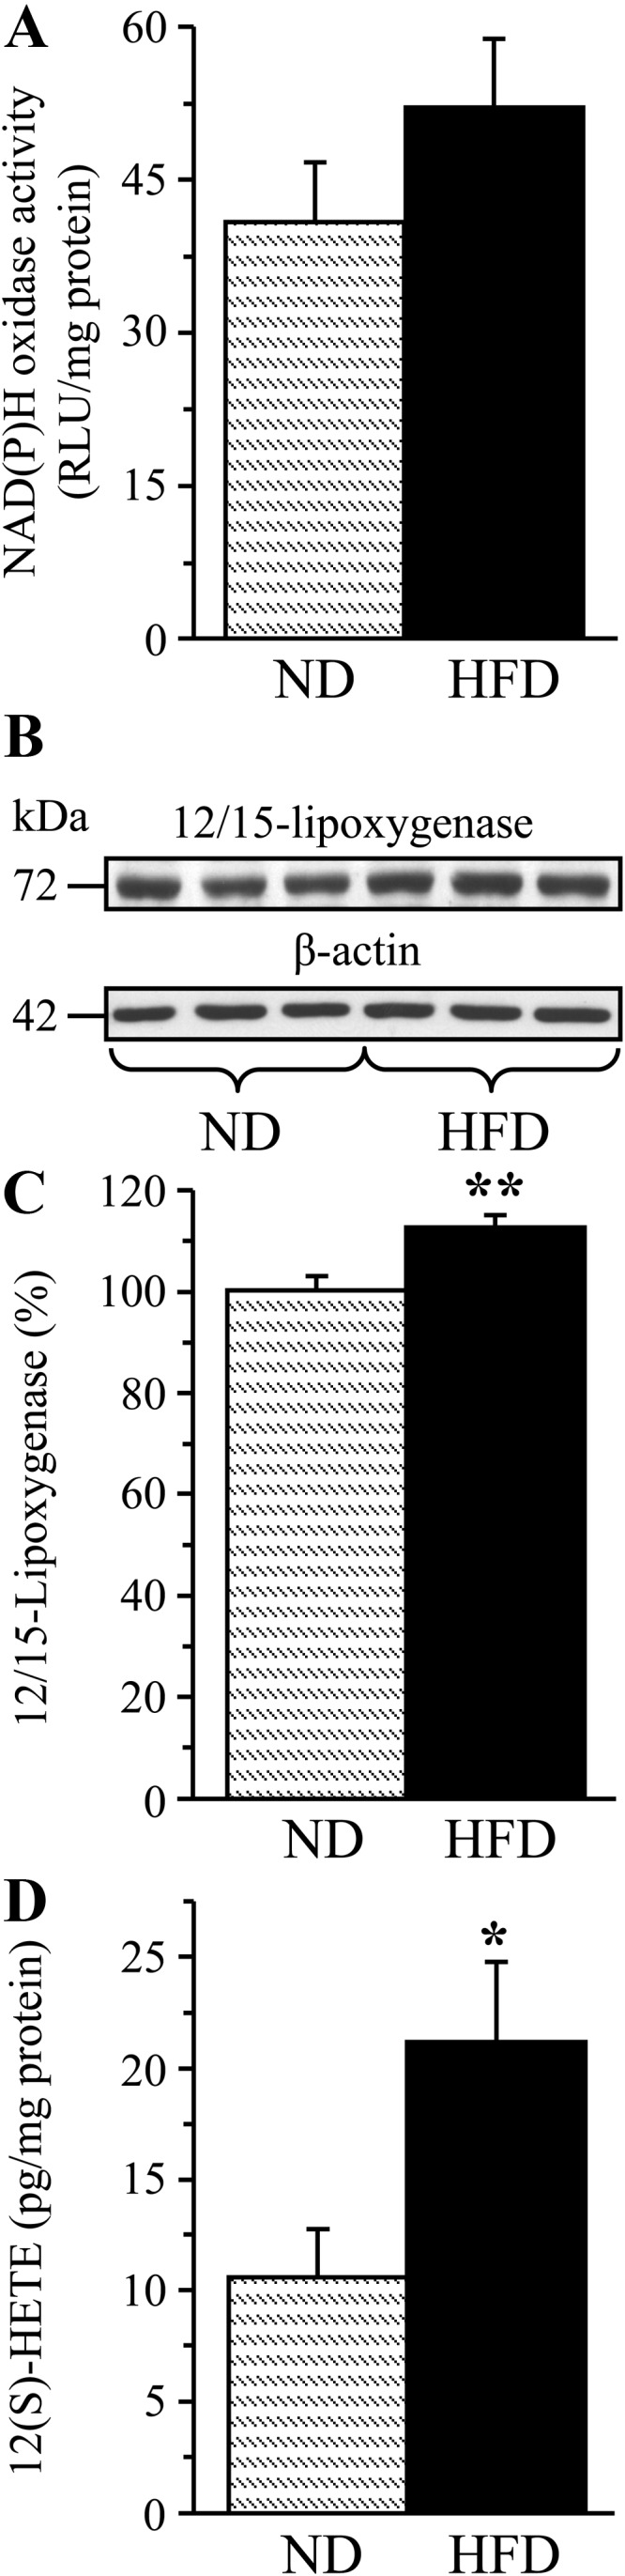
NAD(P)H oxidase activity (A), representative Western blot analysis and protein content (densitometry) of 12/15-LO (B and C), and 12(S)HETE concentrations (D) in the renal cortex of mice fed a normal or high-fat diet. ND, Mice fed a normal diet; HFD, mice fed a HFD. Mean ± sem, n = 9–13 per group. *, **, P < 0.05 and P < 0.01 vs. group fed normal diet.
Renal cortex glucose (Fig. 7A), sorbitol (Fig. 7B), and fructose (Fig. 7C) concentrations were similar between the two experimental groups.
Fig. 7.

Glucose (A), sorbitol (B), and fructose (C) concentrations in the renal cortex of mice fed normal or high-fat diets. ND, Mice fed a normal diet; HFD, mice fed a HFD. Mean ± sem, n = 10 per group.
Discussion
Subtle structural changes of the kidney are often apparent in human subjects with microalbumiuria, the earliest clinical sign of renal damage (25, 26). In the present study, an early 2.7-fold elevation in albumin excretion in HFD-fed prediabetic and obese mice temporarily coincided with podocyte loss, kidney hypertrophy, and an increase in renal glomerular volume and collagen deposition, in the absence of mesangial expansion. These observations suggest relevance of our findings to human disease. The early stage of HFD-induced prediabetic nephropathy was associated with clearly manifest systemic and renal oxidative stress and 12/15-lipoxygenase overexpression and activation. Of note is the lack of diabetes-like changes in the sorbitol pathway activity, TGF-β1 and VEGF content, and expression of nephrin, CHOP, and total and phopshorylated eIF2α in the renal cortex. The findings obtained have a number of important implications for understanding the pathogenesis of kidney disease associated with prediabetes and alimentary obesity as well as for clinical management of this condition.
Albuminuria is a generally accepted hallmark of diabetic nephropathy. In humans, microalbuminuria is associated with an approximately 2-fold increase in cardiovascular morbidity and mortality (25–28) and elevated risk of progression to macroalbuminuria and end-stage renal disease [reviewed in Refs. (25 and 26)]. Whereas it is important to prevent microalbuminuria and thus diminish the probability of development of overt diabetic nephropathy with its associated complications, studies on prevention of microalbuminuria produced inconsistent results, at least partially due to the difficulty in identifying subjects at risk of this condition (25). The present study, consistent with clinical reports (27, 28), suggests that overweight and obese subjects should be screened for albuminuria. Furthermore, reduction in dietary fat intake and antioxidant supplementation may represent potentially effective means of combating development and progression of microalbuminuria.
Our findings are the first to demonstrate that microalbuminuria at an early stage of HFD-induced kidney disease is associated with a small, but significant, podocyte loss. Renal cortex expression of nephrin, a transmembrane protein marker of the integrity of renal glomerular podocyte slit diaphragms, was, however, indistinguishable between the mice fed normal and HFD. Note that a longer (26 wk) HFD feeding has been reported to result in a 3-fold decrease of nephrin immunoreactivity in glomerular capillary loops (15). This suggests that nephrin is involved in the development of pathological changes in the kidney at a later stage of dietary fat-induced prediabetes and obesity.
In the present study, kidney hypetrophy was clearly manifest after a 16-wk HFD feeding. In contrast, no increase in kidney size was observed in the same animal model after a 16-wk consumption of a Western diet (38% fat) by others (16). Our observation of the HFD-induced increase in renal glomerular volume is consistent with a pioneering report (14), suggesting progression of this manifestation of diabetes-like nephropathy with the prolongation of HFD consumption. Whereas our findings did not reveal mesangial expansion in HFD-fed mice, the increase in both absolute mesangial volume and percentage of mesangial volume per glomerulus was identified as a later consequence of this dietary pattern (15).
Deposition of collagen, a glomerular basement membrane matrix molecule produced by podocytes, is a characteristic feature of both type 1 and type 2 diabetic nephropathies. This phenomenon, together with accumulation of other extracellular matrix proteins, plays an important role in the development of glomerulosclerosis and tubulointerstitial fibrosis. Changes in two urinary collagen fragments were recently found to be associated with the progression of diabetic nephropathy in human subjects with type 2 diabetes (29). Our first quantitative assessment of HFD-induced renal collagen deposition revealed a marked (18%) increase within 16 wk of starting this dietary pattern. An accentuated glomerular collagen IY immunoreactivity has been reported even at an earlier stage, but no quantitative data were provided (14).
Multiple interrelated biochemical mechanisms including, but not limited to, increased aldose reductase activity (30, 31), activation of advanced glycation end-product/receptor for advanced glycation end-product axis (32, 33), advanced lipoxidation (34), protein kinase C (35–37), 12/15-LO (38, 39), and poly(ADP-ribose) polymerase (40, 41), growth factor imbalance (42, 43), oxidative (44, 45) and, more recently, endoplasmic reticulum (46, 47) stresses in the renal cortex have been implicated in the pathogenesis of diabetic nephropathy. Many of these factors have been found to contribute to diabetes-associated albuminuria, podocyte loss, kidney hypertrophy, and glomerular collagen deposition. In contrast, the mechanisms underlying kidney disease associated with HFD-induced prediabetes and alimentary obesity remain unidentified, although a recent study suggested the involvement of advanced glycation end-product/receptor for advanced glycation end-product axis and proinflammatory phenotypic response in albuminuria and renal hyperfiltration (16).
Our findings suggest that both systemic and local oxidative stress, manifest by a dramatic increase in urinary 8-isoprostane excretion as well as renal cortex HNE adduct accumulation, are present at the very early stage of HFD-induced kidney disease. In contrast, HFD consumption did not affect HNE adduct level or immunoreactivity in renal medulla. The latter is consistent with unchanged expression of Sirt 1, the factor primarily localized in renal medulla and protecting them from oxidative injury (19). Note, however, that it is possible that HFD consumption causes Sirt 1 intracellular redistribution, which was not evaluated in the present study. In diabetes, the primary free radical, superoxide, is primarily produced by mitochondrial respiratory chain as well as NAD(P)H oxidase, playing an important role in mesangial expansion and podocyte injury in diabetic kidney disease (21, 48). Both mitochondrial reactive oxygen species production and NAD(P)H oxidase 4 protein expression have been reported increased in HFD-fed mice (17). However, in the present study, a 16-wk HFD feeding only tended to increase NAD(P)H oxidase activity in the whole kidney cortex. In contrast, 12/15-LO, another enzyme participating in renal oxidative stress and pathogenesis of both type 1 and type 2 diabetic nephropathies (38, 39, 49), was already up-regulated at this early stage of dietary obesity and prediabetes, as evident from increased 12/15-LO protein expression and 12(S)HETE concentrations. A report (17) also suggests overexpression of inducible nitric oxide synthase, a potentially important source of nitric oxide for peroxynitrite formation, in the kidney of HFD-fed mice. This variable was not included in the present study because analysis of renal biopsies from human subjects with diabetic nephropathy and nondiabetic individuals revealed that overexpression of endothelial, rather than inducible, nitric oxide synthase is associated with diabetic kidney disease in humans (50).
Our group previously reported that increased aldose reductase activity leads to oxidative-nitrosative stress in the renal cortex of streptozotocin-diabetic rats and high glucose-exposed human mesangial cells (51). We (9) also found that a 16-wk HFD feeding of C57BL6/J mice resulted in both sorbitol pathway activation and oxidative-nitrosative injury, i.e. two abnormalities contributing to the development of nerve conduction deficit and small sensory nerve fiber dysfunction, in the peripheral nerve. In the current study, in the same mouse model, neither renal cortex glucose nor sorbitol pathway intermediate concentrations were elevated in the HFD-fed mice despite clearly manifest oxidative stress. The latter suggests that, in contrast to dietary fat-induced prediabetic peripheral neuropathy (9), early prediabetic kidney disease develops before and independent of sorbitol pathway activation in the renal cortex.
Renal oxidative stress plays an important role in the production of two growth factors, the fibrogenic cytokine TGF-β1 and a mesangial cell and podocyte-derived permeability and angiogenic factor VEGF (42, 45). Both TGF-β1 and VEGF participate in the pathogenesis of diabetic kidney disease (42, 43). However, despite evidence of significant oxidative injury after a 16-wk HFD consumption, renal cortex concentrations of the two growth factors were either preserved in the normal range (TGF-β1) or were paradoxically decreased (VEGF), which suggests that their role in the early nephropathy of prediabetes and alimentary obesity is minor.
In the diabetic condition, there is a bidirectional link between oxidative stress and ER stress (52–54), i.e. the phenomenon resulting from abnormal folding and processing of newly synthesized proteins. Evidence for the important role of ER stress in diabetes-associated β-cell failure (52), insulin resistance (53), and obesity (54) is emerging. Recent studies (46, 47) implicate ER stress in the functional and structural manifestations of diabetic nephropathy, although this relationship has not been studied in detail. In our study, CHOP and phosphorylated and total eIF2α expressions in renal cortex were indistinguishable between the mice fed normal and high-fat diets. However, our findings with the specific inhibitor of eIF2α dephosphorylation salubrinal, obtained in the same animal model, suggest that ER stress is already present at the early stage of nephropathy associated with prediabetes and alimentary obesity and is implicated in renal cortex collagen deposition (Shevalye H., S. Lupachyk, and I. G. Obrosova, unpublished data). Considering the molecular intricacies of ER stress, much more studies with the specific inhibitors and genetic manipulations are needed to dissect the role of this complex phenomenon in diabetic and prediabetic kidney disease.
In conclusion, even a short-term HFD consumption causes both functional and structural kidney damage. This is most likely to occur in part via renal cortex oxidative stress and 12/15-LO activation considering a robust evidence for the key role of both phenomena in kidney disease obtained in animal models of both overt type 1 and type 2 diabetes (21, 44, 45) and hereditary prediabesity (55). Note, however, that many important pathobiochemical changes implicated in diabetic nephropathy, e.g. protein kinase C and poly(ADP-ribose) polymerase activations, have never been studied at this early stage of disease. A direct proof for the involvement of oxidative injury in nephropathy associated with prediabetes and alimentary obesity cannot be obtained using traditional approaches with pharmacological or genetic manipulations affecting pathways of oxidative stress or antioxidant defense in the whole body because those would interfere with the prediabetic condition per se (56–59). In our study (Watcho P., H. Shevalye, and I. G. Obrosova, unpublished observations), weight gain was much lower in HFD-fed, 12/15-LO-deficient mice than in the corresponding wild-type mice; mice with genetic manipulations targeted to renal cells are therefore needed. Also note that specific and quite sophisticated studies are required to dissect the roles for postprandial hyperglycemia, dyslipidemia, visceral adiposity, and dietary fat in the HFD induced oxidative stress and renal damage. The current findings emphasize the importance of a strict adherence to healthy dietary habits and advocate the use of early antioxidant supplementation to prevent the development and progression of nephropathy associated with prediabetes and alimentary obesity.
Acknowledgments
This work was supported by the National Institutes of Health (NIH) Grants RO1DK074517, RO1DK077141, and RO1DK081147, and the American Diabetes Association Research Grants 7-08-RA-102 (all to I.G.O.) and RO1DK078971 (to H.E.A.). The Cell Biology and Bioimaging Core used in this work is supported in part by Center of Biomedical Research Excellence (NIH Grant P20 RR021945) and Nutrition and Obesity Research Center (NIH Grant 1P30-DK072476) grants from the NIH.
Disclosure Summary: The authors have nothing to disclose.
Footnotes
- CHOP
- CAAT/enhancer-binding protein homologous protein
- eIF2α
- eukaryotic initiation factor-α
- ER
- endoplasmic reticulum
- 12(S)HETE
- 12(S)-hydroxyeicosatetraenoic acid
- HFD
- high-fat diet
- HNE
- 4-hydroxynonenal
- 12/15-LO
- 12/15-lipoxygenase
- NAD(P)H
- nicotinamide adenine dinucleotide phosphate reduced form
- PAS
- periodic acid-Schiff
- Sirt 1
- Sirtuin 1
- VEGF
- vascular endothelial growth factor
References
- 1. Yach D, Stuckler D, Brownell KD. 2006. Epidemiologic and economic consequences of the global epidemics of obesity and diabetes. Nat Med 12:62–66 [DOI] [PubMed] [Google Scholar]
- 2. Reindel J, Zander E, Heinke P, Kohnert KD, Allwardt C, Kerner W. 2004. The metabolic syndrome in patients with type 1 diabetes mellitus. Associations with cardiovascular risk factors and cardiovascular morbidity. Herz 29:463–469 [DOI] [PubMed] [Google Scholar]
- 3. Sumner CJ, Sheth S, Griffin JW, Cornblath DR, Polydefkis M. 2003. The spectrum of neuropathy in diabetes and impaired glucose tolerance. Neurology 60:108–111 [DOI] [PubMed] [Google Scholar]
- 4. Laitinen T, Lindström J, Eriksson J, Ilanne-Parikka P, Aunola S, Keinänen-Kiukaanniemi S, Tuomilehto J, Uusitupa M. 2011. Cardiovascular autonomic dysfunction is associated with central obesity in persons with impaired glucose tolerance. Diabet Med 28:699–704 [DOI] [PubMed] [Google Scholar]
- 5. Plantinga LC, Crews DC, Coresh J, Miller ER, 3rd, Saran R, Yee J, Hedgeman E, Pavkov M, Eberhardt MS, Williams DE, Powe NR, Centers for Disease Control and Prevention CKD Surveillance Team 2010. Prevalence of chronic kidney disease in U.S. adults with undiagnosed diabetes or prediabetes. Clin J Am Soc Nephrol 5:673–682 [DOI] [PMC free article] [PubMed] [Google Scholar]
- 6. Hanna-Moussa A, Gardner MJ, Kurukulasuriya LR, Sowers JR. 2009. Dysglycemia/prediabetes and cardiovascular risk factors. Rev Cardiovasc Med 10:202–208 [DOI] [PubMed] [Google Scholar]
- 7. Bray GA, Lovejoy JC, Smith SR, DeLany JP, Lefevre M, Hwang D, Ryan DH, York DA. 2002. The influence of different fats and fatty acids on obesity, insulin resistance and inflammation. J Nutr 132:2488–2491 [DOI] [PubMed] [Google Scholar]
- 8. Ohtsubo K, Takamatsu S, Minowa MT, Yoshida A, Takeuchi M, Marth JD. 2005. Dietary and genetic control of glucose transporter 2 glycosylation promotes insulin secretion in suppressing diabetes. Cell 123:1307–1321 [DOI] [PubMed] [Google Scholar]
- 9. Obrosova IG, Ilnytska O, Lyzogubov VV, Pavlov IA, Mashtalir N, Nadler JL, Drel VR. 2007. High-fat diet induced neuropathy of pre-diabetes and obesity: effects of “healthy” diet and aldose reductase inhibition. Diabetes 56:2598–2608 [DOI] [PubMed] [Google Scholar]
- 10. Jakulj F, Zernicke K, Bacon SL, van Wielingen LE, Key BL, West SG, Campbell TS. 2007. A high-fat meal increases cardiovascular reactivity to psychological stress in healthy young adults. J Nutr 137:935–939 [DOI] [PubMed] [Google Scholar]
- 11. Kobayasi R, Akamine EH, Davel AP, Rodrigues MA, Carvalho CR, Rossoni LV. 2010. Oxidative stress and inflammatory mediators contribute to endothelial dysfunction in high-fat diet-induced obesity in mice. J Hypertens 28:2111–2119 [DOI] [PubMed] [Google Scholar]
- 12. Toque HA, da Silva FH, Calixto MC, Lintomen L, Schenka AA, Saad MJ, Zanesco A, Antunes E. 2011. High-fat diet associated with obesity induces impairment of mouse corpus cavernosum responses. BJU Int 107:1628–1634 [DOI] [PubMed] [Google Scholar]
- 13. Seitz O, Schürmann C, Hermes N, Müller E, Pfeilschifter J, Frank S, Goren I. 2010. Wound healing in mice with high-fat diet- or ob gene-induced diabetes-obesity syndromes: a comparative study. Exp Diabetes Res 2010:476969. [DOI] [PMC free article] [PubMed] [Google Scholar]
- 14. Wei P, Lane PH, Lane JT, Padanilam BJ, Sansom SC. 2004. Glomerular structural and functional changes in a high-fat diet mouse model of early-stage type 2 diabetes. Diabetologia 47:1541–1549 [DOI] [PubMed] [Google Scholar]
- 15. Wei P, Grimm PR, Settles DC, Balwanz CR, Padanilam BJ, Sansom SC. 2009. Simvastatin reverses podocyte injury but not mesangial expansion in early stage type 2 diabetes mellitus. Ren Fail 31:503–513 [DOI] [PMC free article] [PubMed] [Google Scholar]
- 16. Harcourt BE, Sourris KC, Coughlan MT, Walker KZ, Dougherty SL, Andrikopoulos S, Morley AL, Thallas-Bonke V, Chand V, Penfold SA, de Courten MP, Thomas MC, Kingwell BA, Bierhaus A, Cooper ME, Courten B, Forbes JM. 2011. Targeted reduction of advanced glycation improves renal function in obesity. Kidney Int 80:190–198 [DOI] [PubMed] [Google Scholar]
- 17. Ruggiero C, Ehrenshaft M, Cleland E, Stadler K. 2011. High fat diet induces an initial adaptation of mitochondrial bioenergetics in the kidney despite evident oxidative stress and mitochondrial ROS production. Am J Physiol Endocrinol Metab 300:E1047–E1058 [DOI] [PMC free article] [PubMed] [Google Scholar]
- 18. Marshall SM, Flyvbjerg A. 2006. Prevention and early detection of vascular complications of diabetes. BMJ 333:475–480 [DOI] [PMC free article] [PubMed] [Google Scholar]
- 19. He W, Wang Y, Zhang MZ, You L, Davis LS, Fan H, Yang HC, Fogo AB, Zent R, Harris RC, Breyer MD, Hao CM. 2010. Sirt1 activation protects the mouse renal medulla from oxidative injury. J Clin Invest 120:1056–1068 [DOI] [PMC free article] [PubMed] [Google Scholar]
- 20. Shevalye H, Maksimchyk Y, Watcho P, Obrosova IG. 2010. Poly(ADP-ribose) polymerase-1 (PARP-1) gene deficiency alleviates diabetic kidney disease. Biochim Biophys Acta 1802:1020–1027 [DOI] [PMC free article] [PubMed] [Google Scholar]
- 21. Gorin Y, Block K, Hernandez J, Bhandari B, Wagner B, Barnes JL, Abboud HE. 2005. Nox4 NAD(P)H oxidase mediates hypertrophy and fibronectin expression in the diabetic kidney. J Biol Chem 280:39616–39626 [DOI] [PubMed] [Google Scholar]
- 22. Rangan GK, Tesch GH. 2007. Quantification of renal pathology by image analysis. Nephrology 12:553–558 [DOI] [PubMed] [Google Scholar]
- 23. Figarola JL, Loera S, Weng Y, Shanmugam N, Natarajan R, Rahbar S. 2008. LR-90 prevents dyslipidaemia and diabetic nephropathy in the Zucker diabetic fatty rat. Diabetologia 51:882–891 [DOI] [PubMed] [Google Scholar]
- 24. Obrosova IG, Van Huysen C, Fathallah L, Cao X, Stevens MJ, Greene DA. 2000. Evaluation of α(1)-adrenoceptor antagonist on diabetes-induced changes in peripheral nerve function, metabolism, and antioxidative defense. FASEB J 14:1548–1558 [DOI] [PubMed] [Google Scholar]
- 25. Glassock RJ. 2010. Is the presence of microalbuminuria a relevant marker of kidney disease? Curr Hypertens Rep 12:364–368 [DOI] [PMC free article] [PubMed] [Google Scholar]
- 26. Radbill B, Murphy B, LeRoith D. 2008. Rationale and strategies for early detection and management of diabetic kidney disease. Mayo Clin Proc 83:1373–1381 [DOI] [PubMed] [Google Scholar]
- 27. Klausen KP, Parving HH, Scharling H, Jensen JS. 2007. The association between metabolic syndrome, microalbuminuria and impaired renal function in the general population: impact on cardiovascular disease and mortality. J Intern Med 262:470–478 [DOI] [PubMed] [Google Scholar]
- 28. Klausen KP, Parving HH, Scharling H, Jensen JS. 2009. Microalbuminuria and obesity: impact on cardiovascular disease and mortality. Clin Endocrinol (Oxf) 71:40–45 [DOI] [PubMed] [Google Scholar]
- 29. Andersen S, Mischak H, Zürbig P, Parving HH, Rossing P. 2010. Urinary proteome analysis enables assessment of renoprotective treatment in type 2 diabetic patients with microalbuminuria. BMC Nephrol 11:29. [DOI] [PMC free article] [PubMed] [Google Scholar]
- 30. Oates PJ. 2010. Aldose reductase inhibitors and diabetic kidney disease. Curr Opin Investig Drugs 11:402–417 [PubMed] [Google Scholar]
- 31. Liu H, Luo Y, Zhang T, Zhang Y, Wu Q, Yuan L, Chung SS, Oates PJ, Yang JY. 2011. Genetic deficiency of aldose reductase counteracts the development of diabetic nephropathy in C57BL/6 mice. Diabetologia 54:1242–1251 [DOI] [PMC free article] [PubMed] [Google Scholar]
- 32. Beisswenger PJ, Makita Z, Curphey TJ, Moore LL, Jean S, Brinck-Johnsen T, Bucala R, Vlassara H. 1995. Formation of immunochemical advanced glycosylation end products precedes and correlates with early manifestations of renal and retinal disease in diabetes. Diabetes 44:824–829 [DOI] [PubMed] [Google Scholar]
- 33. Peppa M, Brem H, Cai W, Zhang JG, Basgen J, Li Z, Vlassara H, Uribarri J. 2006. Prevention and reversal of diabetic nephropathy in db/db mice treated with alagebrium (ALT-711). Am J Nephrol 26:430–436 [DOI] [PubMed] [Google Scholar]
- 34. Iacobini C, Menini S, Ricci C, Scipioni A, Sansoni V, Mazzitelli G, Cordone S, Pesce C, Pugliese F, Pricci F, Pugliese G. 2009. Advanced lipoxidation end-products mediate lipid-induced glomerular injury: role of receptor-mediated mechanisms. J Pathol 218:360–369 [DOI] [PubMed] [Google Scholar]
- 35. Koya D, Haneda M, Nakagawa H, Isshiki K, Sato H, Maeda S, Sugimoto T, Yasuda H, Kashiwagi A, Ways DK, King GL, Kikkawa R. 2000. Amelioration of accelerated diabetic mesangial expansion by treatment with a PKCβ inhibitor in diabetic db/db mice, a rodent model for type 2 diabetes. FASEB J 14:439–447 [DOI] [PubMed] [Google Scholar]
- 36. Ohshiro Y, Ma RC, Yasuda Y, Hiraoka-Yamamoto J, Clermont AC, Isshiki K, Yagi K, Arikawa E, Kern TS, King GL. 2006. Reduction of diabetes-induced oxidative stress, fibrotic cytokine expression, and renal dysfunction in protein kinase Cβ-null mice. Diabetes 55:3112–3120 [DOI] [PubMed] [Google Scholar]
- 37. Geraldes P, King GL. 2010. Activation of protein kinase C isoforms and its impact on diabetic complications. Circ Res 106:1319–1331 [DOI] [PMC free article] [PubMed] [Google Scholar]
- 38. Ma J, Natarajan R, LaPage J, Lanting L, Kim N, Becerra D, Clemmons B, Nast CC, Surya Prakash GK, Mandal M, Adler SG. 2005. 12/15-Lipoxygenase inhibitors in diabetic nephropathy in the rat. Prostaglandins Leukot Essent Fatty Acids 72:13–20 [DOI] [PubMed] [Google Scholar]
- 39. Yuan H, Lanting L, Xu ZG, Li SL, Swiderski P, Putta S, Jonnalagadda M, Kato M, Natarajan R. 2008. Effects of cholesterol-tagged small interfering RNAs targeting 12/15-lipoxygenase on parameters of diabetic nephropathy in a mouse model of type 1 diabetes. Am J Physiol Renal Physiol 295:F605–F617 [DOI] [PMC free article] [PubMed] [Google Scholar]
- 40. Szabó C, Biser A, Benko R, Böttinger E, Suszták K. 2006. Poly(ADP-ribose) polymerase inhibitors ameliorate nephropathy of type 2 diabetic Leprdb/db mice. Diabetes 55:3004–3012 [DOI] [PubMed] [Google Scholar]
- 41. Drel VR, Xu W, Zhang J, Pavlov IA, Shevalye H, Slusher B, Obrosova IG. 2009. Poly(adenosine 5′-diphosphate-ribose) polymerase inhibition counteracts multiple manifestations of experimental type 1 diabetic nephropathy. Endocrinology 150:5273–5283 [DOI] [PMC free article] [PubMed] [Google Scholar]
- 42. Flyvbjerg A, Dagnaes-Hansen F, De Vriese AS, Schrijvers BF, Tilton RG, Rasch R. 2002. Amelioration of long-term renal changes in obese type 2 diabetic mice by a neutralizing vascular endothelial growth factor antibody. Diabetes 51:3090–3094 [DOI] [PubMed] [Google Scholar]
- 43. Ziyadeh FN. 2008. Different roles for TGF-β and VEGF in the pathogenesis of the cardinal features of diabetic nephropathy. Diabetes Res Clin Pract 82:S38–S41 [DOI] [PubMed] [Google Scholar]
- 44. Agardh CD, Stenram U, Torffvit O, Agardh E. 2002. Effects of inhibition of glycation and oxidative stress on the development of diabetic nephropathy in rats. J Diabetes Complications 16:395–400 [DOI] [PubMed] [Google Scholar]
- 45. DeRubertis FR, Craven PA, Melhem MF. 2007. Acceleration of diabetic renal injury in the superoxide dismutase knockout mouse: effects of tempol. Metabolism 56:1256–1264 [DOI] [PubMed] [Google Scholar]
- 46. Wu J, Zhang R, Torreggiani M, Ting A, Xiong H, Striker GE, Vlassara H, Zheng F. 2010. Induction of diabetes in aged C57B6 mice results in severe nephropathy: an association with oxidative stress, endoplasmic reticulum stress, and inflammation. Am J Pathol 176:2163–2176 [DOI] [PMC free article] [PubMed] [Google Scholar]
- 47. Qi W, Mu J, Luo ZF, Zeng W, Guo YH, Pang Q, Ye ZL, Liu L, Yuan FH, Feng B. 2011. Attenuation of diabetic nephropathy in diabetes rats induced by streptozotocin by regulating the endoplasmic reticulum stress inflammatory response. Metabolism 60:594–603 [DOI] [PubMed] [Google Scholar]
- 48. Eid AA, Gorin Y, Fagg BM, Maalouf R, Barnes JL, Block K, Abboud HE. 2009. Mechanisms of podocyte injury in diabetes: role of cytochrome P450 and NADPH oxidases. Diabetes 58:1201–1211 [DOI] [PMC free article] [PubMed] [Google Scholar]
- 49. Kang SW, Natarajan R, Shahed A, Nast CC, LaPage J, Mundel P, Kashtan C, Adler SG. 2003. Role of 12-lipoxygenase in the stimulation of p38 mitogen-activated protein kinase and collagen α5(IV) in experimental diabetic nephropathy and in glucose-stimulated podocytes. J Am Soc Nephrol 14:3178–3187 [DOI] [PubMed] [Google Scholar]
- 50. Hohenstein B, Hugo CP, Hausknecht B, Boehmer KP, Riess RH, Schmieder RE. 2008. Analysis of NO-synthase expression and clinical risk factors in human diabetic nephropathy. Nephrol Dial Transplant 23:1346–1354 [DOI] [PubMed] [Google Scholar]
- 51. Drel VR, Pacher P, Stevens MJ, Obrosova IG. 2006. Aldose reductase inhibition counteracts nitrosative stress and poly(ADP-ribose) polymerase activation in diabetic rat kidney and high-glucose-exposed human mesangial cells. Free Radic Biol Med 40:1454–1465 [DOI] [PMC free article] [PubMed] [Google Scholar]
- 52. Eizirik DL, Cardozo AK, Cnop M. 2008. The role for endoplasmic reticulum stress in diabetes mellitus. Endocr Rev 29:42–61 [DOI] [PubMed] [Google Scholar]
- 53. Hotamisligil GS. 2006. Inflammation and metabolic disorders. Nature 444:860–867 [DOI] [PubMed] [Google Scholar]
- 54. Hotamisligil GS. 2010. Endoplasmic reticulum stress and the inflammatory basis of metabolic disease. Cell 140:900–917 [DOI] [PMC free article] [PubMed] [Google Scholar]
- 55. Ebenezer PJ, Mariappan N, Elks CM, Haque M, Francis J. 2009. Diet-induced renal changes in Zucker rats are ameliorated by the superoxide dismutase mimetic TEMPOL. Obesity (Silver Spring) 17:1994–2002 [DOI] [PMC free article] [PubMed] [Google Scholar]
- 56. Weisberg SP, Leibel R, Tortoriello DV. 2008. Dietary curcumin significantly improves obesity-associated inflammation and diabetes in mouse models of diabesity. Endocrinology 149:3549–3558 [DOI] [PMC free article] [PubMed] [Google Scholar]
- 57. Shertzer HG, Schneider SN, Kendig EL, Clegg DJ, D'Alessio DA, Genter MB. 2008. Acetaminophen normalizes glucose homeostasis in mouse models for diabetes. Biochem Pharmacol 75:1402–1410 [DOI] [PubMed] [Google Scholar]
- 58. Hoehn KL, Salmon AB, Hohnen-Behrens C, Turner N, Hoy AJ, Maghzal GJ, Stocker R, Van Remmen H, Kraegen EW, Cooney GJ, Richardson AR, James DE. 2009. Insulin resistance is a cellular antioxidant defense mechanism. Proc Natl Acad Sci USA 106:17787–17792 [DOI] [PMC free article] [PubMed] [Google Scholar]
- 59. Ikemura M, Nishikawa M, Hyoudou K, Kobayashi Y, Yamashita F, Hashida M. 2010. Improvement of insulin resistance by removal of systemic hydrogen peroxide by PEGylated catalase in obese mice. Mol Pharm 7:2069–2076 [DOI] [PubMed] [Google Scholar]