Abstract
The advent of gadolinium-based “hepatobiliary” contrast agents offers new opportunities for diagnostic MRI and has triggered a great interest for innovative imaging approaches to the liver and bile ducts. In this review article we will discuss the imaging properties of the two gadolinium-based hepatobiliary contrast agents currently available in the USA, gadobenate dimeglumine and gadoxetic acid, as well as important pharmacokinetic differences that affect their diagnostic performance. We will review potential applications, protocol optimization strategies, as well as diagnostic pitfalls. A variety of illustrative case examples will be used to demonstrate the role of these agents in detection and characterization of liver lesions as well as for imaging the biliary system. Changes in MR protocols geared towards optimizing workflow and imaging quality will also be discussed. It is our aim that the information provided in this article will facilitate the optimal utilization of these agents, and will stimulate the reader‘s pursuit of new applications for future benefit.
Keywords: magnetic resonance imaging, liver, biliary, hepatobiliary gadolinium based contrast agents, gadobenate dimeglumine, gadoxetic acid
1. INTRODUCTION
With its intrinsic soft tissue contrast, magnetic resonance imaging (MRI) is widely regarded to be a highly effective method for liver imaging. In many centers MR has become the clinical reference standard in liver imaging due to its high specificity and superior sensitivity regarding lesion detection and characterization in comparison to computed tomography (CT). To date, there is a large body of literature describing the use of dynamic contrast-enhanced (CE) T1-weighted (T1w) liver imaging during the infusion of extracellular gadolinium-based contrast agents (GBCA). The patterns of contrast enhancement, in combination with other contrast mechanisms (e.g., diffusion weighted imaging, in/opposed phase, T2-weighted (T2w) imaging, etc), provide well-described criteria for detection and characterization of hepatic lesions. During dynamic CE liver imaging, most extracellular GBCA demonstrate very similar vascular and tissue enhancement characteristics. However, most extracellular GBCA lack information specific to the presence and function of hepatocytes. In the context of a comprehensive MRI evaluation the use of heavily T2-weighted MR cholangiopancreaticography (MRCP) provides an excellent non-invasive means to depict and diagnose pathology of the biliary system. Although MRCP effectively depicts morphology and anatomy, it offers no direct functional information of the biliary system.
“Hepatobiliary” contrast agents have the dual properties of GBCAs that diffuse in the extracellular space and are also actively transported into functioning hepatocytes and subsequently excreted into the bile. The pharmacokinetics of hepatobiliary GBCAs offer extended opportunities for liver lesion characterization and functional biliary imaging. Important differences in hepatocellular uptake and biliary excretion (table 1) lead to agent specific enhancement patterns that can yield improved detection and characterization of lesions. In addition, the biliary excretion of these agents facilitates the acquisition of T1-weighted magnetic resonance cholangiograms (T1w MRC). Unlike T2w MRCP, T1w MRC also provides functional information through visualization of biliary excretion over time, in addition to high spatial resolution depiction of biliary anatomy.
Table 1.
Specifications of contrast agents with hepatobiliary properties (gadobenate dimeglumine, gadoxetic acid) in comparison to a widely used extracellular agent (gadopentetate dimeglumine).
| Short chemical name | Gd-BOPTA | Gd-EOB-DTPA | Gd-DTPA |
|---|---|---|---|
| Generic/IUP name (111) | gadobenate dimeglumine |
gadoxetic acid |
gadopentetate dimeglumine |
| Vendor | Bracco Diagnostics | Bayer Healthcare Pharmaceuticals |
Bayer Healthcare Pharmaceuticals |
| Distribution name | MultiHance® | EU: Primovist® US: Eovist® |
Magnevist® |
| Osmolality [mosm/kg H2O] | 1970 | 884 | 1960 |
| Concentration [mol/l] | 0.5 | 0.25 | 0.5 |
| r1/r2 plasma relaxivity 1.5T * | 6.3 (6.0–6.6) 8.7 (7.8–9.6) |
6.9 (6.5–7.3) 8.7 (7.8–9.6) |
4.1 (3.9–4.3) 4.6 (3.8–5.4) |
| r1/r2 plasma relaxivity 3T * | 5.5 (5.2–5.8) 11.0 (10.0–12.0) |
6.2 (5.9–6.5) 11 (10–12) |
3.7 (3.5–3.9) 5.2 (4.3–6.1) |
| Excretion | predominantly renal, 3-5% biliary |
~ 50% renal excretion, ~50% biliary |
renal |
| Typical Dosage | 0.05 - 0.1 mmol/kg 0.1 - 0.2 ml/kg |
0.025-0.05 mmol/kg 0.1 - 0.2 ml/kg |
0.1-0.2 mmol/kg 0.2-0.4 ml/kg |
data according to Rohrer et al. (112)
Currently, there are three FDA-approved MR contrast agents with some degree of hepatocyte uptake and biliary excretion: Mangafodipir trisodium was the first manganese-based hepatobiliary agent introduced in 1997 (Teslascan®, Mn-DPDP, GE Healthcare, Nydalen, Norway). Mangafodipir trisodium shows marked hepatic enhancement and some biliary contrast; however marketing of this product was discontinued in the U.S. in 2005.
In 2004, gadobenate dimeglumine (MultiHance®, Gd-BOPTA, Bracco Diagnostics, Princeton, NJ), received FDA-approval for MR imaging in the U.S. While it is approved for imaging of liver lesions in Europe, hepatobiliary imaging is an off-label use of this agent in the US. Gadobenate dimeglumine is a GBCA with the dual properties of being both an extracellular agent and a hepatobiliary contrast agent. Three to five percent of gadobenate dimeglumine is taken up by functioning hepatocytes and excreted into the bile accounting for its hepatobiliary properties (1-2). Its excellent performance during dynamic phase liver imaging can be attributed to the increased relaxivity compared to other extracellular GBCA’s secondary to weak transient protein binding (3).
More recently, in 2008, gadoxetic acid (U.S.: Eovist®, Europe: Primovist®, Gd-EOB-DTPA, Bayer Healthcare Pharmaceuticals, Wayne, NJ), a GBCA with high uptake (~50%) into hepatocytes and subsequent biliary excretion, was FDA-approved for the detection and characterization of liver lesions in the US, although it does not have an approved indication for biliary imaging. Gadoxetic acid has similar hepatocytic uptake as mangafodipir trisodium. However, gadoxetic acid can be administered as a bolus for dynamic phase imaging and during the earliest phases of contrast administration it has some features akin to an extracellular GBCA. Therefore it is able to show dynamic properties, often best appreciated at higher doses (4).
It is the purpose of this article to review the relevant clinical pharmacokinetics of currently available hepatobiliary GBCAs in order to understand enhancement patterns of the liver and bile ducts. Common clinical applications and findings in examples of hepatobiliary pathology will be demonstrated. We will also discuss MR protocol modification and optimization when using these agents and describe future applications.
2. CLINICAL APPLICATION
2.1. Specific Properties of Hepatobiliary Contrast Agents
The clinically relevant properties of the available hepatobiliary GBCAs are discussed in this section. Pharmacokinetic details of these agents are summarized in table 1.
Mangafodipir trisodium was the first available hepatobiliary agent approved in the US as “an adjunct to MRI in patients to enhance the T1-weighted images used in the detection, localization, characterization, and evaluation of lesions of the liver.” (5) The efficacy for lesion detection, lesion characterization and biliary imaging had been demonstrated (6-9) However, the agent was unable to be administered as a bolus, precluding dynamic imaging and limiting the assessment of vascular structures. Furthermore, problems with manufacturing along with concerns regarding toxicity probably contributed to the eventual withdrawal from the US market in 2005 (10). Therefore, mangafodipir trisodium will not be discussed further in this review.
Gadobenate dimeglumine demonstrates higher relaxivity than other extracellular GBCAs, likely as a result of weak transient albumin binding (3). For this reason, the utility of dynamic phase imaging with gadobenate dimeglumine is widely accepted (11). The approved dose of gadobenate dimeglumine is 0.1mmol/kg, although doses of 0.05-0.1mmol/kg are commonly used (12).
Three to five percent of the dose is taken up by functioning hepatocytes and is subsequently excreted into the bile (13). Hepatobiliary phase imaging of the liver parenchyma and biliary system with gadobenate dimeglumine is typically performed between 45 and 120 minutes after injection and necessary in order to achieve sufficient enhancement (13).
Gadoxetic acid has been marketed as Eovist® in the US since 2008 (Bayer HealthCare Pharmaceuticals Inc., Wayne, NJ) although it was approved as Primovist® in Europe since 2004 (Bayer Schering Pharma, Berlin, Germany). Unlike mangafodipir trisodium, gadoxetic acid offers strong, early intravascular contrast that allows for dynamic phase imaging. Its vascular enhancement is facilitated by protein binding on the order of 11% which leads to increased relaxivities (14). Gadoxetic acid is believed to be actively taken up in hepatocytes by a canalicular multispecific organic anion transporter 8 (OATP 8). Of note, similar transport pathways are believed to exist for gadobenate dimeglumine as well. The subsequent excretion of gadoxetic acid into the bile occurs via the multidrug resistant protein 3 (MRP 3) (15). Experimental data demonstrate that approximately 50% of gadoxetic acid is taken up by hepatocytes and subsequently excreted into biliary canaliculi. Hepatobiliary phase liver imaging shows peak contrast enhancement at 20 minutes with persistent enhancement for more than two hours (16).
The FDA has approved gadoxetic acid at a dose of 0.025mmol/kg, which is considered to be the minimum effective dose for the detection of liver lesions in the hepatobiliary phase. However, in our experience this dose may compromise the dynamic phase enhancement (4). Brismar et al. compared 0.025mmol/kg gadoxetic acid to 0.1mmol/kg gadobenate and showed superiority of vessel-to-liver contrast of gadobenate dimeglumine at (4). Recent studies by Motosugi et al. and Lee et al. confirmed these results (17-18). Increased doses of gadoxetic acid (0.05mmol/kg) and slower injection rates can be used to overcome this limitation (19). In a recent report, Feuerlein et al. confirmed the dose-dependence of gadoxetic acid while injecting 10mL per patient (resulting in an effective dose 0.02-0.06mmol/kg), although the increased enhancement at higher doses did not reach statistical significance (20). Nevertheless, injecting the full 10mL per vial may be a reasonable economical approach.
An additional consideration of employing 0.05mmol/kg dosing is related to the concentration of gadoxetic acid which is one half that of conventional extracellular GBCAs (including gadobenate dimeglumine). Thus, the injection volume of contrast media with a 0.05mmol/kg dose of gadoxetic acid is identical to that of 0.1mmol/kg of conventional extracellular agents, as well as gadobenate dimeglumine. This can reduce complexity for technologists, particularly when multiple agents are being used at the same site. An injection rate of 2mL/s provides diagnostic image quality during the dynamic phase with the 0.05mmol/kg dosing.
2.2 MR Imaging Protocol
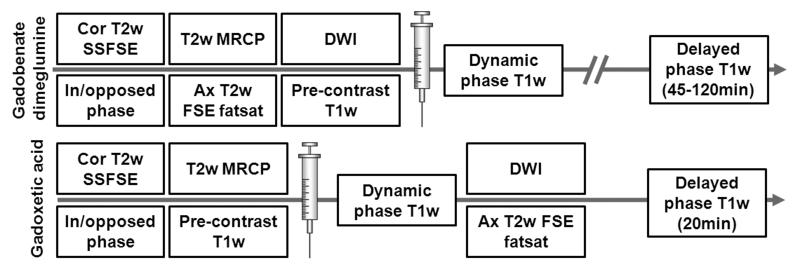
In the following section we will outline a general imaging protocol for hepatobiliary MRI based on the authors’ experience. Details regarding specific protocol settings can be found in table 2. Figure 1 outlines a suggested liver protocol overview for both gadoxetic acid and gadobenate dimeglumine. Please note that the suggested sequences and imaging parameters may vary with clinical applications and scanner vendors.
Table 2. Sequence parameters typically used at the author’s institutions.
Typical sequence parameters used. Settings and sequence names are vendor specific and can vary.
| T2w coronal | 3D T2wMRCP | Axial T2w | Dynamic phases & standard delayed phases |
Hepatobiliary phase high-resolution |
|
|---|---|---|---|---|---|
| Sequence | SSFSE / HASTE / single- shot TSE / FSE |
RARE-based 3D fat-sat |
FSE fat sat | GRE or volume interpolated 3D SPGR (VIBE / LAVA / THRIVE / TIGRE) with spectral-spatial fat-sat |
GRE 3D SPGR spectral-spatial fat-sat |
| Orientation | coronal | coronal | axial | axial | axial |
| Purpose | check for cholestasis, if present, perform MRCP |
cholangiogram | T2w images | dynamic phase imaging dur: fluoroscopic trigger portal venous: ~50sec after arterial peak venous: ~2min after arterial peak |
near-isotropic scan to visualize biliary system at contrast agent-specific delay |
|
| |||||
| TR/TE | 1000/90 | 3750/590 (120) |
15000/94 (ETL 16) |
4/1.9 | 5.4/2.1 |
| FOVx/FOVy | 512 × 512 | 512 × 512 | 512 × 512 (75%) |
512 × 512 (75%) |
400 × 320 |
| Acq Matrix | 352 × 256 | 288 × 288 | 324 × 224 | 256 × 192 | 228 × 224 |
| FA | 90 | 90 | 90 | 12-15 | variable 40-45 gadoxetic acid 25-30 gadobenate dimeglumine |
| Number of signal averages | 0.53 | 1 | 2 | 1 | 1 |
| Slice thickness | 6 | 1.4 | 5 | 5 | 2 |
|
No. of slices
(requirements) |
24 a) as much as possible in a 20-24s breath hold b) cover the entire liver |
112 a) anatomically adapted to cover the biliary tree |
58 a) anatomically adapted to cover the entire liver |
16 a) as much as possible in a 20-24s breath hold b) cover the entire liver |
192 a) as much as possible in a 20-24s breath hold (alternative: navigator- gating) b) cover the entire liver |
| Interslice gap | none | 0.7 | 15% | none | none |
| Receiver bandwidth | ±50kHz | ±50kHz | ±50kHz | ±62.5kHz | ±62.5kHz |
| Applied coil | 8ch phased array | 8ch phased array | 8ch phased array | 8ch phased array | 32ch body phased array |
| True resolution [mm3] | 1.5 × 2.0 × 6.0 | 1.8 × 1.8 × 1.4 | 1.6 × 2.3 × 5.0 | 2.0 × 2.7 × 5.0 | 1.39 × 1.8 × 2.0 |
| Interpolated res. [mm3] | 1.0 × 1.4 × 2.5 | 0.8 × 0.8 × 1.0 | |||
| Breathing | breath hold | respiratory triggered | respiratory triggered | breath hold | breath hold |
| Acceleration techniques | Data-driven or image- based parallel imaging |
Data-driven or image-based parallel imaging |
Data-driven or image-based parallel imaging |
||
Figure 1.
Suggested liver imaging protocol overview for gadoxetic acid (Gd-EOB-DTPA) and gadobenate dimeglumine (Gd-BOPTA). Conventional T2w and DWI imaging can be performed after the administration of gadoxetic acid during the period prior to 20 minute delayed imaging. Note that post-contrast DWI imaging can alter quantitative estimates of the apparent diffusion coefficient (ADC), although has minimal impact on qualitative DWI imaging. Heavily T2w MRCP should always be performed prior to the administration of contrast, particularly gadoxetic acid.
For precontrast imaging, multiplanar T2w fast spin echo localizers are followed by a coronal multislab 2D single shot fast spin echo technique (SSFSE, HASTE, single-shot TSE, FASE) during breath hold. Additional pre-contrast series may include axial in/out-of-phase T1w imaging, diffusion weighted imaging (DWI), and axial T2w fat-saturated spin echo imaging. If imaging is performed with gadoxetic acid, T2w MRCP based on breathing gated 3D single shot fast spin echo sequence is most reliably performed before the injection, although recent data suggests that effective T2W MRCP can be achieved afterwards (21). Gadoxetic acid in the bile, even in very low concentrations shortens the T2 sufficiently to have a detrimental impact on the heavily T2-weighted MRCP images (22). However, conventional T2w imaging of the liver is largely unaffected because the concentration of gadolinium in the liver is relatively low and has minimal impact on image quality (22). In fact, performing T2w imaging in the interval between dynamic phase T1w imaging and the hepatobiliary phase is a useful strategy to reduce total protocol time (23).
Imaging during the dynamic phase can be achieved using a timing bolus, fluoroscopic trigger, or estimating the contrast arrival time. In general we recommend either a timing bolus or fluoroscopic triggering, where a volume placed in the suprarenal abdominal aorta is used to detect the arrival of contrast. When imaging with gadoxetic acid, however, we recommend the use of fluoroscopic triggering, or the use of a timing bolus with a conventional extracellular agent to prevent premature contrast agent uptake by hepatocytes. Dynamic phase imaging with a 3D T1w gradient echo sequence using intermittent spectrally selective inversion of fat for fat suppression (vendor-specific acronyms: VIBE, LAVA, THRIVE, TIGRE) can be repeated during late hepatic arterial (10-15sec after arrival in abdominal aorta), portal venous (approximately 70sec after injection), and equilibrium phase (approximately 2-7min after injection). For gadobenate dimeglumine, we recommend hepatobiliary phase imaging at 90-120 minutes, which requires that the patient return to the scanner for additional T1w imaging of the liver and bile ducts. For gadoxetic acid, hepatobiliary phase imaging can be performed at 20 minutes, while the patient is still on the scanner table for the initial exam. After the 2-7min venous phase, but prior to the 20 minute hepatobiliary phase imaging, T2w fast spin echo imaging and/or DWI can be performed. It should be noted that the presence of gadoxetic acid, as well as other GBCAs may result in a small, but measureable increase in the apparent diffusion coefficient (ADC) of the liver (24), although has minimal impact on qualitative DW imaging of the liver. For quantitative applications, however, it may be preferable to image prior to the administration of contrast.
2.3 Protocol Optimization
Conventional dynamic contrast enhanced imaging uses T1-weighted sequences that are optimized to maximize conspicuity of lesions within the liver when used with extracellular GBCA’s. Typically, flip angles for dynamic imaging range on the order of 10-15°. However, delayed imaging with hepatobiliary agents may result in a tissue gadolinium concentration that is much higher than occurs with extracellular gadolinium contrast agents, because gadolinium is actively transported from the blood into hepatocytes and subsequently into bile where it concentrates and shortens T1 dramatically. In order to maximize the signal-to-noise ratio, lesion-to-liver contrast, and bile-to-liver contrast, changes in imaging parameters must be optimized to maximize the T1 contrast. Recent reports have shown that increasing the flip angle for hepatocyte phase imaging with 0.05mmol/kg gadoxetic acid to approximately 35-45° leads to considerable improvements in SNR and CNR performance (25-26). At 3T, similar improvements in SNR and CNR can be achieved by increasing the flip angle to 20° for the hepatobiliary phase at 90 minutes for 0.01mmol/kg of gadobenate dimeglumine, and to 45° for 20 minute hepatobiliary phase imaging with 0.05mmol/kg of gadoxetic acid (27). Data from some of the authors (A.F., S.B.R.; not published) point towards SNR and CNR increases on the order 30-300% for either contrast agent at 3T. Assessments of the impact of field strength and flip angle on diagnostic accuracy and/or detection rate await further investigation. An increase in SAR when using sequence prescriptions with high flip angles, and short TRs can result in a ‘behind the scenes’ increase in the TR that lengthens the scan time. In those situations, trade-offs between flip angle and TR (and attendant increase in scan time), or the use of 1.5T rather than 3T may have to be considered.
Further improvements in SNR performance and spatial resolution can be obtained by exploiting the fact that the hepatobiliary phase is in a near-equilibrium state. This provides an extended period during which imaging can be performed, facilitating acquisition of high spatial resolution respiratory-triggered or navigator-based free-breathing sequences (25).
2.4 Characterization of Liver Lesions
There is a large and growing body of literature on the characterization of benign and malignant liver lesions with MRI. Specifically, the use of dynamic CE-MRI with extracellular GBCAs is well understood and well described (28-29). This has led to a variety of algorithms to identify and characterize lesions based on enhancement patterns of enhancement, T2w signal, behavior during in phase and opposed phase imaging, diffusion weighted imaging (DWI), and superparamagnetic iron oxides (SPIO) among others.
The value of DWI in the characterization of large lesions is well-established (35-36). However, in smaller lesions (<2cm), there is an ongoing debate of its added value. While for example Coenegrachts et al. and Holzapfel et al. have pointed towards the promise of DWI in small liver lesions (<1cm) (37-38), Shimada and coworkers have added to the discussion by showing an advantage of gadoxetic acid-enhanced liver imaging over DWI (39).
The use of SPIOs has shown particular promise in HCC detection and in the differentiation of regenerative and dysplastic nodules in the cirrhotic liver (30-31). In addition, the combined use of gadolinium enhanced liver imaging with SPIO-based contrast was demonstrated to be highly advantageous (32). However, there are other reports that contradict the usefulness of SPIOs in comparison to gadopentetate dimeglumine-enhanced (33) or gadobenate dimeglumine-enhanced dynamic liver imaging (34).
While algorithms based on lesion appearance are often helpful, we wish to stress that it is essential to understand the underlying histological composition and physiology of lesions. This is particularly important when interpreting images acquired with hepatobiliary contrast agents. A combined understanding of the pharmacokinetics of a contrast agent and how it interacts with the pathophysiology of the lesion is essential for accurate image interpretation. In the following section, we will focus on the contrast enhancement patterns and relate them to the pharmacokinetics of hepatobiliary contrast agents with the pathophysiologic behavior of important and common liver lesions.
2.4.1 Hepatocyte-containing lesions
Both gadobenate dimeglumine and gadoxetic acid have similarities with conventional extracellular GBCAs during the dynamic phase of contrast enhancement. After the dynamic phase, which occurs over the first 2 minutes after injection, normal hepatocytes and lesions containing hepatocytes exhibit a contrast enhancement pattern that depends on: 1) the presence of functioning hepatocytes, 2) vascular supply of the lesion and 3) characteristics of biliary structures within the lesion. The initial hyperintensity of the normal hepatic parenchyma is observed due to the hepatocellular uptake. Normal hepatocytes then demonstrate slow contrast agent excretion into the bile. We refer to this phase as the ’hepatobiliary’ phase (gadoxetic acid: 20-120min; gadobenate dimeglumine: 45-120min) where uptake in the hepatocytes and excretion into the bile have reached a level optimal for imaging both the biliary system and lesions of interest (16,40-41).
2.4.1.1. Benign tumors of hepatocellular origin
Hepatic adenoma (HA) and focal nodular hyperplasia (FNH) are benign lesions of hepatocellular origin, typically occurring in young women. Although the imaging appearance of FNH is quite typical, the appearance of HA can be quite variable making the distinction between these two lesions challenging. Accurate differentiation between these lesions is important because hepatic adenomas, particularly large or subcapsular lesions are often resected due to a significant risk of hemorrhage and the small but documented risk of malignant degeneration (42). Conversely, FNH is a benign lesion that typically requires no intervention. For these reasons, there has been great interest in the use of hepatobiliary GBCAs for improved characterization and differentiation of these two important lesions.
2.4.1.1.1 Focal nodular hyperplasia (FNH)
Focal nodular hyperplasia (FNH) is a benign tumor comprised of normal hepatocytes with abnormal nodular architecture, malformed vessels, and abnormal biliary proliferation (43). FNHs are often noted as incidental findings on US, CT, or MRI and they rarely cause symptoms; in 20-25% of patients that present with FNH, multiple lesions are present. There is a female predominance and established association with oral contraceptives or pregnancy (44-45).
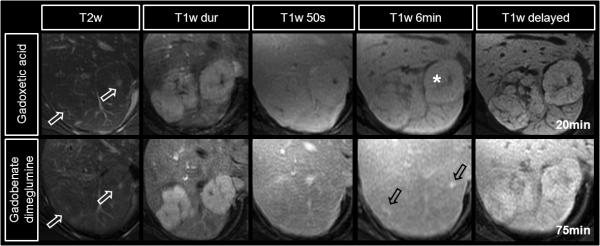
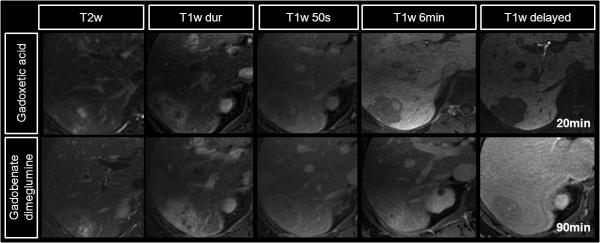
The key features of FNH that are exploited by contrast enhanced imaging include: i) a predominantly hepatic arterial supply, this is the most important feature that is exploited to diagnose FNH during dynamic phase imaging with extracellular GBCA’s, ii) their composition of functioning hepatocytes and iii) the presence of (malformed) biliary structures, two features that are exploited by hepatobiliary GBCAs in the hepatobiliary phase. Figure 2 shows an example of two FNHs imaged with both gadoxetic acid and gadobenate dimeglumine. On pre-contrast T1w imaging (not shown) FNHs are typically isointense. They are also isointense or slightly hyperintense on T2w imaging, occasionally with a hyperintense central scar. FNHs demonstrate intense enhancement during the late arterial phase, resulting from their predominantly hepatic arterial blood supply. They classically equilibrate with the adjacent liver in the portal venous (50s after arterial bolus detection) and 2-7 minute venous phase (figure 2).
Figure 2.
Characteristic enhancement patterns of a FNH using gadoxetic acid (top row) and gadobenate dimeglumine (lower row) in a 37 year-old woman imaged on two different dates. Note the hyperintensity of the scar on T2w images (white open arrows). The intense arterial hyper-enhancement of the FNH is followed by rapid equilibration during the portal venous and early delayed images. Note the hyper-enhancement of the scar on gadobenate dimeglumine 6 minute images (black open arrows) related to the extracellular behavior of gadobenate dimeglumine on this time scale, in comparison the relative hypointensity with gadoxetic acid (*) due to the intense uptake of gadolinium into hepatocytes at this time. The scar finally shows relative hypointensity on delayed images with both agents, while the main lesion is isointense to the adjacent liver parenchyma.
Approximately 63% of FNH, contain a central scar (46). If a central scar is present, the fibrous tissue of the central scar accumulates GBCAs circulating in the blood pool, during the later phases (typically 5-12min). With extracellular agents (and also gadobenate dimeglumine, which behaves like an extracellular GBCA on this time scale), the central scar will appear bright relative to the adjacent lesion. With gadoxetic acid, the central scar also enhances, but the surrounding hepatocytes within the FNH accumulate higher concentrations of gadolinium and the central scar will appear hypointense relative to the enhancing FNH (Figure 2, 6 minutes).
Finally, during the hepatobiliary phase (~ 20 minutes for gadoxetic acid, ~ 45-120 minutes for gadobenate dimeglumine), the combination of functioning hepatocytes and malformed bile ducts leads to an accumulation of gadolinium in the lesion (figure 2). Using gadobenate dimeglumine, Grazioli et al exploited this behavior and showed that FNH appear iso- or hyperintense relative to adjacent liver parenchyma in 42 histologically confirmed FNHs (47). In this study, the authors also demonstrated that hepatic adenomas (see below) appear hypointense relative to liver parenchyma. Using the behavior of gadobenate dimeglumine on hepatobiliary phase imaging, the authors reported an accuracy of 98.3% to differentiate FNH from adenoma.
FNHs appear to exhibit similar behavior using gadoxetic acid in the hepatobiliary phase, although the number of histologically confirmed cases is much lower, with only 16 histologically confirmed cases of FNH (48-49). In all cases, FNHs appeared iso- or hyperintense on hepatobiliary imaging with gadoxetic acid.
2.4.1.1.2 Hepatic adenoma
Hepatic adenomas (HA) are benign hepatic neoplasms of hepatocellular origin. While their etiology remains unknown, a strong association with estrogens has been demonstrated, especially in conditions with excess of hormone exposure such as oral contraceptives and androgenic steroids (42,50). There is also a known association with glycogen storage diseases (types I [van Gierke’s] and III [Cori’s]) which often presents with hepatic adenomatosis (51). The absence of bile ducts within HA is a key feature used by pathologists to differentiate HA from FNH. These HA cells are arranged in plates separated by sinusoids that are perfused primarily by branches of the hepatic artery. The loose connective tissue in HA may explain the propensity for spontaneous hemorrhage seen with HA (52). As a result of the risk of hemorrhage and a small but measurable risk of malignant transformation, particularly with large or exophytic HA, these lesions are more often treated by surgical resection (53).
Like FNH, HA are typically hypervascular lesions detected during the late arterial phase. Unlike FNH, however, their appearance and enhancement patterns are highly variable and it is often difficult to differentiate FNH from HA using extracellular GBCAs and dynamic GBCA-enhanced MR imaging only. The absence of bile ductules is a key histologic feature that helps distinguish HA from FNH. It has also been suggested that the altered cellular structure in HA results in an abnormal cell membrane transport system (47,54). These two features may lead to reduced transport and accumulation of hepatobiliary agents such as gadobenate dimeglumine and gadoxetic acid. This manifests as hypointensity relative to normal liver parenchyma in the hepatobiliary phase. Grazioli exploited this behavior using gadobenate dimeglumine and demonstrated that 11/32 of histologically confirmed HA were isointense and 14/32 hypointense on hepatobiliary imaging (47).
While it seems logical that gadoxetic acid might exhibit similar behavior in HA as gadobenate dimeglumine, the paucity of histologically confirmed HA’s in the literature with only 6 reported cases must be considered (48,55). In addition, lesions in these reports demonstrated both hyper- and hypointensity on hepatobiliary phase imaging. Given these mixed results there is uncertainty regarding the enhancement patterns of hepatic adenomas in the hepatobiliary phase after injection of gadoxetic acid. Therefore, future research is urgently needed to define the behavior of these agents and their additional value for the differentiation of FNH and hepatic adenoma.
2.4.1.2. Malignant tumors of hepatocellular origin
2.4.1.2.1 Hepatocellular carcinoma
Hepatocellular carcinoma (HCC) is a malignant tumor of hepatocellular origin that most commonly occurs in the setting of cirrhosis and chronic viral hepatitis. Definitive treatment of HCC requires liver transplantation but patient suitability has important limitations. According to the Milan criteria (56), patients are ineligible for liver transplantation if they have a single tumor > 5cm, or three tumors > 3 cm, because of the high risk of recurrence from undetected metastases. However, the detection of HCC nodules smaller than 2cm in a cirrhotic liver is often challenging, particularly in the common context of cirrhosis. The cirrhotic liver is entirely replaced with a background plethora of regenerative nodules and bridging fibrosis, masking the detection of small HCC nodules for both dynamic phase CT and MR using extracellular iodinated or gadolinium based contrast agents (57-60). Given the rapid doubling time of HCC, there is a narrow window for detection and surgical intervention and therefore a great unmet need for earlier detection of small HCC.
Currently, hepatitis C is responsible for the vast majority of HCC in most Western countries, followed by non-alcoholic fatty liver disease (NAFLD) and alcohol-related cirrhosis (61). Overall, there has been a shift towards a younger population presenting with HCC (62). This may in part be related to the rising epidemic of NAFLD-related cirrhosis and the resulting development of HCC (63). For these reasons it is expected that the need for accurate non-invasive diagnostic methods to detect HCC will continue to grow (64). Further, increasing concerns over radiation exposure and the nephrotoxicity of iodinated contrast agents used for CT, particularly in young patients, makes high quality MRI the preferred cross-sectional imaging method.
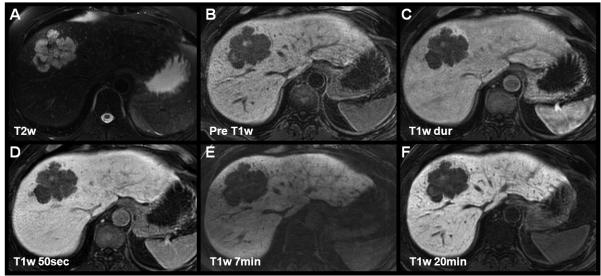
The pre-contrast appearance of HCC consists of variable T1 signal intensity and some degree of T2 hyper-intensity (Figure 4a, Figure 5) (65). HCC is a characteristically hypervascular tumor resulting from neoangiogenesis and a predominantly hepatic arterial blood supply. This hepatic arterial predominance leads to brisk enhancement in the late arterial phase (Figure 4c) followed by relative hypointensity (“washout”) with respect to background liver during the portal venous phase (Figure 4d-f). During the equilibrium phase, the appearance of HCC is typically hypointense, often with an enhancing rim, or “pseudo-capsule”.
Figure 4.
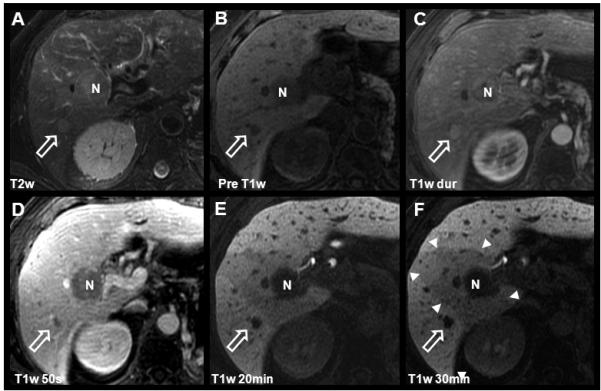
Detection and characterization of HCC using gadoxetic acid. Images from this 68 year-old male with known multifocal HCC include findings after chemotherapy and TACE procedure. Two hypointense lesions are seen on pre-contrast and delayed T1w images (B, E, F): The white open arrow indicates the untreated HCC with characteristic T2w hyperintensity, intense arterial enhancement, and rapid portal venous phase washout. N indicates a necrotic area after radiofrequency ablation (RFA). Note the wedge-shaped perfusion deficit (white arrowheads) associated with a thrombosis of the right portal vein (not shown). Also note the contrast in the biliary tract, on 20 minute post-contrast images (E) using gadoxetic acid as compared to figs. 1 and 3.
Figure 5.
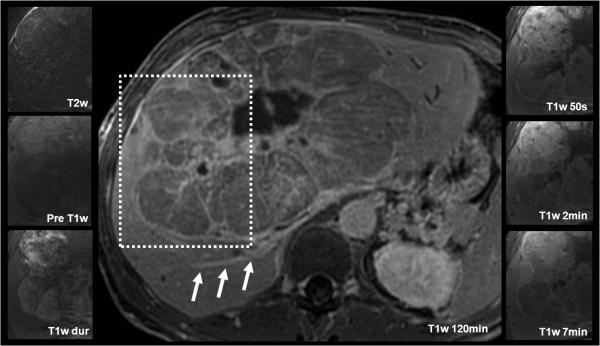
Findings in a rare case of fibrolamellar HCC evaluated with gadobenate dimeglumine in a 42 year-old male with elevated liver function tests and jaundice. This enormous liver tumor demonstrated heterogeneous pre-contrast T2w and T1w signal properties. The solid components of the tumor showed a similar rapid arterial contrast enhancement and portal venous wash-out as the HCC lesion in figure 5. The radial septae with progressive delayed enhancement (E, F) mirror the fibrous components of this tumor. Also note the contrast in the dilated biliary duct in the posterior right lobe on the 120 minute image (white arrows).
Hepatobiliary GBCAs offer exciting new possibilities for contrast-enhanced liver imaging that may improve HCC detection sensitivity and specificity. There are several reports that have investigated the use of hepatobiliary agents for HCC detection (66-67) although these authors did not characterize the incremental information gained by using hepatobiliary imaging. In a multi-center study by Hammerstingl et al. liver imaging with gadoxetic acid resulted in comparable detection rates, lower false positive findings, and a higher rate of detecting small HCC lesions in comparison to CT (gadoxetic acid: 82.1%, CT 71.0%) (68). In a more recent study, Di Martino et al. demonstrated the improved diagnostic accuracy and sensitivity of gadoxetic acid enhanced MRI (0.88 and 0.85, respectively) compared with 64-slice CT (0.74 and 0.69, respectively) for detection of hepatocellular carcinoma.
Although most HCC are hypointense on hepatobiliary phase imaging, great variability of the hepatobiliary phase appearance of HCC using hepatobiliary GBCAs has been described. Depending on the preservation of hepatocellular function and the degree of hepatobiliary agent uptake, different enhancement patterns have been postulated: iso- or hyper-intensity in well differentiated HCC and hypo-intensity in poorly differentiated lesions. Hanna et al. have summarized previous works in stressing the ability of MRI to differentiate benign regenerative nodules from dysplastic nodules and hepatocellular carcinoma. With progressing dedifferentiation, a progressive reduction in uptake of hepatocellular GBCAs can be observed. (30). The precise role of hepatobiliary GBCA for the (histological) grading of HCC, however, continues to be actively pursued (69-70). For example, studies by Saito and Frericks revealed that there is no difference in hepatobiliary phase enhancement of HCCs at varying differentiation levels (71-72). With respect to lesion detection, Kim et al. demonstrated that hepatobiliary imaging with gadoxetic acid has shown a trend towards improved sensitivity for HCC detection although the resulting differences did not reach statistical significance. The patients in this study, however, showed a high prevalence of congenital hepatitis B infection which raises the question whether results of this study are applicable to patients with cirrhosis which is more common in the U.S. and Europe (73). Marin et al. showed that combined dynamic and hepatobiliary phase imaging with gadobenate dimeglumine improved the diagnostic accuracy for the detection of HCC (0.95) in comparison to dynamic MR alone (0.91) or dynamic CT (0.77; for both, p < 0.01)(74).
Therefore, the use of hepatobiliary GBCA for the differentiation of nodules in cirrhotic livers and histological grading of HCCs by means of imaging remains challenging and controversial, but offers great possibilities for improved detection and diagnosis of HCC.
2.4.2 Tumors of non-hepatocellular origin
2.4.2.1 Benign Tumors of non-hepatocellular origin
2.4.2.1.1 Cavernous hemangioma
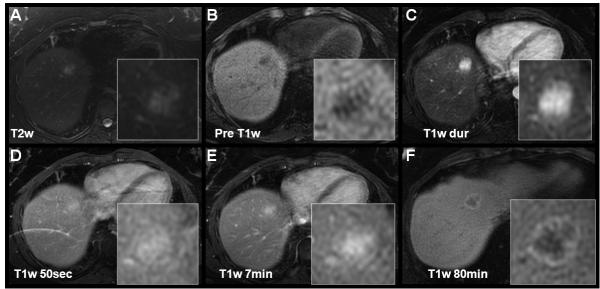
The cavernous hemangioma is the most common benign tumor of the liver (75-77). Its typical contrast enhancement pattern reflects its vascular nature with cavernous, lake-like blood-filled spaces. Imaging characteristics include hyperintensity on T2w images, hypointensity on non-enhanced T1w images, and peripheral nodular, or “puddling” arterial enhancement that progresses centripetally during the dynamic phase of liver enhancement (Figure 6a-b, Figure 7a, c-e) (78-80). After the initial arterial and portal venous phases hemangioma closely follow the signal intensity of the blood pool. Care should be taken with giant hemangiomas, where the centripetally progressing contrast enhancement may be very delayed.
Figure 6.

Gadoxetic acid for the characterization of a cavernous hemangioma. Relative hypointensity on delayed images (C) is caused by the relative hyperenhancement of the liver. Note that the signal intensity of the hemangioma parallels that in the aorta on all T1w contrast enhanced images including the 20 minute delayed image. This finding is contrary to the typical hyperintensity on delayed images using gadobenate dimeglumine (Figure 7), but is easily explained by the known pathophysiology of hemangiomas and the pharmacokinetics of gadoxetic acid. The dynamic phase images (B, arterial phase [dur] only) depict the characteristic contrast enhancement pattern of cavernous hemangiomas with centripetally progressing enhancement.
Figure 7.
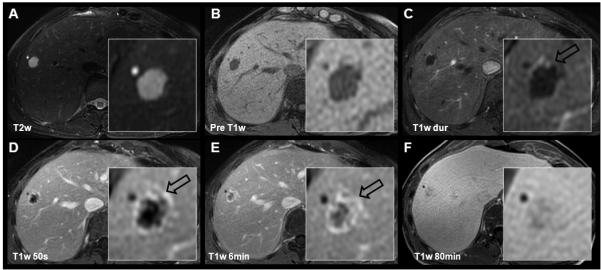
Cavernous hemangioma and simple cyst depicted using gadobenate dimeglumine. 56 year-old female referred to MR with multiple indeterminate lesions and history of uterine cancer. The cyst is easily characterized by its “light bulb” bright appearance on T2w images and lack of enhancement on post-contrast images. The cavernous hemangioma shows slightly lower T2w hyperintensity, and centripetal contrast enhancement (open black arrows). Note near isointensity of the hemangioma on the 80 minute delayed gadobenate dimeglumine images as opposed to relative hypointensity using gadoxetic acid (Figure 6).
These principles are also observed during the dynamic and hepatobiliary phases of hepatobiliary GBCAs. Gadobenate dimeglumine retains its extracellular behavior well beyond 10min (Figure 7f). Therefore, similar to conventional extracellular GBCAs, gadobenate dimeglumine can be used as a blood-pool agent in a 5-7min delayed phase to help characterize hemangiomas. However, gadoxetic acid is more rapidly cleared from the blood and more rapidly taken up into the liver; hence hemangiomas typically appear hypointense relative to the liver in equilibrium phases at 5-7min. It is important to emphasize that for both extracellular and hepatobiliary GBCAs, the hemangioma follows the contrast enhancement of the blood pool. Finally, in the hepatobiliary phase (gadoxetic acid: 20-120min; gadobenate dimeglumine: 45-120min), hemangiomas will appear isointense to the blood and more markedly hypointense to the liver (Figure 6c, Figure 7f). With a combined understanding of the pathophysiology and the pharmacokinetics the contrast enhancement behavior of those lesions can be understood, and pitfalls avoided.
2.4.2.1.2 Cysts
Small intrahepatic cysts are benign in nature and are commonly seen. However, in the presence of indeterminate symptoms such as right upper quadrant pain their characterization and differentiation from pathologic lesions becomes important. Cysts, depending on their composition and content, have sharply delineated borders, and are brightly T2w hyperintense structures (“light-bulb” bright) (Figure 7a). On pre-contrast T1w sequences, they are hypo-intense and do not enhance during the dynamic or delayed post-contrast phase since they neither contain hepatocytes nor vascular structures (Figure 7b-f).
2.4.2.2 Malignant non-hepatocellular tumors
2.4.2.2.1 Cholangiocarcinoma (CC)
Cholangiocarcinomas are uncommon but often aggressive malignant tumors (adenocarcinoma) of the bile ducts. Although the prevalence is highest in Asian countries, cholangiocarcinoma (CC) is also increasing in incidence and mortality in the US and western countries (81). CCs are often associated with primary sclerosing cholangitis (PSC) or choledochal cysts such as those seen in Caroli’s disease. Depending on the location of origin, CC can be classified as extrahepatic (65%), intrahepatic (25%), and hilar (10%), or based on its growth-type as mass-forming, periductal-infiltrating, and intraductal (82). However, there are only limited data on the prognostic importance of such classifications.
Cholangiocarcinomas have a variable T2w signal intensity due to varying degrees of concurrent coagulative necrosis and desmoplastic fibrosis (Figure 8a, Figure 9a). The contrast enhancement pattern of CCs resembles the heterogeneous histological components of the tumor. Using extracellular GBCA, strong arterial enhancement and portal venous washout due to neoangiogenesis, is often observed (Figure 8b-e, Figure 9b-e). Rim-like pseudocapsular enhancement is occasionally noted, resulting from compressed adjacent liver parenchyma and neovascularization. The enhancement of the rim typically follows the enhancement of the blood pool. The fibrous desmoplastic components of CC can also be exploited to assist in diagnosis for CC. Approximately 10-15min after contrast injection, the fibrous components of the tumor demonstrate mild, progressive enhancement. For this reason, CC may appear slightly hyperintense at this phase relative to adjacent liver, when using both extracellular GBCAs and gadobenate dimeglumine (83-84). This behavior is well documented in the CT literature using iodinated contrast agents as well (85-86). This behavior may be helpful to differentiate CC from other malignant tumors such as metastases.
Figure 8.
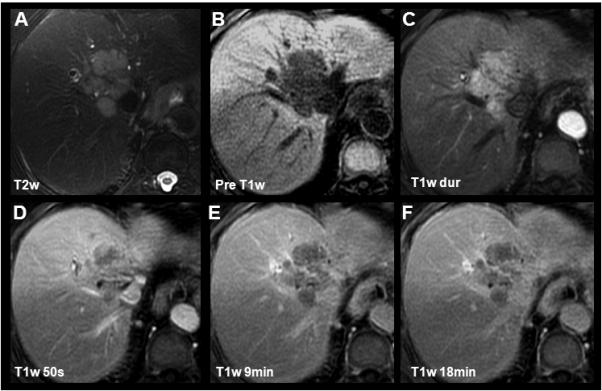
Characterization of a cholangiocarcinoma using gadobenate dimeglumine. In this 80yo female an intrahepatic CC with characteristic pre-contrast imaging findings, rapid T1w contrast enhancement and portal venous washout was depicted. Slight capsular enhancement can be appreciated (D) consistent with either compressed neovasculature or fibrous tissue. Of special note is the isointensity of the CC in the delayed phase (18min, F) compared to the relative hypointensity when imaging with gadoxetic acid (Figure 9).
Figure 9.
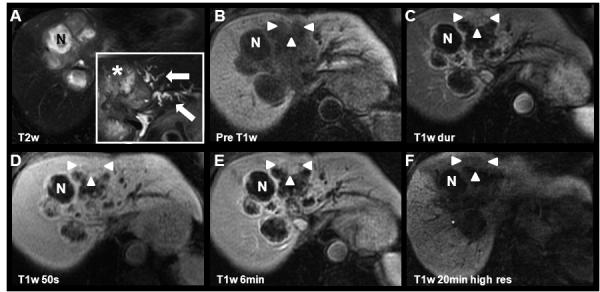
Large necrotic cholangiocarcinoma depicted using gadoxetic acid. Findings in this 81yo female show the 6-month progression of the disease (same patient as that shown in Figure 8) with marked dilation of left lobar biliary ducts (white arrows, insert in A). The viable portions of the CC (white arrowheads) demonstrate the characteristic enhancement pattern. The central tumor necrosis (N) has progressed (increased T2w signal in A) and there is progressive peripheral enhancement of fibrous components. Importantly, the CC shows relative hypointensity to liver tissue on delayed images (F). Note that there is no excretion in the left biliary ducts at 20min high-resolution images, probably due to biliary obstruction. Please also note the subtle geographical hypointensity in the vicinity of the tumor at 20min, most likely due to segmental portal vein thromboses (not shown).
When imaging CC with gadoxetic acid, however, there is significant and relative intense uptake of contrast into normal liver parenchyma during the 10-15min period. Therefore, with gadoxetic acid, the relative hyperintensity of CC seen with extracellular GBCAs is reversed; the mild hyperintensity of the fibrous component of CC is overwhelmed by the much greater uptake in the surrounding liver parenchyma (Figure 8f vs. Figure 9f). Further, the excretion of contrast into bile ducts may be helpful for the evaluation of intraductal CC and tumor-related stenoses, as well as the patency of adjacent bile ducts (see Biliary Imaging below). The reader is cautioned to be aware of mixed cell, consisting of both HCC and CC, in anticipation of complex and not well described behavior with hepatobiliary agents (87).
2.4.2.2.2 Metastatic disease
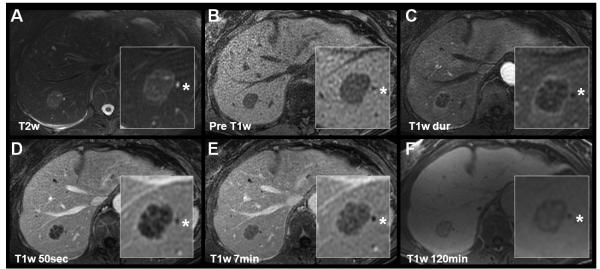
During the workup of metastatic disease, contrast-enhanced MR liver imaging is often performed when previous imaging with ultrasound or CT remains unclear, during staging, or follow-up after treatment. Both extracellular and hepatobiliary GBCAs demonstrate similar enhancement of metastases during dynamic phase imaging, typically with peripheral rim enhancement and a lack of central enhancement when central tumor necrosis is present. However, during the hepatobiliary phase, progressive contrast agent uptake by hepatocytes, but not by cells of metastatic lesions, provides stark contrast between liver and metastatic disease, with metastases appearing as hypointense lesions (Figures 10-12). A rim enhancement (88) or target sign (89) in the hepatobiliary phase has been described and can be observed in some types of metastases (Figure 10c-e, Figure 11f). Importantly, other lesions of non-hepatocyte origin (e.g., hemangioma, cysts) show hypointensity during the hepatobiliary phase (Figure 7). Therefore, while the detection of hypointense lesions on hepatobiliary phase imaging provides an excellent method to screen for metastatic disease, the use of other sequences, particular T2w imaging, DWI, and dynamic phase imaging is essential for characterization and improving diagnostic specificity.
Figure 10.
Metastatic disease imaged with gadoxetic acid in a 73 year old female with known rectal carcinoma. Typical enhancement patterns of a hypo-vascular metastasis can be appreciated: slight hyper-intensity on T2w images, marked hypointensity on T1w pre contrast, peripherally dominant and slow central enhancement leading to the previously described ‘target sign’ with marked hyperintensity on the 120min hepatobiliary phase. A small cyst (*) is also noted, adjacent to the lesion of interest.
Figure 12.
Characteristic hypointense appearance of metastases using gadoxetic acid in a 53 year-old male with a metastatic sacral chordoma. Although a rare metastasis to the liver, some metastases, such as the chordoma, maintain the signal properties of the original tumor. In this chordoma metastasis, the lobulated T2w hyperintense appearance and the lack of contrast enhancement is similar to other metastatic lesions to the liver.
Figure 11.
Enhancement patterns of breast cancer metastasis using gadobenate dimeglumine in a 43 year-old female. Characteristic hyperintensity on T2w images and hypointensity of metastases is seen on pre-contrast T1w and delayed phase. Owing to hypervascularity, the metastasis follows the enhancement pattern of the blood pool.
Accurate detection and staging of metastases are critical to staging and treatment planning. This is particularly important for metastatic colon adenocarcinoma, because locoregional therapy, including resection, can provide meaningful survival benefit in patients with a limited number of lesions. Early reports using extracellular GBCAs showed mixed results comparing the performance of CT and MR with only a slight advantage of MR over CT (90-93). However, recent literature has demonstrated superior performance of gadoxetic acid-enhanced MR over CT for metastasis detection (94). Overall, there is relative sparse data on the impact of hepatobiliary agents and hepatobiliary imaging for evaluation of metastases. The works by Hammerstingl et al. (68) and Bluemke et al. (66) have shown promising but preliminary results for detection of liver lesions. In a small number of cases, Vogl et al have shown a CNR superiority of gadoxetic acid over gadopentetate dimeglumine (95); similarly, Caudana showed an increased CNR of gadobenate dimeglumine on delayed GRE images in comparison to non-enhanced and enhanced SE imaging in 13 metastases (96). In 2004, Kim et al. showed an improved tumor-to-liver contrast using gadobenate dimeglumine in the hepatobiliary phase that led to a detection of more metastases than with dynamic imaging alone. They also described a ‘target sign’ appearance with a central hyperenhancement and hypointense rim that was typical in their series of metastases (89). The etiology of this finding was hypothesized to be linked to differences in the type of primary malignancy but remains to be explained.
In summary, hepatobiliary phase imaging offers the opportunity to increase the sensitivity in the detection of metastases, by exploiting the liver-lesion contrast generated by the avid uptake of gadolinium into the background liver parenchyma. While it is widely believed that the sensitivity for detection of metastatic disease with hepatobiliary GBCAs is high, the specificity of metastasis characterization remains to be determined. Specifically, the ability to differentiate metastases from benign lesions such as cysts and hemangiomas (that all appear hypointense on hepatobiliary phase images) requires a comprehensive MRI evaluation.
2.5 Biliary Imaging
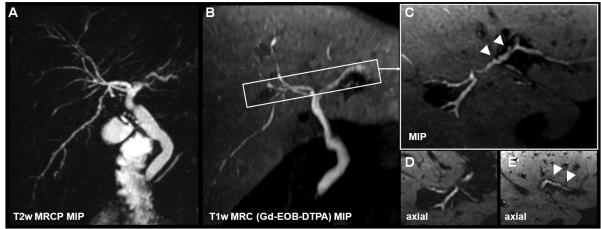
MR cholangiopancreatography (MRCP) is widely considered the noninvasive reference standard for imaging evaluation of the biliary system. T2w MRCP offers high-resolution depiction of biliary morphology; however, it contains no functional information. As an alternative, hepatobiliary contrast agents offer the opportunity to image both the morphology of the biliary system and also provide functional information provided by excretion of gadolinium into the bile (97-98) (Figure 13), in the same manner that biliary scintigraphic agents can, but with much higher spatial resolution and a lack of ionizing radiation. This mechanism leads to enhancement of the biliary tree using gadobenate dimeglumine at 45-120 min and using gadoxetic acid at 20-60 min for T1w MR cholangiography (T1w MRC).
Figure 13.
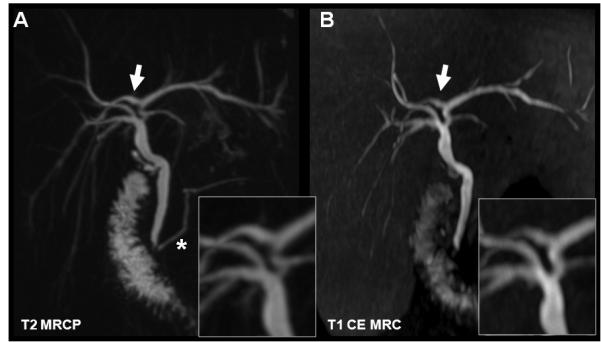
T1w MR cholangiography using gadobenate dimeglumine (B) in comparison to T2w MRCP (A). Both techniques demonstrate the right posterior duct branching into the left hepatic biliary duct (white arrow). In this 30yo female with cholecystectomy, T1w MRC proves the patency of the anastomosis by contrast passage to the duodenum. (*) indicates the pancreatic duct which cannot be visualized with hepatobiliary GBCA. Both methods provide anatomical information, while the T1w MRC also provides functional information demonstrating the patency of the sphincter of Oddi.
Evaluation of biliary anatomy and detection of normal variants (Figure 13) can be of value in the preoperative evaluation of living liver donors. Normal variants of the biliary ducts such as the anomalous confluence of the right posterior duct into the left hepatic duct, among others, are commonly encountered (99). Although there are sparse data on the impact of biliary tract variants on the outcome of surgery, detailed a priori knowledge of the biliary anatomy can help to avoid potentially devastating complications from inadvertent biliary transection during lobar harvest (100). In addition, functional assessment of biliary excretion may be very helpful for the evaluation of biliary obstruction and stenoses, e.g. by tumor, stones, strictures in sclerosing cholangitis (PSC, Figure 14 and 15), post-surgical anastomosis, in the detection of traumatic or post-surgical bile leaks (Figure 16), and differentiation of cysts from choledochal cysts. To date, there is a paucity of studies directly comparing T2w MRCP and gadolinium-enhanced T1w MRC (98,101-102). Early studies suggest that both techniques are complementary, i.e., the combination of both techniques is superior to either method alone (103-104).
Figure 14.
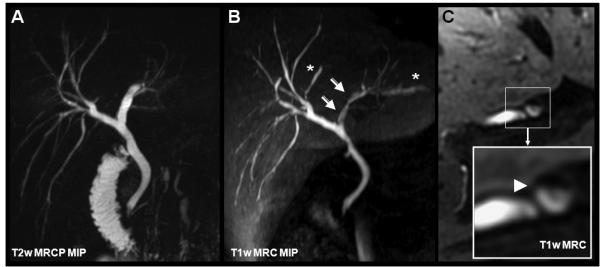
Gadoxetic acid for T1w MRC in a 35-year-old male with ulcerative colitis. Subtle, alternating strictures and beading are with both T2w MRCP (A) and T1w MRC (B). Note the apparent stenosis in B (open white arrows) that is caused by layering of contrast in the dilated duct (see cross-sectional magnifications in C). Asterisks indicate slightly dilated bile ducts not seen by T2w MRCP due to incomplete coverage by the limited slab thickness of the MRCP.
Figure 15.
Beaded appearance of the biliary tract imaged with gadoxetic acid in a 44yo male with known primary sclerosing cholangitis (PSC). Although the high liver signal limits the ability to fully appreciate MIP representations of the bile ducts in the same manner as MRCP, the axial detail allows for identification of biliary duct irregularities PSC with exquisite detail.
Figure 16.
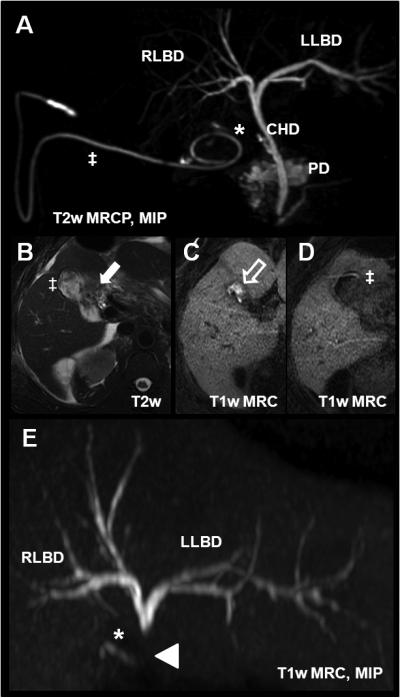
Bile leak in a 53 year-old after laparoscopic cholecystectomy using gadoxetic acid. (A) T2w MRCP with the cystic duct remnant (*) and a surgical drainage pigtail catheter (‡) placed in the gallbladder fossa. Axial T2w imaging (B) shows postsurgical fluid collection in the fossa (white arrow). 30min after injection of gadoxetic acid, there is contrast agent accumulation in the fossa (white open arrow, C). (D) shows contrast within the pigtail catheter (‡). The T1w MRC MIP in (E) demonstrated an abrupt termination of the contrast column in the common duct superior to the level at which the contrast leaks entirely into the gall bladder fossa and subsequently into the pigtail drainage catheter. This example demonstrates the advantage of the functional information that can be obtained using hepatobiliary agents. CHD = common hepatic duct; PD = pancreatic duct; RLBD and LLBD = right and left biliary duct, respectively.
The time course of excretion of hepatobiliary GBCAs may also offer important functional information in liver failure, liver injury, or in obstructive cholestasis. It has been suggested that the level of obstruction of bile ducts can be determined by the delay of contrast agent passage peripheral to strictures. However, such attempts are of a qualitative nature only and have not been rigorously evaluated for quantitative assessment of cholestasis (105). Nevertheless, the inherent functional information in biliary excretion of gadolinium-based hepatobiliary agents may prove useful. In the experience of the authors, biliary dilatation and cholestasis may lead to an unpredictable decrease, delay, or total lack of contrast excretion into the biliary tract. Such decrease or lack of enhancement may confound attempts at morphological assessment; yet the absence of enhancement carries helpful information on the functional status of the biliary system. In summary, T1w MRC in combination with T2w MRCP for morphology appears to be a synergistic combination.
To the best of our knowledge, there are no definitive data published on the impact of compromised biliary excretion resulting from the severity of biliary stenoses, the presence of severe cholestasis, or liver failure. Tschirch et al. demonstrated that there is reduced biliary excretion of gadoxetic acid in cirrhotic patients when total serum bilirubin levels ≥ 1.8mg/dL (normal 5.1-17μmol/L) in their patients. In addition, patients with a MELD score ≥ 11 were shown to have insufficient biliary tree visualization up to 30 minutes after injection (106). For these reasons, the package insert of gadoxetic acid reports that reduced uptake and excretion of this agent may occur when bilirubin levels exceed 3mg/dL. Indeed, some sites screen patients for elevated bilirubin and use extracellular GBCAs when the bilirubin exceeds this threshold. At our institution we do not screen for elevated bilirubin levels because both gadoxetic acid and gadobenate dimeglumine are good agents for dynamic phase imaging, which will be unaffected by increased bilirubin levels. Choices for contrast agents may also be impacted by cost considerations, however. Furthermore, the decreased excretion in the hepatobiliary phase may contain useful qualitative information, and in some patients may be the first indication of biliary obstruction or cholestasis. Although additional studies on the relationship of serum bilirubin to decreased excretion are needed, it remains unclear whether guidelines would alter the clinical use of hepatobiliary GBCAs unless the hepatobiliary phase was of sole importance.
Finally, it should be noted that differences in density between bile and gadolinium can cause layering of contrast (Figure 14), leading to the potential pitfall of a pseudo-stenoses or apparent filling defect. In light of potential pitfalls, it is important to recognize this behavior of hepatobiliary GBCAs in order to avoid incorrect diagnosis of biliary abnormalities.
2.5.2 Cholangitis and biliary strictures
MRI, particularly T2w MRCP, is a well-established method for non-invasive evaluation of inflammatory diseases of the bile ducts, i.e., cholangitis. Cholangitis can have multiple causes, such as primary sclerosing cholangitis (PSC), ischemic cholangitis, HIV/AIDS related infectious cholangitis, and recurrent pyogenic cholangitis, etc. High-resolution non-invasive T2w MRCP is routinely used for screening patients at risk of or with known PSC. Biliary strictures, severity and progression, and characterization of important complications, such as a dominant stricture, intraductal stones, or cholangiocarcinoma can routinely be achieved using MRCP. While T2w MRCP offers excellent and comprehensive morphological imaging, it does not provide functional information (107-109). T1w MRC with hepatobiliary GBCAs offers the unique opportunity to perform simultaneous functional and morphological imaging. It is also intriguing to speculate the potential for using the excretory phase of hepatobiliary agents in PSC, wherein the ability to localize dominant strictures could be accompanied by an improved ability to detect cholangiocarcinoma – an opportunity for further study. A complementary role of T1w MRC and T2w MRCP has been recently demonstrated in several studies (76,78,79,81) (Figure 13).
2.5.3 Other biliary diseases / conditions
Functional information is of particularly interest for the detection of surgical complications such as bile leaks (Figure 16) or traumatic liver lacerations. In distinction to nuclear medicine hepatobiliary agents, the higher resolution afforded by MRI hepatobiliary imaging offers greater opportunity to determine the origin of a bile leak (Figure 16). Although scientific data on the effect of T1w MRC in these conditions is sparse and largely anecdotal (110), the simultaneous acquisition of functional and morphologic data can be very useful in certain situations. For example in our experience the patency of choledocho-jejunostomy can be demonstrated with serial T1w MRC imaging by directly observing the passage of bile from the liver through the biliary system into the duodenum. T1w MRC may reduce or obviate the use of direct cholangiography or endoscopic retrograde cholangiography (ERC) and it may be more sensitive as compared to T2w MRCP, particularly when there is ascites or residual fluid in the operative field. Effectively, T1w MRC provides the same functional information as hepatobiliary nuclear scintigraphic imaging while offering superior spatial resolution and freedom from ionizing radiation.
In conclusion, we summarized the mechanisms, potential applications, advantages, and potential pitfalls of hepatobiliary contrast agents. Available hepatobiliary GBCAs show the dual properties of extracellular GBCAs during the dynamic phase of contrast enhancement and differ by their active uptake in the hepatocytes and subsequent excretion to the bile. The resulting hepatic contrast mechanisms offer advantages for the identification and characterization of different liver lesions as well as functional information regarding the presence and distribution of functioning hepatocytes. These advantages were discussed in detail to guide the interpreting physician and to avoid potential pitfalls, especially those associated with diagnostic algorithms. We have reviewed various clinical applications and demonstrated the utility of these agents through selected, illustrative case examples. In addition, the biliary excretion of hepatobiliary GBCAs offers the simultaneous morphological and dynamic diagnosis of the biliary system. Applications exploiting simultaneous morphological and functional biliary imaging that is, in our experience, complementary to T2w MRCP have been demonstrated. Future research is warranted to further assess the perceived advantages of both agents for hepatobiliary imaging as opposed to dynamic phase imaging or T2W MRCP alone. Finally, the necessity to modify MR protocols, e.g. by adapting acquisition times and flip angles, has been described.
Figure 3.
Characterization of a hepatic adenoma using gadoxetic acid (Gd-EOB-DTPA, top row) and gadobenate dimeglumine (Gd-BOPTA, lower row) in a 51 year-old woman presenting for follow-up of liver lesions. Multiple hepatic adenomas were found. Slight hyperintensities in precontrast T2w are non-specific. Arterial and portal venous enhacement, lack of a central scar, and delayed hypointensity help to differentiate the hepatic adenoma from a FNH. Note the marked, relative hypointensity of the adenoma using gadoxetic during the specific hepatobiliary phase as opposed gadobenate dimeglumine mirroring the pharmacocinetics of both agents. At 6 minutes, gadobenate dimeglumine still shows slight hyperintensity, and the delayed phase is iso- to hypointense.
Acknowledgments
Grant support: NIH grant RC1 EB010384 partially supported the results shown in this work.
Footnotes
Disclosures: A.F. received an educational stipend from Bracco Diagnostics. E.M.M. is a consultant to Bayer Healthcare and member of the speaker’s bureau. M.G.L., S.K.N., J. J. B., and N.M.R. have no disclosures. S.B.R. has a family member that is an employee of GE Healthcare. The Department of Radiology, University of Wisconsin – Madison receives unrestricted research support from GE Healthcare.
REFERENCES
- 1.de Haen C, Lorusso V, Tirone P. Hepatic transport of gadobenate dimeglumine in TR-rats. Acad Radiol. 1996;3(Suppl 2):S452–454. doi: 10.1016/s1076-6332(96)80614-3. [DOI] [PubMed] [Google Scholar]
- 2.Spinazzi A, Lorusso V, Pirovano G, Kirchin M. Safety, tolerance, biodistribution, and MR imaging enhancement of the liver with gadobenate dimeglumine: results of clinical pharmacologic and pilot imaging studies in nonpatient and patient volunteers. Acad Radiol. 1999;6(5):282–291. doi: 10.1016/s1076-6332(99)80451-6. [DOI] [PubMed] [Google Scholar]
- 3.Cavagna FM, Maggioni F, Castelli PM, et al. Gadolinium chelates with weak binding to serum proteins. A new class of high-efficiency, general purpose contrast agents for magnetic resonance imaging. Invest Radiol. 1997;32(12):780–796. doi: 10.1097/00004424-199712000-00009. [DOI] [PubMed] [Google Scholar]
- 4.Brismar TB, Dahlstrom N, Edsborg N, Persson A, Smedby O, Albiin N. Liver vessel enhancement by Gd-BOPTA and Gd-EOB-DTPA: a comparison in healthy volunteers. Acta Radiol. 2009;50(7):709–715. doi: 10.1080/02841850903055603. [DOI] [PubMed] [Google Scholar]
- 5.Package Insert. Teslascan (Mangafodipir trisodium)
- 6.Rofsky NM, Weinreb JC, Bernardino ME, Young SW, Lee JK, Noz ME. Hepatocellular tumors: characterization with Mn-DPDP-enhanced MR imaging. Radiology. 1993;188(1):53–59. doi: 10.1148/radiology.188.1.8390072. [DOI] [PubMed] [Google Scholar]
- 7.Murakami T, Baron RL, Peterson MS, et al. Hepatocellular carcinoma: MR imaging with mangafodipir trisodium (Mn-DPDP) Radiology. 1996;200(1):69–77. doi: 10.1148/radiology.200.1.8657947. [DOI] [PubMed] [Google Scholar]
- 8.Lee VS, Rofsky NM, Morgan GR, et al. Volumetric mangafodipir trisodium-enhanced cholangiography to define intrahepatic biliary anatomy. AJR Am J Roentgenol. 2001;176(4):906–908. doi: 10.2214/ajr.176.4.1760906. [DOI] [PubMed] [Google Scholar]
- 9.Sahani DV, Kalva SP, Fischman AJ, et al. Detection of liver metastases from adenocarcinoma of the colon and pancreas: comparison of mangafodipir trisodium-enhanced liver MRI and whole-body FDG PET. AJR Am J Roentgenol. 2005;185(1):239–246. doi: 10.2214/ajr.185.1.01850239. [DOI] [PubMed] [Google Scholar]
- 10.Finley JW. Manganese absorption and retention by young women is associated with serum ferritin concentration. Am J Clin Nutr. 1999;70(1):37–43. doi: 10.1093/ajcn/70.1.37. [DOI] [PubMed] [Google Scholar]
- 11.Pirovano G, Vanzulli A, Marti-Bonmati L, et al. Evaluation of the accuracy of gadobenate dimeglumine-enhanced MR imaging in the detection and characterization of focal liver lesions. AJR Am J Roentgenol. 2000;175(4):1111–1120. doi: 10.2214/ajr.175.4.1751111. [DOI] [PubMed] [Google Scholar]
- 12.Schneider G, Maas R, Kool L Schultze, et al. Low-dose gadobenate dimeglumine versus standard dose gadopentetate dimeglumine for contrast-enhanced magnetic resonance imaging of the liver: an intra-individual crossover comparison. Invest Radiol. 2003;38(2):85–94. doi: 10.1097/00004424-200302000-00003. [DOI] [PubMed] [Google Scholar]
- 13.Kirchin MA, Pirovano GP, Spinazzi A. Gadobenate dimeglumine (Gd-BOPTA). An overview. Invest Radiol. 1998;33(11):798–809. doi: 10.1097/00004424-199811000-00003. [DOI] [PubMed] [Google Scholar]
- 14.Weinmann HJ, Schuhmann-Giampieri G, Schmitt-Willich H, Vogler H, Frenzel T, Gries H. A new lipophilic gadolinium chelate as a tissue-specific contrast medium for MRI. Magn Reson Med. 1991;22(2):233–237. doi: 10.1002/mrm.1910220214. discussion 242. [DOI] [PubMed] [Google Scholar]
- 15.Kitao A, Zen Y, Matsui O, et al. Hepatocellular carcinoma: signal intensity at gadoxetic acid-enhanced MR Imaging--correlation with molecular transporters and histopathologic features. Radiology. 2010;256(3):817–826. doi: 10.1148/radiol.10092214. [DOI] [PubMed] [Google Scholar]
- 16.Hamm B, Staks T, Muhler A, et al. Phase I clinical evaluation of Gd-EOB-DTPA as a hepatobiliary MR contrast agent: safety, pharmacokinetics, and MR imaging. Radiology. 1995;195(3):785–792. doi: 10.1148/radiology.195.3.7754011. [DOI] [PubMed] [Google Scholar]
- 17.Motosugi U, Ichikawa T, Sano K, et al. Double-Dose Gadoxetic Acid-Enhanced Magnetic Resonance Imaging in Patients With Chronic Liver Disease. Invest Radiol. 2010;46(2):141–145. doi: 10.1097/RLI.0b013e3181f9c487. [DOI] [PubMed] [Google Scholar]
- 18.Lee MS, Lee JY, Kim SH, et al. Gadoxetic acid disodium-enhanced magnetic resonance imaging for biliary and vascular evaluations in preoperative living liver donors: Comparison with gadobenate dimeglumine-enhanced MRI. J Magn Reson Imaging. 2011;33(1):149–159. doi: 10.1002/jmri.22429. [DOI] [PubMed] [Google Scholar]
- 19.Zech CJ, Vos B, Nordell A, et al. Vascular enhancement in early dynamic liver MR imaging in an animal model: comparison of two injection regimen and two different doses Gd-EOB-DTPA (gadoxetic acid) with standard Gd-DTPA. Invest Radiol. 2009;44(6):305–310. doi: 10.1097/rli.0b013e3181a24512. [DOI] [PubMed] [Google Scholar]
- 20.Feuerlein S, Boll DT, Gupta RT, Ringe KI, Marin D, Merkle EM. Gadoxetate disodium-enhanced hepatic MRI: dose-dependent contrast dynamics of hepatic parenchyma and portal vein. AJR Am J Roentgenol. 2011;196(1):W18–24. doi: 10.2214/AJR.10.4387. [DOI] [PubMed] [Google Scholar]
- 21.Kim KA, Kim MJ, Park MS, et al. Optimal T2-weighted MR cholangiopancreatographic images can be obtained after administration of gadoxetic acid. Radiology. 2010;256(2):475–484. doi: 10.1148/radiol.10091774. [DOI] [PubMed] [Google Scholar]
- 22.Ringe KI, Gupta RT, Brady CM, et al. Respiratory-triggered three-dimensional T2-weighted MR cholangiography after injection of gadoxetate disodium: is it still reliable? Radiology. 2010;255(2):451–458. doi: 10.1148/radiol.10091130. [DOI] [PubMed] [Google Scholar]
- 23.Wei J, Pedrosa I, Rofsky NM, Wouden J, Khosa F, Boparai D. Streamlining Hepatobiliary MR Contrast Protocols: Feasibility of T2-weighted Imaging after the Administration of Gd-EOB-DTPA. RSNA; Chicago: 2009. pp. SSG08–06. [Google Scholar]
- 24.Choi JS, Kim MJ, Choi JY, Park MS, Lim JS, Kim KW. Diffusion-weighted MR imaging of liver on 3.0-Tesla system: effect of intravenous administration of gadoxetic acid disodium. Eur Radiol. 2010;20(5):1052–1060. doi: 10.1007/s00330-009-1651-8. [DOI] [PubMed] [Google Scholar]
- 25.Nagle SN, Busse RF, Brau AC, et al. High-Resolution Free-Breathing 3D T1 Weighted Hepatobiliary Imaging Optimized for Gd-EOB-DTPA. Proceedings of the Intl Soc Magn Reson Med. 2009;17:2076. [Google Scholar]
- 26.Bashir MR, Merkle EM. Improved liver lesion conspicuity by increasing the flip angle during hepatocyte phase MR imaging. Eur Radiol. 2010;21(2):291–294. doi: 10.1007/s00330-010-1917-1. [DOI] [PubMed] [Google Scholar]
- 27.Frydrychowicz A, Nagle SN, D’Souza SL, Vigen KK, Reeder SB. Optimized High-Resolution Contrast-Enhanced Hepatobiliary Imaging at 3T: A Cross-over Comparison of Gadobenate Dimeglumine and Gadoxetic Acid. JMRI. 2011 doi: 10.1002/jmri.22713. in press. [DOI] [PMC free article] [PubMed] [Google Scholar]
- 28.Do RK, Rusinek H, Taouli B. Dynamic contrast-enhanced MR imaging of the liver: current status and future directions. Magn Reson Imaging Clin N Am. 2009;17(2):339–349. doi: 10.1016/j.mric.2009.01.009. [DOI] [PubMed] [Google Scholar]
- 29.Low RN. Abdominal MRI advances in the detection of liver tumours and characterisation. Lancet Oncol. 2007;8(6):525–535. doi: 10.1016/S1470-2045(07)70170-5. [DOI] [PubMed] [Google Scholar]
- 30.Hanna RF, Aguirre DA, Kased N, Emery SC, Peterson MR, Sirlin CB. Cirrhosis-associated hepatocellular nodules: correlation of histopathologic and MR imaging features. Radiographics. 2008;28(3):747–769. doi: 10.1148/rg.283055108. [DOI] [PubMed] [Google Scholar]
- 31.Hussain SM, Reinhold C, Mitchell DG. Cirrhosis and lesion characterization at MR imaging. Radiographics. 2009;29(6):1637–1652. doi: 10.1148/rg.296095508. [DOI] [PubMed] [Google Scholar]
- 32.Ward J, Guthrie JA, Scott DJ, et al. Hepatocellular carcinoma in the cirrhotic liver: double-contrast MR imaging for diagnosis. Radiology. 2000;216(1):154–162. doi: 10.1148/radiology.216.1.r00jl24154. [DOI] [PubMed] [Google Scholar]
- 33.Tang Y, Yamashita Y, Arakawa A, et al. Detection of hepatocellular carcinoma arising in cirrhotic livers: comparison of gadolinium- and ferumoxides-enhanced MR imaging. AJR Am J Roentgenol. 1999;172(6):1547–1554. doi: 10.2214/ajr.172.6.10350287. [DOI] [PubMed] [Google Scholar]
- 34.Kim YK, Kim CS, Kwak HS, Lee JM. Three-dimensional dynamic liver MR imaging using sensitivity encoding for detection of hepatocellular carcinomas: comparison with superparamagnetic iron oxide-enhanced mr imaging. J Magn Reson Imaging. 2004;20(5):826–837. doi: 10.1002/jmri.20188. [DOI] [PubMed] [Google Scholar]
- 35.Taouli B, Koh DM. Diffusion-weighted MR imaging of the liver. Radiology. 2010;254(1):47–66. doi: 10.1148/radiol.09090021. [DOI] [PubMed] [Google Scholar]
- 36.Taouli B, Vilgrain V, Dumont E, Daire JL, Fan B, Menu Y. Evaluation of liver diffusion isotropy and characterization of focal hepatic lesions with two single-shot echo-planar MR imaging sequences: prospective study in 66 patients. Radiology. 2003;226(1):71–78. doi: 10.1148/radiol.2261011904. [DOI] [PubMed] [Google Scholar]
- 37.Coenegrachts K, Delanote J, Ter Beek L, et al. Improved focal liver lesion detection: comparison of single-shot diffusion-weighted echoplanar and single-shot T2 weighted turbo spin echo techniques. Br J Radiol. 2007;80(955):524–531. doi: 10.1259/bjr/33156643. [DOI] [PubMed] [Google Scholar]
- 38.Holzapfel K, Bruegel M, Eiber M, et al. Characterization of small (</=10 mm) focal liver lesions: value of respiratory-triggered echo-planar diffusion-weighted MR imaging. Eur J Radiol. 2010;76(1):89–95. doi: 10.1016/j.ejrad.2009.05.014. [DOI] [PubMed] [Google Scholar]
- 39.Shimada K, Isoda H, Hirokawa Y, Arizono S, Shibata T, Togashi K. Comparison of gadolinium-EOB-DTPA-enhanced and diffusion-weighted liver MRI for detection of small hepatic metastases. Eur Radiol. 2010;20(11):2690–2698. doi: 10.1007/s00330-010-1842-3. [DOI] [PubMed] [Google Scholar]
- 40.Bollow M, Taupitz M, Hamm B, Staks T, Wolf KJ, Weinmann HJ. Gadolinium-ethoxybenzyl-DTPA as a hepatobiliary contrast agent for use in MR cholangiography: results of an in vivo phase-I clinical evaluation. Eur Radiol. 1997;7(1):126–132. doi: 10.1007/s003300050125. [DOI] [PubMed] [Google Scholar]
- 41.Dahlstrom N, Persson A, Albiin N, Smedby O, Brismar TB. Contrast-enhanced magnetic resonance cholangiography with Gd-BOPTA and Gd-EOB-DTPA in healthy subjects. Acta Radiol. 2007;48(4):362–368. doi: 10.1080/02841850701196922. [DOI] [PubMed] [Google Scholar]
- 42.Goldfarb S. Sex hormones and hepatic neoplasia. Cancer Res. 1976;36(7 PT 2):2584–2588. [PubMed] [Google Scholar]
- 43.Terminology of nodular hepatocellular lesions. International Working Party. Hepatology. 1995;22(3):983–993. doi: 10.1016/0270-9139(95)90324-0. [DOI] [PubMed] [Google Scholar]
- 44.Weimann A, Mossinger M, Fronhoff K, Nadalin S, Raab R. Pregnancy in women with observed focal nodular hyperplasia of the liver. Lancet. 1998;351(9111):1251–1252. doi: 10.1016/S0140-6736(05)79318-1. [DOI] [PubMed] [Google Scholar]
- 45.Mathieu D, Kobeiter H, Cherqui D, Rahmouni A, Dhumeaux D. Oral contraceptive intake in women with focal nodular hyperplasia of the liver. Lancet. 1998;352(9141):1679–1680. doi: 10.1016/S0140-6736(05)61451-1. [DOI] [PubMed] [Google Scholar]
- 46.Nguyen BN, Flejou JF, Terris B, Belghiti J, Degott C. Focal nodular hyperplasia of the liver: a comprehensive pathologic study of 305 lesions and recognition of new histologic forms. Am J Surg Pathol. 1999;23(12):1441–1454. doi: 10.1097/00000478-199912000-00001. [DOI] [PubMed] [Google Scholar]
- 47.Grazioli L, Morana G, Kirchin MA, Schneider G. Accurate differentiation of focal nodular hyperplasia from hepatic adenoma at gadobenate dimeglumine-enhanced MR imaging: prospective study. Radiology. 2005;236(1):166–177. doi: 10.1148/radiol.2361040338. [DOI] [PubMed] [Google Scholar]
- 48.Huppertz A, Haraida S, Kraus A, et al. Enhancement of focal liver lesions at gadoxetic acid-enhanced MR imaging: correlation with histopathologic findings and spiral CT--initial observations. Radiology. 2005;234(2):468–478. doi: 10.1148/radiol.2342040278. [DOI] [PubMed] [Google Scholar]
- 49.Zech CJ, Grazioli L, Breuer J, Reiser MF, Schoenberg SO. Diagnostic performance and description of morphological features of focal nodular hyperplasia in Gd-EOB-DTPA-enhanced liver magnetic resonance imaging: results of a multicenter trial. Invest Radiol. 2008;43(7):504–511. doi: 10.1097/RLI.0b013e3181705cd1. [DOI] [PubMed] [Google Scholar]
- 50.Soe KL, Soe M, Gluud C. Liver pathology associated with the use of anabolic-androgenic steroids. Liver. 1992;12(2):73–79. doi: 10.1111/j.1600-0676.1992.tb00560.x. [DOI] [PubMed] [Google Scholar]
- 51.Labrune P, Trioche P, Duvaltier I, Chevalier P, Odievre M. Hepatocellular adenomas in glycogen storage disease type I and III: a series of 43 patients and review of the literature. J Pediatr Gastroenterol Nutr. 1997;24(3):276–279. doi: 10.1097/00005176-199703000-00008. [DOI] [PubMed] [Google Scholar]
- 52.Grazioli L, Federle MP, Brancatelli G, Ichikawa T, Olivetti L, Blachar A. Hepatic adenomas: imaging and pathologic findings. Radiographics. 2001;21(4):877–892. doi: 10.1148/radiographics.21.4.g01jl04877. discussion 892-874. [DOI] [PubMed] [Google Scholar]
- 53.Micchelli ST, Vivekanandan P, Boitnott JK, Pawlik TM, Choti MA, Torbenson M. Malignant transformation of hepatic adenomas. Mod Pathol. 2008;21(4):491–497. doi: 10.1038/modpathol.2008.8. [DOI] [PubMed] [Google Scholar]
- 54.Vander Borght S, Libbrecht L, Blokzijl H, et al. Diagnostic and pathogenetic implications of the expression of hepatic transporters in focal lesions occurring in normal liver. J Pathol. 2005;207(4):471–482. doi: 10.1002/path.1852. [DOI] [PubMed] [Google Scholar]
- 55.Giovanoli O, Heim M, Terracciano L, Bongartz G, Ledermann HP. MRI of hepatic adenomatosis: initial observations with gadoxetic acid contrast agent in three patients. AJR Am J Roentgenol. 2008;190(5):W290–293. doi: 10.2214/AJR.07.3198. [DOI] [PubMed] [Google Scholar]
- 56.Mazzaferro V, Regalia E, Doci R, et al. Liver transplantation for the treatment of small hepatocellular carcinomas in patients with cirrhosis. N Engl J Med. 1996;334(11):693–699. doi: 10.1056/NEJM199603143341104. [DOI] [PubMed] [Google Scholar]
- 57.Krinsky GA, Lee VS, Theise ND, et al. Transplantation for hepatocellular carcinoma and cirrhosis: sensitivity of magnetic resonance imaging. Liver Transpl. 2002;8(12):1156–1164. doi: 10.1053/jlts.2002.35670. [DOI] [PubMed] [Google Scholar]
- 58.Krinsky GA, Lee VS, Theise ND, et al. Hepatocellular carcinoma and dysplastic nodules in patients with cirrhosis: prospective diagnosis with MR imaging and explantation correlation. Radiology. 2001;219(2):445–454. doi: 10.1148/radiology.219.2.r01ma40445. [DOI] [PubMed] [Google Scholar]
- 59.Lim JH, Kim CK, Lee WJ, et al. Detection of hepatocellular carcinomas and dysplastic nodules in cirrhotic livers: accuracy of helical CT in transplant patients. AJR Am J Roentgenol. 2000;175(3):693–698. doi: 10.2214/ajr.175.3.1750693. [DOI] [PubMed] [Google Scholar]
- 60.Peterson MS, Baron RL, Marsh JW, Jr., Oliver JH, 3rd, Confer SR, Hunt LE. Pretransplantation surveillance for possible hepatocellular carcinoma in patients with cirrhosis: epidemiology and CT-based tumor detection rate in 430 cases with surgical pathologic correlation. Radiology. 2000;217(3):743–749. doi: 10.1148/radiology.217.3.r00dc28743. [DOI] [PubMed] [Google Scholar]
- 61.Llovet JM, Burroughs A, Bruix J. Hepatocellular carcinoma. Lancet. 2003;362(9399):1907–1917. doi: 10.1016/S0140-6736(03)14964-1. [DOI] [PubMed] [Google Scholar]
- 62.El-Serag HB, Mason AC. Rising incidence of hepatocellular carcinoma in the United States. N Engl J Med. 1999;340(10):745–750. doi: 10.1056/NEJM199903113401001. [DOI] [PubMed] [Google Scholar]
- 63.Marrero JA, Fontana RJ, Su GL, Conjeevaram HS, Emick DM, Lok AS. NAFLD may be a common underlying liver disease in patients with hepatocellular carcinoma in the United States. Hepatology. 2002;36(6):1349–1354. doi: 10.1053/jhep.2002.36939. [DOI] [PubMed] [Google Scholar]
- 64.Bugianesi E, Leone N, Vanni E, et al. Expanding the natural history of nonalcoholic steatohepatitis: from cryptogenic cirrhosis to hepatocellular carcinoma. Gastroenterology. 2002;123(1):134–140. doi: 10.1053/gast.2002.34168. [DOI] [PubMed] [Google Scholar]
- 65.Kelekis NL, Semelka RC, Worawattanakul S, et al. Hepatocellular carcinoma in North America: a multiinstitutional study of appearance on T1-weighted, T2-weighted, and serial gadolinium-enhanced gradient-echo images. AJR Am J Roentgenol. 1998;170(4):1005–1013. doi: 10.2214/ajr.170.4.9530051. [DOI] [PubMed] [Google Scholar]
- 66.Bluemke DA, Sahani D, Amendola M, et al. Efficacy and safety of MR imaging with liver-specific contrast agent: U.S. multicenter phase III study. Radiology. 2005;237(1):89–98. doi: 10.1148/radiol.2371031842. [DOI] [PubMed] [Google Scholar]
- 67.Raman SS, Leary C, Bluemke DA, et al. Improved characterization of focal liver lesions with liver-specific gadoxetic acid disodium-enhanced magnetic resonance imaging: a multicenter phase 3 clinical trial. J Comput Assist Tomogr. 2010;34(2):163–172. doi: 10.1097/RCT.0b013e3181c89d87. [DOI] [PMC free article] [PubMed] [Google Scholar]
- 68.Hammerstingl R, Huppertz A, Breuer J, et al. Diagnostic efficacy of gadoxetic acid (Primovist)-enhanced MRI and spiral CT for a therapeutic strategy: comparison with intraoperative and histopathologic findings in focal liver lesions. Eur Radiol. 2008;18(3):457–467. doi: 10.1007/s00330-007-0716-9. [DOI] [PubMed] [Google Scholar]
- 69.Willatt JM, Hussain HK, Adusumilli S, Marrero JA. MR Imaging of hepatocellular carcinoma in the cirrhotic liver: challenges and controversies. Radiology. 2008;247(2):311–330. doi: 10.1148/radiol.2472061331. [DOI] [PubMed] [Google Scholar]
- 70.Seale MK, Catalano OA, Saini S, Hahn PF, Sahani DV. Hepatobiliary-specific MR contrast agents: role in imaging the liver and biliary tree. Radiographics. 2009;29(6):1725–1748. doi: 10.1148/rg.296095515. [DOI] [PubMed] [Google Scholar]
- 71.Saito K, Kotake F, Ito N, et al. Gd-EOB-DTPA enhanced MRI for hepatocellular carcinoma: quantitative evaluation of tumor enhancement in hepatobiliary phase. Magn Reson Med Sci. 2005;4(1):1–9. doi: 10.2463/mrms.4.1. [DOI] [PubMed] [Google Scholar]
- 72.Frericks BB, Loddenkemper C, Huppertz A, et al. Qualitative and quantitative evaluation of hepatocellular carcinoma and cirrhotic liver enhancement using Gd-EOB-DTPA. AJR Am J Roentgenol. 2009;193(4):1053–1060. doi: 10.2214/AJR.08.1946. [DOI] [PubMed] [Google Scholar]
- 73.Kim SH, Lee J, Kim MJ, et al. Gadoxetic acid-enhanced MRI versus triple-phase MDCT for the preoperative detection of hepatocellular carcinoma. AJR Am J Roentgenol. 2009;192(6):1675–1681. doi: 10.2214/AJR.08.1262. [DOI] [PubMed] [Google Scholar]
- 74.Marin D, Di Martino M, Guerrisi A, et al. Hepatocellular carcinoma in patients with cirrhosis: qualitative comparison of gadobenate dimeglumine-enhanced MR imaging and multiphasic 64-section CT. Radiology. 2009;251(1):85–95. doi: 10.1148/radiol.2511080400. [DOI] [PubMed] [Google Scholar]
- 75.Ochsner JL, Halpert B. Cavernous hemangioma of the liver. Surgery. 1958;43(4):577–582. [PubMed] [Google Scholar]
- 76.Feldman M. Hemangioma of the liver; special reference to its association with cysts of the liver and pancreas. Am J Clin Pathol. 1958;29(2):160–162. doi: 10.1093/ajcp/29.2.160. [DOI] [PubMed] [Google Scholar]
- 77.Karhunen PJ. Benign hepatic tumours and tumour like conditions in men. J Clin Pathol. 1986;39(2):183–188. doi: 10.1136/jcp.39.2.183. [DOI] [PMC free article] [PubMed] [Google Scholar]
- 78.Kim T, Federle MP, Baron RL, Peterson MS, Kawamori Y. Discrimination of small hepatic hemangiomas from hypervascular malignant tumors smaller than 3 cm with three-phase helical CT. Radiology. 2001;219(3):699–706. doi: 10.1148/radiology.219.3.r01jn45699. [DOI] [PubMed] [Google Scholar]
- 79.Quinn SF, Benjamin GG. Hepatic cavernous hemangiomas: simple diagnostic sign with dynamic bolus CT. Radiology. 1992;182(2):545–548. doi: 10.1148/radiology.182.2.1732978. [DOI] [PubMed] [Google Scholar]
- 80.Semelka RC, Brown ED, Ascher SM, et al. Hepatic hemangiomas: a multi-institutional study of appearance on T2-weighted and serial gadolinium-enhanced gradient-echo MR images. Radiology. 1994;192(2):401–406. doi: 10.1148/radiology.192.2.8029404. [DOI] [PubMed] [Google Scholar]
- 81.Shaib Y, El-Serag HB. The epidemiology of cholangiocarcinoma. Semin Liver Dis. 2004;24(2):115–125. doi: 10.1055/s-2004-828889. [DOI] [PubMed] [Google Scholar]
- 82.Lim JH. Cholangiocarcinoma: morphologic classification according to growth pattern and imaging findings. AJR Am J Roentgenol. 2003;181(3):819–827. doi: 10.2214/ajr.181.3.1810819. [DOI] [PubMed] [Google Scholar]
- 83.Maetani Y, Itoh K, Watanabe C, et al. MR imaging of intrahepatic cholangiocarcinoma with pathologic correlation. AJR Am J Roentgenol. 2001;176(6):1499–1507. doi: 10.2214/ajr.176.6.1761499. [DOI] [PubMed] [Google Scholar]
- 84.Fan ZM, Yamashita Y, Harada M, et al. Intrahepatic cholangiocarcinoma: spin-echo and contrast-enhanced dynamic MR imaging. AJR Am J Roentgenol. 1993;161(2):313–317. doi: 10.2214/ajr.161.2.8392787. [DOI] [PubMed] [Google Scholar]
- 85.Ros PR, Buck JL, Goodman ZD, Ros AM, Olmsted WW. Intrahepatic cholangiocarcinoma: radiologic-pathologic correlation. Radiology. 1988;167(3):689–693. doi: 10.1148/radiology.167.3.2834769. [DOI] [PubMed] [Google Scholar]
- 86.Lacomis JM, Baron RL, Oliver JH, 3rd, Nalesnik MA, Federle MP. Cholangiocarcinoma: delayed CT contrast enhancement patterns. Radiology. 1997;203(1):98–104. doi: 10.1148/radiology.203.1.9122423. [DOI] [PubMed] [Google Scholar]
- 87.Jarnagin WR, Weber S, Tickoo SK, et al. Combined hepatocellular and cholangiocarcinoma: demographic, clinical, and prognostic factors. Cancer. 2002;94(7):2040–2046. doi: 10.1002/cncr.10392. [DOI] [PubMed] [Google Scholar]
- 88.Petersein J, Spinazzi A, Giovagnoni A, et al. Focal liver lesions: evaluation of the efficacy of gadobenate dimeglumine in MR imaging--a multicenter phase III clinical study. Radiology. 2000;215(3):727–736. doi: 10.1148/radiology.215.3.r00jn14727. [DOI] [PubMed] [Google Scholar]
- 89.Kim YK, Lee JM, Kim CS. Gadobenate dimeglumine-enhanced liver MR imaging: value of dynamic and delayed imaging for the characterization and detection of focal liver lesions. Eur Radiol. 2004;14(1):5–13. doi: 10.1007/s00330-003-2115-1. [DOI] [PubMed] [Google Scholar]
- 90.Semelka RC, Martin DR, Balci C, Lance T. Focal liver lesions: comparison of dual-phase CT and multisequence multiplanar MR imaging including dynamic gadolinium enhancement. J Magn Reson Imaging. 2001;13(3):397–401. doi: 10.1002/jmri.1057. [DOI] [PubMed] [Google Scholar]
- 91.Semelka RC, Cance WG, Marcos HB, Mauro MA. Liver metastases: comparison of current MR techniques and spiral CT during arterial portography for detection in 20 surgically staged cases. Radiology. 1999;213(1):86–91. doi: 10.1148/radiology.213.1.r99oc3386. [DOI] [PubMed] [Google Scholar]
- 92.Vassiliades VG, Foley WD, Alarcon J, et al. Hepatic metastases: CT versus MR imaging at 1.5T. Gastrointest Radiol. 1991;16(2):159–163. doi: 10.1007/BF01887334. [DOI] [PubMed] [Google Scholar]
- 93.Heiken JP, Lee JK, Glazer HS, Ling D. Hepatic metastases studied with MR and CT. Radiology. 1985;156(2):423–427. doi: 10.1148/radiology.156.2.4011905. [DOI] [PubMed] [Google Scholar]
- 94.Ichikawa T, Saito K, Yoshioka N, et al. Detection and characterization of focal liver lesions: a Japanese phase III, multicenter comparison between gadoxetic acid disodium-enhanced magnetic resonance imaging and contrast-enhanced computed tomography predominantly in patients with hepatocellular carcinoma and chronic liver disease. Invest Radiol. 2010;45(3):133–141. doi: 10.1097/RLI.0b013e3181caea5b. [DOI] [PubMed] [Google Scholar]
- 95.Vogl TJ, Kummel S, Hammerstingl R, et al. Liver tumors: comparison of MR imaging with Gd-EOB-DTPA and Gd-DTPA. Radiology. 1996;200(1):59–67. doi: 10.1148/radiology.200.1.8657946. [DOI] [PubMed] [Google Scholar]
- 96.Caudana R, Morana G, Pirovano GP, et al. Focal malignant hepatic lesions: MR imaging enhanced with gadolinium benzyloxypropionictetra-acetate (BOPTA)--preliminary results of phase II clinical application. Radiology. 1996;199(2):513–520. doi: 10.1148/radiology.199.2.8668804. [DOI] [PubMed] [Google Scholar]
- 97.Fayad LM, Kamel IR, Mitchell DG, Bluemke DA. Functional MR cholangiography: diagnosis of functional abnormalities of the gallbladder and biliary tree. AJR Am J Roentgenol. 2005;184(5):1563–1571. doi: 10.2214/ajr.184.5.01841563. [DOI] [PubMed] [Google Scholar]
- 98.Ergen FB, Akata D, Sarikaya B, et al. Visualization of the biliary tract using gadobenate dimeglumine: preliminary findings. J Comput Assist Tomogr. 2008;32(1):54–60. doi: 10.1097/RCT.0b013e3180616b87. [DOI] [PubMed] [Google Scholar]
- 99.Sahani D, D’Souza R, Kadavigere R, et al. Evaluation of living liver transplant donors: method for precise anatomic definition by using a dedicated contrast-enhanced MR imaging protocol. Radiographics. 2004;24(4):957–967. doi: 10.1148/rg.244035186. [DOI] [PubMed] [Google Scholar]
- 100.Radtke A, Sgourakis G, Sotiropoulos GC, et al. Vascular and biliary anatomy of the right hilar window: its impact on recipient morbidity and mortality for right graft live donor liver transplantation. World J Surg. 2009;33(9):1941–1951. doi: 10.1007/s00268-009-0128-x. [DOI] [PubMed] [Google Scholar]
- 101.An SK, Lee JM, Suh KS, et al. Gadobenate dimeglumine-enhanced liver MRI as the sole preoperative imaging technique: a prospective study of living liver donors. AJR Am J Roentgenol. 2006;187(5):1223–1233. doi: 10.2214/AJR.05.0584. [DOI] [PubMed] [Google Scholar]
- 102.Lim JS, Kim MJ, Kim JH, et al. Preoperative MRI of potential living-donor-related liver transplantation using a single dose of gadobenate dimeglumine. AJR Am J Roentgenol. 2005;185(2):424–431. doi: 10.2214/ajr.185.2.01850424. [DOI] [PubMed] [Google Scholar]
- 103.Carlos RC, Hussain HK, Song JH, Francis IR. Gadolinium-ethoxybenzyl-diethylenetriamine pentaacetic acid as an intrabiliary contrast agent: preliminary assessment. AJR Am J Roentgenol. 2002;179(1):87–92. doi: 10.2214/ajr.179.1.1790087. [DOI] [PubMed] [Google Scholar]
- 104.Jedynak AR, Kelcz F, Frydrychowicz A, Nagle SN, Reeder SB. Clinical Experience with Gadoxetate-Enhanced T1 Weighted Hepatobiliary Imaging in Primary Sclerosing Cholangitis. Proc Intl Soc Magn Reson Med. 2010;18:2620. [Google Scholar]
- 105.Lee NK, Kim S, Lee JW, et al. Biliary MR imaging with Gd-EOB-DTPA and its clinical applications. Radiographics. 2009;29(6):1707–1724. doi: 10.1148/rg.296095501. [DOI] [PubMed] [Google Scholar]
- 106.Tschirch FT, Struwe A, Petrowsky H, Kakales I, Marincek B, Weishaupt D. Contrast-enhanced MR cholangiography with Gd-EOB-DTPA in patients with liver cirrhosis: visualization of the biliary ducts in comparison with patients with normal liver parenchyma. Eur Radiol. 2008;18(8):1577–1586. doi: 10.1007/s00330-008-0929-6. [DOI] [PubMed] [Google Scholar]
- 107.Fulcher AS, Turner MA, Franklin KJ, et al. Primary sclerosing cholangitis: evaluation with MR cholangiography-a case-control study. Radiology. 2000;215(1):71–80. doi: 10.1148/radiology.215.1.r00ap2671. [DOI] [PubMed] [Google Scholar]
- 108.Textor HJ, Flacke S, Pauleit D, et al. Three-dimensional magnetic resonance cholangiopancreatography with respiratory triggering in the diagnosis of primary sclerosing cholangitis: comparison with endoscopic retrograde cholangiography. Endoscopy. 2002;34(12):984–990. doi: 10.1055/s-2002-35830. [DOI] [PubMed] [Google Scholar]
- 109.Vitellas KM, El-Dieb A, Vaswani KK, et al. MR cholangiopancreatography in patients with primary sclerosing cholangitis: interobserver variability and comparison with endoscopic retrograde cholangiopancreatography. AJR Am J Roentgenol. 2002;179(2):399–407. doi: 10.2214/ajr.179.2.1790399. [DOI] [PubMed] [Google Scholar]
- 110.Marin D, Bova V, Agnello F, Youngblood R, Midiri M, Brancatelli G. Gadoxetate disodium-enhanced magnetic resonance cholangiography for the noninvasive detection of an active bile duct leak after laparoscopic cholecystectomy. J Comput Assist Tomogr. 2010;34(2):213–216. doi: 10.1097/RCT.0b013e3181c1a72c. [DOI] [PubMed] [Google Scholar]
- 111.Mitchell DG. MR imaging contrast agents--what’s in a name? J Magn Reson Imaging. 1997;7(1):1–4. doi: 10.1002/jmri.1880070102. [DOI] [PubMed] [Google Scholar]
- 112.Rohrer M, Bauer H, Mintorovitch J, Requardt M, Weinmann HJ. Comparison of magnetic properties of MRI contrast media solutions at different magnetic field strengths. Invest Radiol. 2005;40(11):715–724. doi: 10.1097/01.rli.0000184756.66360.d3. [DOI] [PubMed] [Google Scholar]


