Background: Fibroblast-like synoviocytes participate in the pathogenesis of rheumatoid arthritis.
Results: KCa1.1 is the major potassium channel on fibroblast-like synoviocytes from patients with rheumatoid arthritis, and blocking KCa1.1 channels perturbs the function of these cells.
Conclusion: KCa1.1 channels play important regulatory roles in the function of fibroblast-like synoviocytes from patients with rheumatoid arthritis.
Significance: KCa1.1 channel are potential new therapeutic targets for rheumatoid arthritis.
Keywords: Arthritis, Autoimmune Diseases, Cell Invasion, Patch Clamp Electrophysiology, Potassium Channels, Synoviocyte
Abstract
Fibroblast-like synoviocytes (FLS) play important roles in the pathogenesis of rheumatoid arthritis (RA). Potassium channels have regulatory roles in many cell functions. We have identified the calcium- and voltage-gated KCa1.1 channel (BK, Maxi-K, Slo1, KCNMA1) as the major potassium channel expressed at the plasma membrane of FLS isolated from patients with RA (RA-FLS). We further show that blocking this channel perturbs the calcium homeostasis of the cells and inhibits the proliferation, production of VEGF, IL-8, and pro-MMP-2, and migration and invasion of RA-FLS. Our findings indicate a regulatory role of KCa1.1 channels in RA-FLS function and suggest this channel as a potential target for the treatment of RA.
Introduction
Rheumatoid arthritis (RA)3 is a chronic inflammatory disease that preferentially affects diarthrodial joints and commonly leads to progressive cartilage and bone destruction. The etiology of RA remains incompletely understood, but basic mechanisms of disease include the activation of endothelial and synovial cells and the recruitment and activation of inflammatory cells into the synovial tissue. The inflammatory and hyperplastic synovial tissue (pannus) invades and destroys the adjoining cartilage and bone (1, 2).
Fibroblast-like synoviocytes (FLS) are prominent in the RA pannus (3–6). FLS isolated from patients with RA (RA-FLS) induce the accumulation and survival of inflammatory cells in the joint by producing cytokines, chemokines, and lipid mediators of inflammation and by directly interacting with macrophages and T and B lymphocytes. RA-FLS also produce a wide range of growth factors (such as VEGF and IL-8) that cause angiogenesis in the synovium, another hallmark of RA. In addition, RA-FLS produce matrix metalloproteinases (MMPs) that degrade collagen and are highly invasive and capable of spreading RA from affected to healthy joints (3, 7, 8). The in vitro invasive properties of FLS correlate with radiographic and histological damage in RA and its rodent models (9, 10). In addition, erosive damage to bone and cartilage correlates with disease severity and increased risk for disability, deformities, and reduced life expectancy (6). Furthermore, RA-FLS maintain their activated phenotype and the ability to destroy cartilage even in the presence of reduced inflammation (11). Therefore, understanding the regulation of the activated, invasive, and destructive behavior of RA-FLS has the potential to identify new targets for treatments aimed at reducing pannus formation, immune infiltrates, and angiogenesis, and protecting bone and cartilage from erosive damage, and therefore presents multiple potential benefits in the treatment of RA.
Potassium channels are the largest and most diverse group of ion channels, represented by 78 genes found in the human genome (12). Functional channels are formed by tetramers of α subunits that can be associated to regulatory β subunits to form an even higher diversity of functional channels. These channels have a restricted tissue distribution and can be modulated by selective channel blockers and openers, making them attractive therapeutic targets.
Here, we have identified KCa1.1 channels (BK, Maxi-K, Slo-1, and KCNMA1) as being responsible for the majority of K+ current at the plasma membrane of RA-FLS. We demonstrate that blocking KCa1.1 channels perturbs calcium homeostasis and inhibits the proliferation, invasion, and production of VEGF, IL-8, and pro-MMP-2 by RA-FLS. Our findings suggest that KCa1.1 channels play a major role in the pathogenic functions of RA-FLS. These channels therefore represent potential targets for the treatment of RA.
EXPERIMENTAL PROCEDURES
Cells
RA-FLS from 12 patients with RA (supplemental Table S1), defined according to the criteria of the American College of Rheumatology (13, 14), were purchased from Asterand (Detroit, MI) or collected as described (15, 16) after approval from the appropriate Institutional Review Boards. FLS were cultured in DMEM (Invitrogen) supplemented with 10 IU/ml penicillin, 0.1 μg/ml streptomycin, 2 mg/ml l-glutamine, and 10% FBS and were used between passages 3 and 8 for all experiments. HEK 293 cells were purchased from the ATCC (Manassas, VA). HEK 293 cells stably transfected with the KCa1.1 channel α subunit were a gift from Dr. Heike Wulff (University of California, Davis) and were cultured in DMEM medium+10% FBS+0.5 mg/ml G418 (EMD Chemicals, Gibbstown, NJ).
RT-PCR
Total RNA, isolated using TRIzol (Invitrogen), was reverse transcribed with Superscript II reverse transcriptase and random hexamer primers (Invitrogen). The resulting cDNA was used as a template for PCR with the following primers: for the KCa1.1 channel α subunit, 5′-ACAACATCTCCCCCAACC-3′ (forward) and 5′-TCATCACCTTCTTTCCAATTC-3′ (reverse), which yield a 310-bp product; for GAPDH, 5′-CGATGCTGGGCGTGAGTAC-3′ (forward) and 5′-CGTTCAGCTCAGGGATGACC-3′ (reverse), which yield a 412-bp product. PCR conditions were 35 cycles of denaturation at 95 °C for 30 s, annealing at 56 °C for 45 s, and extension at 72 °C for 60 s in a Mastercycler Pro (Eppendorf, Westbury, NY). PCR products were diluted in 6× EZ-VisionTM DNA dye loading buffer, separated by electrophoresis on 1% agarose gel, and visualized under UV light.
Western Blotting
Cells were lysed in a buffer containing 50 mm Tris (pH 7.4), 1% Nonidet P-40, 0.25% sodium deoxycholate, 150 mm NaCl, 1 mm EDTA, 1 mm phenylmethylsulfonyl fluoride, and protease inhibitors (1 tablet/10 ml; Roche Applied Science). Protein levels were measured using the Bradford protein assay. Equal amounts of proteins (25 μg) were loaded and separated by SDS-PAGE and transferred onto nitrocellulose membranes (Bio-Rad). Blots were probed using mouse monoclonal antibodies specific for the human KCa1.1 channel α subunit (1:1000 dilution, Antibodies, Inc., University of California, Davis/National Institutes of Health NeuroMab facility), followed by secondary antibodies conjugated to HRP (1:2000 dilution, Antibodies, Inc.). Visualization was performed with an enhanced chemiluminescence system (PerkinElmer Life Sciences).
Immunocytochemistry
RA-FLS and HEK 293 cells (wild-type or stably transfected with the KCa1.1 α subunit) were grown overnight on glass coverslips. Cells were stained with wheat germ agglutinin conjugated to Alexa Fluor 555 (5 μg/ml, Invitrogen) at 37 °C for 20 min. They were washed and fixed in freshly prepared ice-cold PBS+3% formaldehyde+0.1% Triton X-100. After washes and blocking in milk-TBS-T (4% nonfat milk powder in 10 mm Tris, pH 8.0/0.15 M NaCl+0.1% Triton X-100) with gentle rocking at room temperature for 45 min, cells were incubated with the primary anti-KCa1.1 α subunit antibody diluted to 10 μg/ml in blotto-TBS-T overnight at 4 °C. The secondary antibody (goat anti-mouse IgG conjugated to Alexa Fluor 488, 1:1000 dilution in blotto-TBS-T, Invitrogen) was incubated for 1 h in the dark, followed by washes. DAPI (1 μg/ml, Invitrogen) was applied for 5 min following the second wash. Staining was detected with a Zeiss LSM 510 inverted laser scanning microscope (Carl Zeiss, Thornwood, NJ) with a 40× oil Fluor objective.
Electrophysiology
Cells were plated on glass coverslips and allowed to adhere. Total potassium currents were recorded using the patch clamp technique in the excised inside-out or whole-cell configurations. The internal solution contained 140 mm K+, 20 mm HEPES, and 10 mm Cl−. In addition, the “0 Ca2+” solution contained 5 mm EGTA, whereas the “5.5 μm Ca2+” solution contained 5 mm HEDTA and free [Ca2+], measured with a Ca2+ electrode (Orion Research, Inc.), was adjusted to 5.5 μm with CaCl2. The [Cl−] was adjusted to 10 mm with HCl. The external solution contained 140 mm K+, 20 mm HEPES, 2 mm Mg2+, 10 mm Cl−. The pH of all solutions was adjusted to 7.2 with methanesulfonic acid. Experiments were performed at room temperature (20∼22 °C). Addition of paxilline (Tocris, Ellisville, MI) and washes were performed either with a rapid perfusion system (Warner Instruments SF-77B) or by exchanging the bath completely with at least 10 volumes of solution.
Calcium Imaging
Cells were loaded with membrane permeable Fura-2 acetomethyl ester (Molecular Probes, Eugene, OR) following manufacturer's instructions. Fluorescence was excited with monochromatic light (bandwidth of 8–15 nm and a homogeneity of better than 10%) of appropriate wavelengths using a rapidly tunable (<1.5 ms wavelength change) galvanometric scanner-mounted grating, (Polychrome IV; TILL Photonics, Gräfelfing, Germany), with a 150 Watt Xenon short arc lamp as a light source. Fluorescence detection was done using a 12-bit CCD camera (ORCA-R2, Hamamatsu Photonics K.K., Japan) mounted on an Axioscope 2FS equipped with a 20× water immersion lens (Achroplan 20× 0.50 numerical aperture, Carl Zeiss AG., Oberkochen, Germany), a 400DCLP dichroic mirror (Chroma Technology, Brattleboro, VT), and D510/40m emmiter filter (Chroma Technology, Brattleboro, VT). During application of paxilline or tetraethylammonium (TEA, Sigma), pairs of fluorescence images (full frame of 1344 × 1024 pixels with a 2 × 2 binning) were acquired at 50–100 ms integration time at the excitation maximum of the Ca2+-free form of Fura-2 (380 nm, F1) and isoasbestic point (360 nm, F2) with 40-ms intervals and the succession rate of once every 2 s. Camera triggering, synchronized control of the monochromator, and acquisition of optical data were performed via ITC-18 (HEKA Instruments, Inc., Baltimore, MD) and PCIe-6259 (National Instruments, Austin, TX) interfaces using a 2.8-GHz MacPro computer (Apple Computer, Cupertino, CA) running a custom-built software. Ratios were calculated from background subtracted fluorescence intensities in the regions of interest placed over the individual cells. Tyrode solution, continuously bubbled with 95–5% O2-CO2, was perfused through the recording chamber at the rate of 2 ml/min.
Cell Proliferation Assays
Proliferation assays were performed as described (17–23). Briefly, RA-FLS (104/well) were cultured in 96-well plates and pre-incubated with paxilline or TEA for 30 min before addition of LPS, poly(I·C), or PGN. Cells were further incubated for 72 h at 37 °C and 1 μCi/well [3H]thymidine was added during the last 16–18 h. DNA was harvested on glass fiber filters using a cell harvester (Inotech Biosystems International, Rockville, MD). The amount of incorporated [3H]thymidine was determined using an LS6500 β scintillation counter (Beckman Coulter, Brea, CA).
Cytotoxicity Assays
RA-FLS were plated in six-well plates (5 × 10⁴ cells/well) and allowed to adhere. Varying amounts of staurosporine (Sigma) or paxilline were added, and the cells were incubated at 37 °C for 48 h. Cells were washed with PBS wash (PBS+1% BSA+1% sodium azide) and labeled with 20 μg/ml 7-aminoactinomycin D (Sigma) for 20 min at 4 °C. Cells were then washed in PBS wash+20 μg/ml actinomycin D (Sigma) and resuspended in PBS wash+1% formaldehyde+20 μg/ml actinomycin D for analysis of 7-aminoactinomycin D fluorescence intensity by flow cytometry on a FACS Canto II (BD Biosciences). Data were acquired with FACSDiva (BD Biosciences) and analyzed with FlowJo (Treestar, Ashland, OR) software.
Preparation of RA-FLS Culture Supernatants
RA-FLS cells, cultured in 24-well plates (5 × 10⁴ cells/300 μl/well), were pre-incubated for 45 min in the presence or absence of K+ channel blockers before addition of LPS, poly(I·C), or PGN (Sigma). Supernatants were collected 24 h later and immediately assayed or stored frozen at −80 °C.
ELISAs
Concentrations of VEGF, IL-8, and IL-6 were determined in RA-FLS culture supernatants by ELISA (R&D Systems; Minneapolis, MN) following the manufacturer's instructions.
Zymography
We used gelatin zymography (Invitrogen) to measure production of pro-MMP-2 in serum-free RA-FLS culture supernatants, as described (24). Recombinant human MMP-2 (R&D Systems) was used as a positive control.
Wound Healing Assays
RA-FLS were plated in 12-well plates and cultured until confluent. A P200 tip was drawn across each well. Free cells where removed with phosphate-buffered saline and medium with or without 20 μm paxilline was added. Cells were photographed immediately after scratching and 18 h later, using a 4× objective on an Olympus IX71 inverted microscope and a Q-color 5 digital camera. The number of migrating cells was determined.
Invasion Assays
In vitro invasion of FLS was assayed in a trans-well system using collagen-rich Matrigel-coated inserts, as described (9, 16, 25, 26). Briefly, 70–80% confluent cells were harvested by trypsin-EDTA digestion. 2 × 10⁴ cells were resuspended in 500 μl of serum-free medium and plated in the upper compartment of the Matrigel-coated inserts (BD Biosciences). Paxilline, TEA, or vehicle was added to the upper chamber. The lower compartment was filled with complete media and the plates were incubated at 37 °C for 24 h. The upper surface of the insert was then wiped with cotton swabs to remove non-invading cells and the Matrigel layer. The opposite side of the insert was stained with Crystal Violet (Sigma), and the total number of cells that invaded through Matrigel was counted at a 100× magnification.
Statistical Analysis
We used one-way or two-way analysis of variance to calculate statistical significance of all of our results (GraphPad Prism Software, San Diego, CA). p values <0.05 were considered significant.
RESULTS
RA-FLS Express Functional KCa1.1 Channels at Their Plasma Membrane
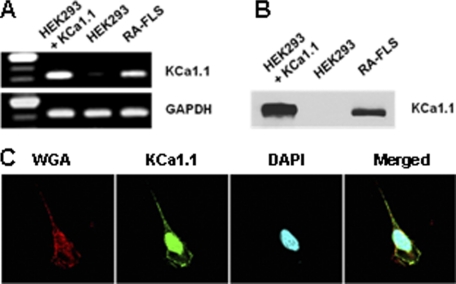
We extracted total RNAs from five FLS generated from five different patients with RA. RT-PCR showed the expression of the KCa1.1 channel α subunit mRNA in all samples (Fig. 1A). The primers used were designed to amplify a conserved region. HEK 293 cells do not express KCa1.1 channels and were used as negative controls or were stably transfected with the KCa1.1 α subunit to use as positive controls. Western blot analysis of total protein contents showed that the α subunit of KCa1.1 channels is present in RA-FLS (Fig. 1B). Confocal microscopy revealed that the KCa1.1 α subunit was present both in the nucleus and at the plasma membrane of RA-FLS (Fig. 1C).
FIGURE 1.
RA-FLS express the KCa1.1 channel α subunit. A, representative RT-PCR on RNA extracted from HEK 293 cells stably transfected with the KCa1.1 channel α subunit, non-transfected HEK 293 cells, and RA-FLS. B, representative Western blot against the KCa1.1 α subunit on total protein extracts from HEK 293 cells stably transfected with KCa1.1 channels, non-transfected HEK 293 cells, and RA-FLS. C, immunocytochemistry staining of RA-FLS for confocal microscopy. Left, wheat germ agglutinin (WGA) with membrane staining. Middle left: anti-KCa1.1 α subunit antibody. Middle right, DAPI showing nuclear staining. Right, merged images.
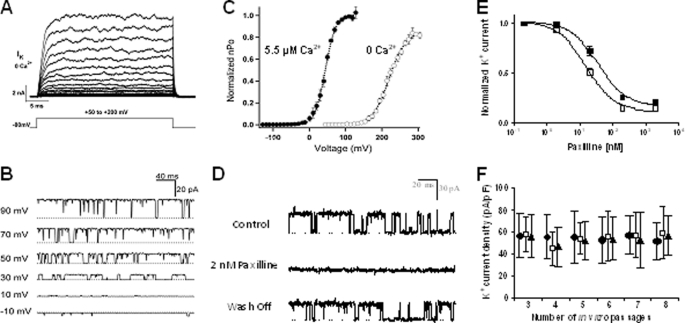
We next used electrophysiology to determine whether the KCa1.1 α subunit expressed at the plasma membrane of RA-FLS forms functional channels. Large outward currents were recorded from RA-FLS in response to voltage pulses in the absence of internal Ca2+ using the whole-cell patch clamp technique (Fig. 2A). The rapid activation kinetics, lack of inactivation, and little current observed below +100 mV are all consistent with the behavior of KCa1.1 channels in 0 Ca2+ (27). To further characterize the channel, currents were recorded from excised patches (Fig. 2, B–D). In all patches tested, unitary currents were observed (Fig. 2, B and D) with a large conductance of 271 ± 4 pS (n = 3, 5.5 μm Ca2+) in symmetrical 140 mm K+, consistent with KCa1.1 channels (28). The open probability (Po) of these channels was both voltage- and calcium-dependent, a hallmark of KCa1.1 channels, with a half-activation voltage (V0.5) of 220 ± 1.1 mV in 0 Ca2+ and 44 ± 0.4 mV in 5.5 μm Ca2+ (Fig. 2C), both values within the range reported for KCa1.1 channels, with and without β subunits (28, 29). In addition, single channel currents were reversibly blocked by application of the KCa1.1 channel blocker paxilline to the intracellular side of the membrane (Fig. 2D). Taken together, the results clearly demonstrate the presence of functional KCa1.1 channels at the plasma membrane of RA-FLS.
FIGURE 2.
RA-FLS express functional KCa1.1 channels at their plasma membrane. A, family of currents elicited from a whole cell with 0 Ca2+ internal solution by pulses from 50 to 200 mV in 10-mV increments. B, single channel currents recorded at different voltages from an inside-out patch in 5.5 μm Ca2+ and filtered at 5 kHz. Dotted lines indicate closed channels. C, normalized open probability (Po) versus voltage relations determined by measuring the normalized Po in multichannel patches (n = 5 at each [Ca2+]) and normalizing to Po(max) measured in single patches at 0 Ca2+ (○) and 5.5 μm Ca2+ (●). The curves were fit with Boltzmann functions. D, currents from RA-FLS before (control), during, and after (wash-off) treatment with 2 nm paxilline in the bath solution of an inside-out patch. E, dose-dependent inhibition by paxilline of whole-cell RA-FLS current (closed squares) or KCa1.1 currents stably expressed in HEK 293 cells (open squares) (n = 4–6 cells from three different donors). F, mean RA-FLS current density determined from cell capacitance and peak whole-cell current at +150 mV in 0 Ca2+ and plotted for each in vitro passage. 30–50 cells from three different donors (●, □, ▴) analyzed at each time point.
To determine whether KCa1.1 is the major functional potassium channel expressed at the plasma membrane of RA-FLS, we examined the effect of extracellular paxilline on the whole-cell K+ current. Paxilline inhibited RA-FLS potassium currents with an IC50 of 36 ± 6 nm and KCa1.1 currents in stably transfected HEK 293 cells with an IC50 of 15 ± 2 nm (Fig. 2E). The similar IC50 and >80% reduction in current by paxilline confirm that KCa1.1 is responsible for the majority of the K+ current in RA-FLS and is therefore the major functional potassium channel expressed at the plasma membrane of these cells.
Finally, we patch clamped RA-FLS in the whole-cell configuration after each passage in vitro and determined that their maintenance in culture for at least up to eight passages does not affect their functional KCa1.1 channel density (Fig. 2F).
Blocking KCa1.1 Channels Perturbs Calcium Homeostasis of RA-FLS
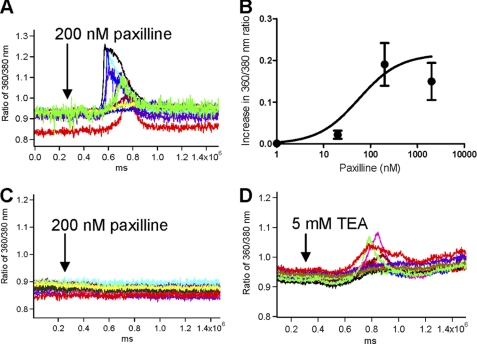
Paxilline induced an influx of calcium in RA-FLS (Fig. 3A). This influx was dependent on the dose of paxilline perfused onto the cells, with an EC50 ≈ 56.12 ± 0.02 nm (Fig. 3B). Paxilline did not induce calcium influx through release of the internal stores of calcium as perfusion of 200 nm paxilline in the absence of free extracellular calcium did not induce any increase in intracellular free calcium levels (Fig. 3C). The effect of paxilline on calcium homeostasis in the RA-FLS was due to block of KCa1.1 channels and not cross-reaction with other signaling molecules as TEA, another blocker of these channels, also induced calcium influx in RA-FLS (Fig. 3D).
FIGURE 3.
KCa1.1 channel blockade perturbs Ca2+ homeostasis in RA-FLS. A, paxilline (200 nm) induces a 360/380 nm ratio increases by 0.19 ± 0.05. Each trace represents a single cell. B, paxilline induces a dose-dependent increase in free intracellular Ca2+ levels with an EC50 ≈ 56.12 ± 0.02 nm. The curve was fit with a Michaelis-Menten function. C, in the absence of extracellular Ca2+, paxilline (200 nm) does not affect the intracellular concentration of free Ca2+. Each trace represents a single cell. D, TEA (5 mm) induces a 360/380 nm ratio increases by 0.12 ± 0.02. Each trace represents a single cell.
KCa1.1 Channel Blockers Inhibit Proliferation of RA-FLS in Dose-dependent Manner without Inducing Cell Death
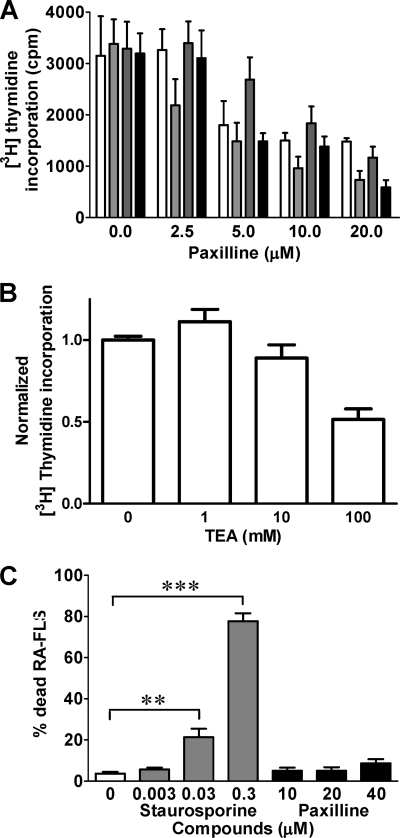
Paxilline and TEA inhibited the proliferation of RA-FLS in a dose-dependent manner with IC50 values of ≈ 5 μm and 100 mm, respectively (Fig. 4, A and B). RA-FLS express Toll-like receptors (TLRs), making them susceptible to activation by TLR ligands, such as PGN, poly(I·C), and LPS. Addition of the TLR ligands did not affect the proliferative response of RA-FLS and did not significantly alter their sensitivity to KCa1.1 channel block as the IC50 for paxilline remained in the 5–10 μm range (Fig. 4A).
FIGURE 4.
Paxilline inhibits the proliferation of RA-FLS without inducing toxicity. A, dose-dependent inhibition of RA-FLS proliferation by paxilline. Cells were left unstimulated (white) or were stimulated with 20 ng/ml LPS (light gray), 20 μg/ml poly(I·C) (dark gray), or 1 μg/ml PGN (black) for 72 h. Data are from five independent experiments with cells from five different donors. B, dose-dependent inhibition of RA-FLS proliferation by TEA. Data are from four independent experiments with cells from four different donors. C, dose-dependent toxicity of staurosporine (gray) and paxilline (black) over a 48-h incubation with RA-FLS. Data are from four independent experiments with cells from four different donors. **, p ≤ 0.01; ***, p ≤ 0.001.
To determine whether the observed effects of paxilline on RA-FLS proliferation were due to toxicity, we incubated RA-FLS for 48 h with varying amounts of paxilline or of the broad-spectrum kinase inhibitor staurosporine, used as a positive control for toxicity (30). As expected, a staurosporine concentration of 30 nm induced ∼20% cell death, and a concentration of 300 nm induced ∼80% cell death (Fig. 4C). In contrast, paxilline at concentrations up to 40 μm induced ≤10% cell death (Fig. 4C), showing that paxilline is not toxic to RA-FLS.
Paxilline Inhibits Production of VEGF and IL-8, but Not of IL-6, by RA-FLS
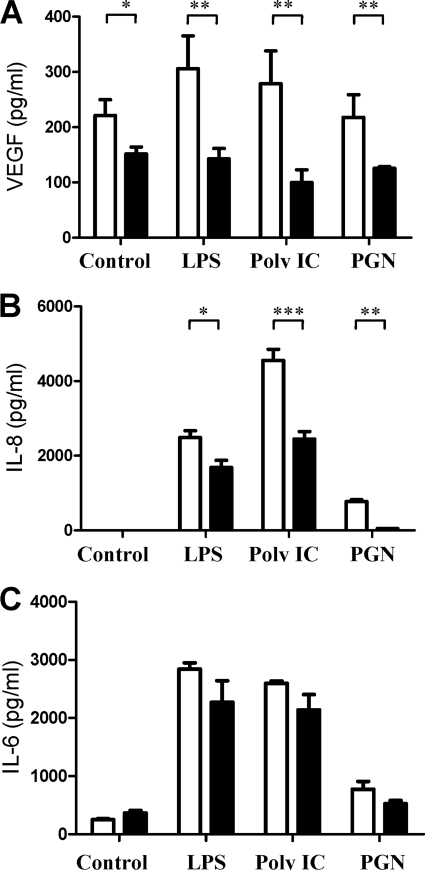
RA-FLS produced 248 ± 27 pg/ml VEGF at baseline. Cell stimulation with LPS or poly(I·C) moderately increased this production to 359 ± 66 pg/ml and 334 ± 55 pg/ml, respectively, and PGN did not affect VEGF production (Fig. 5A). Paxilline significantly inhibited production of VEGF by RA-FLS at baseline and following TLR ligand stimulation.
FIGURE 5.
Blocking KCa1.1 channels inhibits the production of VEGF and IL-8, but not of IL-6, by RA-FLS. RA-FLS were left unstimulated (control) or were stimulated with 20 ng/ml LPS, 20 μg/ml poly(I·C), or 1 μg/ml PGN for 24 h in the absence or presence of 20 μm paxilline. Production of VEGF (A), IL-8 (B), and of IL-6 (C) were measured in culture supernatants by ELISA (R&D Systems). Data are from three independent experiments with cells from three different donors. *, p ≤ 0.05; **, p ≤ 0.01; ***, p ≤ 0.001.
RA-FLS did not produce detectable amounts of IL-8 at baseline but LPS, poly(I·C), and PGN induced IL-8 production of 2500 ± 300 pg/ml, 4500 ± 500 pg/ml, and 771 ± 87 pg/ml, respectively (Fig. 5B). Paxilline significantly inhibited this production of IL-8 by inducing a 31% reduction in levels induced by LPS (p ≤ 0.001), a 46% reduction in poly(I·C)-inducible levels (p ≤ 0.001), and a 94% reduction in production stimulated by PGN (p ≤ 0.01).
RA-FLS produced 240 ± 38 pg/ml IL-6 at baseline and their stimulation with the TLR ligands LPS, poly(I·C), and PGN increased this IL-6 production to 2800 ± 200 pg/ml (p ≤ 0.01), 2600 ± 30 pg/ml (p ≤ 0.01), and 678 ± 237 pg/ml (p ≤ 0.05), respectively (Fig. 5C). In contrast to our findings with VEGF and IL-8, blocking their KCa1.1 channels did not significantly affect production of IL-6 by RA-FLS.
KCa1.1 Channel Blockade Reduces Production of Pro-MMP-2 by RA-FLS
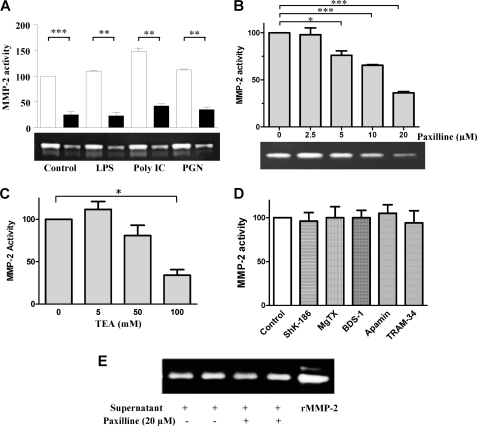
Supernatants from RA-FLS cultures produced detectable amounts of pro-MMP-2 in the absence of any stimulation. LPS and PGN induced a mild but significant increase in pro-MMP-2 levels (12 and 10% above baseline, respectively; p ≤ 0.05), whereas poly(I·C) induced a 48% (p ≤ 0.05) increase (Fig. 6A). Paxilline (20 μm) significantly reduced levels of pro-MMP-2 produced by RA-FLS, regardless of the stimulus. This inhibitory effect of paxilline was dose-dependent with an IC50 ≈ 12 μm (Fig. 6B). TEA had similar dose-dependent activity on the production of pro-MMP-2 with an IC50 ≈ 80 mm (Fig. 6C). In contrast, blockers of all other subsets of KCa channels (apamin (100 nm) and TRAM-34 (1 μm) (31, 32)) or of Kv channels (ShK-186 (100 nm), margatoxin (100 nm), BDS-1 (1 μm)) did not affect pro-MMP-2 production by RA-FLS at concentrations known to block >90% of target channels (Fig. 6D).
FIGURE 6.
Paxilline and TEA inhibit the production of pro-MMP-2 by RA-FLS. A, paxilline (20 μm; black bars) inhibits pro-MMP-2 production by RA-FLS (white bars) either left untreated (control) or activated by 20 ng/ml LPS, 20 μg/ml poly(I·C), or 1 μg/ml PGN for 24 h. Production of pro-MMP-2 in culture supernatants was measured by zymography on gelatin gels (bottom) and normalized to the production by untreated RA-FLS (top). B, paxilline inhibits pro-MMP-2 production by RA-FLS activated with 20 ng/ml LPS in a dose-dependent manner. C, TEA inhibits the spontaneous production of pro-MMP-2 by RA-FLS in a dose-dependent manner. D, blockers of Kv (ShK-186, margatoxin (MgTX), BDS-1) and other KCa (apamin, TRAM-34) channels do not affect pro-MMP-2 production by RA-FLS. E, paxilline does not directly affect the protease activity of pro-MMP-2 when added to culture supernatants 30 min before gelatin zymography gel loading. Data shown in this figure are representative from four to six independent experiments with cells from four to five different donors. *, p ≤ 0.05; ***, p ≤ 0.001. rMMP, recombinant MMP.
Because zymography is an activity-based assay, we tested whether paxilline directly affects MMP-2 enzymatic activity by adding paxilline to culture supernatants 30 min before gel loading. Paxilline had no effect on the ability of MMP-2 to digest gelatin (Fig. 6E), confirming the effects of paxilline shown in Fig. 6, A and B, are due to reduction of pro-MMP-2 release by the RA-FLS.
Blocking KCa1.1 Channels Inhibits Migratory and Invasive Activity of RA-FLS in Dose-dependent Manner
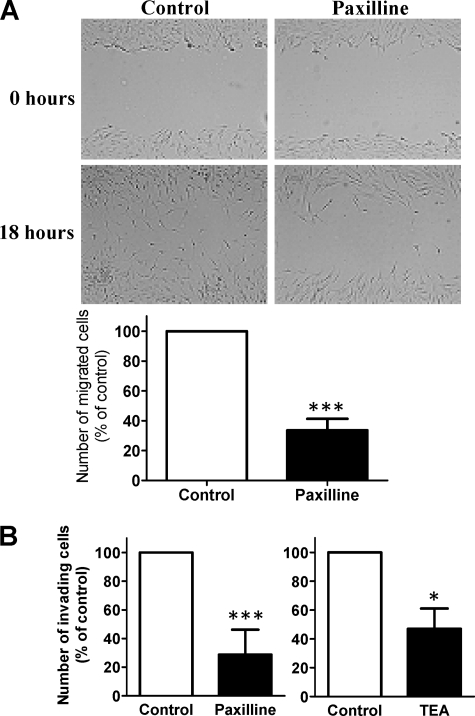
We used a wound-healing assay to determine the role of KCa1.1 channels on the two-dimensional migration of RA-FLS (Fig. 7A). After an 18-h culture, paxilline (20 μm) inhibited the migration of RA-FLS by 66 ± 8%; p ≤ 0.001 (Fig. 7A).
FIGURE 7.
Paxilline inhibits the invasion and migration of RA-FLS. A, paxilline (20 μm) significantly inhibited the migration activity of RA-FLS (66.4 ± 7.7%). Data are from five independent experiments with cells from five different donors. B, paxilline (20 μm) and TEA (50 mm) significantly reduced the number of invading RA-FLS (71 ± 6% and 53 ± 5%, respectively). Data are from seven independent experiments with cells from seven different donors for each set of experiments. *, p ≤ 0.05; ***, p ≤ 0.001.
To examine the role of KCa1.1 channels in the invasive behavior of RA-FLS, we determined the effect of paxilline (20 μm) and TEA (50 mm) on FLS invasion through Matrigel. Both blockers inhibited RA-FLS invasiveness by 71 ± 6%; p ≤ 0.001 (paxilline) and 53 ± 5%; p ≤ 0.05 (TEA) (Fig. 7B).
DISCUSSION
RA is a chronic inflammatory disease of the joints with unclear etiology (1, 2). FLS play important roles in RA pathogenesis by secreting proinflammatory cytokines, chemokines, proteolytic enzymes, and growth factors that attract and activate immune cells, induce angiogenesis, and mediate joint destruction (3–5). Here, we identified KCa1.1 channels as the major functional potassium-conducting channels at the plasma membrane of RA-FLS and demonstrated that blockade of these channels perturbs calcium homeostasis in these cells and inhibits the proliferation, invasiveness, migration, and production of IL-8, VEGF, and pro-MMP-2 by RA-FLS without inducing toxicity or affecting their IL-6 production.
To our knowledge, this is the first study describing the expression of KCa1.1 channels by RA-FLS. The majority of mammalian cells express potassium channels at their plasma membrane (12). In electrically non-excitable cells, these channels play a major regulatory role in cell signaling and function by maintaining the resting membrane potential of cells, making them attractive targets for therapy (33–36). KCa1.1 channels are the only members of the KCa1 potassium channel family and they are expressed widely by various tissues, raising the possibility of increased risk of side effects from blocking them (28). However, mice lacking the gene for the KCa1.1 channel α subunit display only moderate ataxia and urinary incontinence (37) and studies in sheep treated with KCa1.1 channel blockers showed that the reversible tremors and locomotor incoordination are due to effects on the central nervous system (38). The generation of new blockers unable the cross the blood-brain barrier and therefore likely to have fewer side effects is warranted for in vivo studies.
In addition, the KCa1.1 channel α subunit can be associated with different regulatory β subunits with restricted tissue distribution and both α and β subunits of KCa1.1 channels contain multiple splicing sites, dramatically increasing the diversity of channel variants (29, 39). Such diversity increases the attractiveness of these channels as potential therapeutic targets.
A study conducted in cultured rabbit synoviocytes lead to the identification of Kv1 channels at the plasma membrane of these cells (40). However, we show here that blockers of Kv channels (ShK-186, margatoxin, BDS-1) and of other subsets of KCa channels (apamin, TRAM-34) had no effect on the production of pro-MMP-2 by RA-FLS. These observations suggest that these additional channels, if expressed by human FLS, play only a minor role in regulating the function of RA-FLS in which KCa1.1 channels play a role.
Paxilline inhibited the production of IL-8 and of VEGF by RA-FLS but had no effect on the production of IL-6 induced by TLR ligands and was not toxic. These data suggest that the effects of paxilline observed on RA-FLS function are not due to toxicity at the concentrations used. These results also demonstrate the existence of distinct signaling pathways leading to the production of IL-6 and IL-8, the former being independent of KCa1.1 channel function and the latter being dependent on channel function. Further studies into the pathways affected by KCa1.1 channel block are warranted in RA-FLS.
The reduction of IL-8, VEGF, and pro-MMP-2 levels was not explained by a reduced proliferative rate of RA-FLS in the presence of paxilline because cell numbers in each well (with and without paxilline) remained similar during the stimulation period. In addition, if a reduced proliferative rate was the explanation for reduced secretion of IL-8, VEGF, and pro-MMP-2, then the secretion of IL-6 would likely be reduced in a similar manner, which was not the case.
Paxilline concentrations of 36 and 54 nm are sufficient to block 50% of the potassium current of RA-FLS and a to induce a 50% increase of calcium influx. However, concentrations in the low μm are necessary to inhibit key proinflammatory and invasive properties of RA-FLS. A similar difference is observed for TEA when comparing its effects on calcium influx and on functional assays. Such a difference in blocker efficacy in whole-cell patch clamp and functional assays was also observed with other potassium channel blockers in other cells types. For example, in T lymphocytes the Kv1.3 channel blocker ShK and its analogs block the channel with an IC50 in the low pm range, but nm concentrations are necessary to inhibit cell function (20–23, 41, 42). At least three factors may influence this difference in required concentrations. First, a block of >90% of the channels may be required to alter cell function, requiring much higher concentrations of blockers to observe an effect on cell function. Second, the tissue culture medium used for functional assays is more complex than the well defined salt solutions used for patch clamp or calcium imaging, and blockers may bind to medium components (such as proteins), reducing the concentration of the free and active form of the blocker available for channel block. Third, the patch clamp data are a direct readout of the effect of the blockers on the channel but during functional assays, multiple pathways could be activated and contribute to the final readout.
RA-FLS have an often called “transformed” phenotype, reminiscent of that observed in cancer cells. They become highly invasive and produce proinflammatory and angiogenic factors and proteases (6). All these properties facilitate formation of a pannus, joint damage, and disease spread from affected to healthy joints. FLS in vitro invasive properties correlate with radiographic and histological damage in RA and in rodent models of RA, respectively (9, 10). FLS invasion involves MMP-2 and, like invasion, MMP-2 levels also correlate with radiographic damage in RA (9, 43). Additionally, the FLS-mediated disease spreading likely requires cell invasion and MMP activity to access the intravascular space. Therefore, targeting these FLS phenotypes via KCa1.1 channel blockade has the potential to prevent or reduce disease spreading, disease severity, and cartilage and bone damage.
We show that targeting the KCa1.1 channels expressed by RA-FLS inhibits cell proliferation and the production of at least some of the factors involved in RA pathogenesis. Our results suggest that blockers selective for KCa1.1 channels represent new tools for the treatment of RA. The inhibitory effects of blocking KCa1.1 channels on the production of pro-MMP-2 and on the invasiveness of RA-FLS are especially notable because expression levels of MMP-2 and invasiveness of RA-FLS correlate with each other and with radiographic damage in RA, which, in turn correlate with disease severity and increased risk for disability, deformities, and reduced life expectancy (9, 10, 43). Affecting both these features of RA-FLS would potentially have tremendous benefits for patients with RA. Further studies into the effects of such blockers in animal models of RA are now necessary to establish their in vivo usefulness.
Supplementary Material
This work was supported by the Baylor College of Medicine (to F. T. H. and C. B.), the Feinstein Institute North Shore–Long Island Jewish Health System General Clinical Research National Institutes of Health Grant M01RR018535 (to P. S. G.) and National Institutes of Health, NIAID Grants AI084981 (to C. B.) and AI54348 (to P. S. G.), NINDS Grant NS042901 (to F. T. H.), NIAMS Grants AR059838 (to C. B.), and AR0426213 (to P. S. G.)). The Baylor College of Medicine Cytometry and Cell Sorting Core is supported by National Institutes of Health Grants NCRR S10RR024574, NIAID AI036211, and NCI P30CA125123.

This article contains supplemental Table S1.
- RA
- rheumatoid arthritis
- FLS
- fibroblast-like synoviocyte(s)
- KCa
- calcium-activated potassium channel
- MMP
- matrix metalloproteinase
- VEGF
- vascular endothelial growth factor
- RA-FLS
- FLS isolated from patients with RA
- TEA
- tetraethylammonium
- TLR
- Toll-like receptor
- PGN
- peptidoglycan.
REFERENCES
- 1. Gregersen P. K., Plenge R. M., Gulko P. S. (2006) in Rheumatoid Arthritis (Firestein G., Panayi G., Wollheim F. A., eds) Oxford University Press, New York [Google Scholar]
- 2. Gulko P. S., Winchester R. J. (2001) in Samter's Immunologic Diseases (Austen K. F., Frank M. M., Atkinson J. P., Cantor H., eds) Lippincott, Williams, & Wilkins, Baltimore [Google Scholar]
- 3. Mor A., Abramson S. B., Pillinger M. H. (2005) Clin. Immunol. 115, 118–128 [DOI] [PubMed] [Google Scholar]
- 4. Abeles A. M., Pillinger M. H. (2006) Bull. NYU Hosp. Jt. Dis. 64, 20–24 [PubMed] [Google Scholar]
- 5. Meyer L. H., Franssen L., Pap T. (2006) Best Pract. Res. Clin. Rheumatol. 20, 969–981 [DOI] [PubMed] [Google Scholar]
- 6. Bartok B., Firestein G. S. (2010) Immunol. Rev. 233, 233–255 [DOI] [PMC free article] [PubMed] [Google Scholar]
- 7. Lefèvre S., Knedla A., Tennie C., Kampmann A., Wunrau C., Dinser R., Korb A., Schnäker E. M., Tarner I. H., Robbins P. D., Evans C. H., Stürz H., Steinmeyer J., Gay S., Schölmerich J., Pap T., Müller-Ladner U., Neumann E. (2009) Nat. Med. 15, 1414–1420 [DOI] [PMC free article] [PubMed] [Google Scholar]
- 8. Noss E. H., Brenner M. B. (2008) Immunol. Rev. 223, 252–270 [DOI] [PubMed] [Google Scholar]
- 9. Laragione T., Brenner M., Mello A., Symons M., Gulko P. S. (2008) Arthritis Rheum. 58, 2296–2306 [DOI] [PMC free article] [PubMed] [Google Scholar]
- 10. Tolboom T. C., van der Helm-Van Mil A. H., Nelissen R. G., Breedveld F. C., Toes R. E., Huizinga T. W. (2005) Arthritis Rheum. 52, 1999–2002 [DOI] [PubMed] [Google Scholar]
- 11. Lange F., Bajtner E., Rintisch C., Nandakumar K. S., Sack U., Holmdahl R. (2005) Ann. Rheum. Dis. 64, 599–605 [DOI] [PMC free article] [PubMed] [Google Scholar]
- 12. Hille B. (2001) Ionic Channels of Excitable Membranes, Sinauer Associates, Sunderland, MA [Google Scholar]
- 13. Aletaha D., Neogi T., Silman A. J., Funovits J., Felson D. T., Bingham C. O., 3rd, Birnbaum N. S., Burmester G. R., Bykerk V. P., Cohen M. D., Combe B., Costenbader K. H., Dougados M., Emery P., Ferraccioli G., Hazes J. M., Hobbs K., Huizinga T. W., Kavanaugh A., Kay J., Kvien T. K., Laing T., Mease P., Ménard H. A., Moreland L. W., Naden R. L., Pincus T., Smolen J. S., Stanislawska-Biernat E., Symmons D., Tak P. P., Upchurch K. S., Vencovský J., Wolfe F., Hawker G. (2010) Arthritis Rheum. 62, 2569–2581 [DOI] [PubMed] [Google Scholar]
- 14. Arnett F. C., Edworthy S. M., Bloch D. A., McShane D. J., Fries J. F., Cooper N. S., Healey L. A., Kaplan S. R., Liang M. H., Luthra H. S., and al., e (1988) Arthritis Rheum. 31, 315–324 [DOI] [PubMed] [Google Scholar]
- 15. Chan A., Akhtar M., Brenner M., Zheng Y., Gulko P. S., Symons M. (2007) Mol. Med. 13, 297–304 [DOI] [PMC free article] [PubMed] [Google Scholar]
- 16. Laragione T., Gulko P. S. (2010) Mol. Med. 16, 352–358 [DOI] [PMC free article] [PubMed] [Google Scholar]
- 17. Beeton C., Barbaria J., Giraud P., Devaux J., Benoliel A. M., Gola M., Sabatier J. M., Bernard D., Crest M., Béraud E. (2001) J. Immunol. 166, 936–944 [DOI] [PubMed] [Google Scholar]
- 18. Beeton C., Chandy K. G. (2005) Neuroscientist 11, 550–562 [DOI] [PubMed] [Google Scholar]
- 19. Beeton C., Smith B. J., Sabo J. K., Crossley G., Nugent D., Khaytin I., Chi V., Chandy K. G., Pennington M. W., Norton R. S. (2008) J. Biol. Chem. 283, 988–997 [DOI] [PubMed] [Google Scholar]
- 20. Beeton C., Wulff H., Barbaria J., Clot-Faybesse O., Pennington M., Bernard D., Cahalan M. D., Chandy K. G., Béraud E. (2001) Proc. Natl. Acad. Sci. U.S.A. 98, 13942–13947 [DOI] [PMC free article] [PubMed] [Google Scholar]
- 21. Beeton C., Wulff H., Standifer N. E., Azam P., Mullen K. M., Pennington M. W., Kolski-Andreaco A., Wei E., Grino A., Counts D. R., Wang P. H., LeeHealey C. J., S., Andrews B., Sankaranarayanan A., Homerick D., Roeck W. W., Tehranzadeh J., Stanhope K. L., Zimin P., Havel P. J., Griffey S., Knaus H. G., Nepom G. T., Gutman G. A., Calabresi P. A., Chandy K. G. (2006) Proc. Natl. Acad. Sci. U.S.A. 103, 17414–17419 [DOI] [PMC free article] [PubMed] [Google Scholar]
- 22. Matheu M. P., Beeton C., Garcia A., Chi V., Rangaraju S., Safrina O., Monaghan K., Uemura M. I., Li D., Pal S., de la Maza L. M., Monuki E., Flügel A., Pennington M. W., Parker I., Chandy K. G., Cahalan M. D. (2008) Immunity 29, 602–614 [DOI] [PMC free article] [PubMed] [Google Scholar]
- 23. Wulff H., Calabresi P. A., Allie R., Yun S., Pennington M., Beeton C., Chandy K. G. (2003) J. Clin. Invest. 111, 1703–1713 [DOI] [PMC free article] [PubMed] [Google Scholar]
- 24. Hu X., Beeton C. (2010) J. Vis. Exp. 45, 2445. [DOI] [PMC free article] [PubMed] [Google Scholar]
- 25. Laragione T., Brenner M., Li W., Gulko P. S. (2008) Arthritis Res. Ther. 10, R92. [DOI] [PMC free article] [PubMed] [Google Scholar]
- 26. Tolboom T. C., Pieterman E., van der Laan W. H., Toes R. E., Huidekoper A. L., Nelissen R. G., Breedveld F. C., Huizinga T. W. (2002) Ann. Rheum. Dis. 61, 975–980 [DOI] [PMC free article] [PubMed] [Google Scholar]
- 27. McManus O. B. (1991) J. Bioenerg. Biomembr. 23, 537–560 [DOI] [PubMed] [Google Scholar]
- 28. Gutman G. A., Chandy K. G., Adelman J. P., Aiyar J., Bayliss D. A., Clapham D. E., Covarriubias M., Desir G. V., Furuichi K., Ganetzky B., Garcia M. L., Grissmer S., Jan L. Y., Karschin A., Kim D., Kuperschmidt S., Kurachi Y., Lazdunski M., Lesage F., Lester H. A., McKinnon D., Nichols C. G., O'Kelly I., Robbins J., Robertson G. A., Rudy B., Sanguinetti M., Seino S., Stuehmer W., Tamkun M. M., Vandenberg C. A., Wei A., Wulff H., Wymore R. S. (2003) Pharmacol. Rev. 55, 583–586 [DOI] [PubMed] [Google Scholar]
- 29. Brenner R., Jegla T. J., Wickenden A., Liu Y., Aldrich R. W. (2000) J. Biol. Chem. 275, 6453–6461 [DOI] [PubMed] [Google Scholar]
- 30. Pattacini L., Casali B., Boiardi L., Pipitone N., Albertazzi L., Salvarani C. (2007) Rheumatology 46, 1252–1257 [DOI] [PubMed] [Google Scholar]
- 31. Garcia M. L., Galvez A., Garcia-Calvo M., King V. F., Vazquez J., Kaczorowski G. J. (1991) J. Bioenerg. Biomembr. 23, 615–646 [DOI] [PubMed] [Google Scholar]
- 32. Wulff H., Miller M. J., Hansel W., Grissmer S., Cahalan M. D., Chandy K. G. (2000) Proc. Natl. Acad. Sci. U.S.A. 97, 8151–8156 [DOI] [PMC free article] [PubMed] [Google Scholar]
- 33. Köhler R., Kaistha B. P., Wulff H. (2010) Expert Opin. Ther. Targets 14, 143–155 [DOI] [PMC free article] [PubMed] [Google Scholar]
- 34. Striano P., Striano S. (2009) Expert Opin. Investig. Drugs 18, 1875–1884 [DOI] [PubMed] [Google Scholar]
- 35. Wickenden A. D., McNaughton-Smith G. (2009) Curr. Pharm. Des. 15, 1773–1798 [DOI] [PubMed] [Google Scholar]
- 36. Rangaraju S., Chi V., Pennington M. W., Chandy K. G. (2009) Expert Opin. Ther. Targets 13, 909–924 [DOI] [PubMed] [Google Scholar]
- 37. Meredith A. L., Thorneloe K. S., Werner M. E., Nelson M. T., Aldrich R. W. (2004) J. Biol. Chem. 279, 36746–36752 [DOI] [PubMed] [Google Scholar]
- 38. Gallagher R. T., Keogh R. G., Latch G. C. M., Reid C. S. W. (1977) N.Z. J. Agric. Res. 20, 431–440 [Google Scholar]
- 39. Brenner R., Thomas T. O., Becker M. N., Atkinson N. S. (1996) J. Neurosci. 16, 1827–1835 [DOI] [PMC free article] [PubMed] [Google Scholar]
- 40. Large R. J., Hollywood M. A., Sergeant G. P., Thornbury K. D., Bourke S., Levick J. R., McHale N. G. (2010) Am. J. Physiol. Cell Physiol. 299, C1180–1194 [DOI] [PMC free article] [PubMed] [Google Scholar]
- 41. Beeton C., Pennington M. W., Wulff H., Singh S., Nugent D., Crossley G., Khaytin I., Calabresi P. A., Chen C. Y., Gutman G. A., Chandy K. G. (2005) Mol. Pharmacol. 67, 1369–1381 [DOI] [PMC free article] [PubMed] [Google Scholar]
- 42. Pennington M. W., Beeton C., Galea C. A., Smith B. J., Chi V., Monaghan K. P., Garcia A., Rangaraju S., Giuffrida A., Plank D., Crossley G., Nugent D., Khaytin I., Lefievre Y., Peshenko I., Dixon C., Chauhan S., Orzel A., Inoue T., Hu X., Moore R. V., Norton R. S., Chandy K. G. (2009) Mol. Pharmacol. 75, 762–773 [DOI] [PMC free article] [PubMed] [Google Scholar]
- 43. Goldbach-Mansky R., Lee J. M., Hoxworth J. M., Smith D., 2nd, Duray P., Schumacher R. H., Jr., Yarboro C. H., Klippel J., Kleiner D., El-Gabalawy H. S. (2000) Arthritis Res. 2, 145–153 [DOI] [PMC free article] [PubMed] [Google Scholar]
Associated Data
This section collects any data citations, data availability statements, or supplementary materials included in this article.


