Background: Ascorbate is an important antioxidant that is carried into and out of cells by its high-affinity transporter sodium vitamin C transporter-2 (SVCT-2).
Results: Nitric oxide increases SVCT-2 protein levels and ascorbate uptake.
Conclusion: Nitric oxide exerts a fine-tuned control of ascorbate availability to retinal cells.
Significance: Neuroprotective role of nitric oxide may be achieved by regulating SVCT-2 expression.
Keywords: Ascorbic Acid, Cyclic GMP (cGMP), Guanylate Cyclase (Guanylyl Cyclase), NF-κB Transcription Factor, Nitric Oxide, Protein Kinase G (PKG), Retinal Metabolism, Vitamin C, Retinal Cultures, Signaling Pathway
Abstract
Ascorbate is an important antioxidant, which also displays important functions in neuronal tissues, including the retina. The retina is responsible for the initial steps of visual processing, which is further refined in cerebral high-order centers. The retina is also a prototypical model for studying physiologic aspects of cells that comprise the nervous system. Of major importance also is the cellular messenger nitric oxide (NO). Previous studies have demonstrated the significance of NO for both survival and proliferation of cultured embryonic retinal cells. Cultured retinal cells express a high-affinity ascorbate transporter, and the release of ascorbate is delicately regulated by ionotropic glutamate receptors. Therefore, we proposed whether there is interplay between the ascorbate transport system and NO signaling pathway in retinal cells. Here we show compelling evidence that ascorbate uptake is tightly controlled by NO and its downstream signaling pathway in culture. NO also modulates the expression of SVCT-2, an effect mediated by cGMP and PKG. Kinetic studies suggest that NO increases the transport capacity for ascorbate, but not the affinity of SVCT-2 for its substrate. Interestingly, NO utilizes the NF-κB pathway, in a PKG-dependent manner, to modulate both SVCT-2 expression and ascorbate uptake. These results demonstrate that NO exerts a fine-tuned control of the availability of ascorbate to cultured retinal cells and strongly reinforces ascorbate as an important bioactive molecule in neuronal tissues.
Introduction
Ascorbate is a six carbon-composed sugar that displays many functions in neuronal cells, such as maturation of the glutamatergic system in cultured hippocampal cells (1) and modulation of NMDA receptor function (2). Vitamin C is a widespread term that defines its oxidized (dehydroascorbate) and its reduced forms (ascorbate). Ascorbate is transported by a high-affinity protein, named sodium vitamin C transporter (SVCT)3 (3–5), which transports ascorbate in a sodium-dependent manner, using two Na+ ions for each ascorbate molecule transported (3, 5). There are two human cloned isoforms of SVCT (SVCT-1 and -2), which are encoded by the genes SLC23A1 and SLC23A2, respectively (6, 7). The two isoforms display a high percentage homology in their primary transcripts and serve different functions among distinct tissues (6). Consensus motifs for phosphorylation by PKA and PKC have also been described within the SVCT (3–5). In the nervous system, ascorbate contributes to the formation of the myelin shaft (8, 9) and negatively modulates Na+/K+-ATPase activity (10, 11). Ascorbate has also been reported to be present in chicken embryo eyes since early stages of development (12). Previous studies have demonstrated the presence of SVCT-2 transcripts in the inner nuclear layer of the rat retina (3). Moreover, presence of the SVCT-2 protein has been described in the inner nuclear and ganglion cell layers of the chicken retina (13). In cultured chicken retinal cells it has been demonstrated that ascorbate release is modulated by ionotropic glutamate receptors and proposed that ion flux through AMPA/kainate receptors promotes SVCT-2 reversal (13).
The gaseous signaling molecule NO is produced from the amino acid l-arginine in a reaction catalyzed by nitric-oxide synthase (NOS) enzymes (14). The reaction also requires molecular oxygen with the concomitant production of NO and l-citrulline (15). NO can mediate its effects by two mechanisms: first, the classical activation of soluble guanylyl cyclase (sGC, also defined as a NO-receptor) with production of cGMP and activation of PKG, known as the sGC/cGMP/PKG pathway (16–19); second, NO can covalently attach to cysteine residues within the amino acid sequence of a specific sets of proteins, a mechanism known as S-nitrosylation (19, 20). Hitherto, the involvement of NO and its related downstream signaling pathways in several developmental aspects of the CNS has been demonstrated, for instance, neuronal proliferation, survival, and differentiation (21–25). Previous studies have demonstrated the anti-proliferative role of NO in the developing chick retina (25) and its neuroprotective role upon cultured retinal cells in relationship to culture-refeeding stress (21). Moreover, a high-affinity transport system for l-arginine as well as the neuronal NOS have been shown to be expressed in cultured retinal neurons (26). NO has also been shown to modulate the phosphorylation of ERK MAP kinase and cAMP responsive element-binding protein (CREB) transcription factor in cultured retinal cells (27).
The NF-κB is a dimeric transcription factor involved in cell survival and differentiation (28). It modulates a large number of genes in response to infection, inflammation, and other stressful situations that require rapid reprogramming of gene expression (29). When NF-κB is attached to IκB (NF-κB inhibitor), it remains in its inactive state at the cytoplasm (28). The IκB kinase (IKK) is a regulatory complex composed of two catalytic subunits (IKKα/1 and IKKβ/2) and a structural subunit known as NEMO/IKKγ (30). When active, this complex phosphorylates IκB, which is degraded by the ubiquitin system (29, 31, 32). As a result, free NF-κB can be translocated to the nucleus and modulates gene transcription. NF-κB is also a redox-sensitive transcription factor and has already been shown to modulate SVCT2 mRNA expression in response to redox-state unsteadiness in C2C12 myotubes (7). Furthermore, it has already been suggested that LPS-modulated iNOS activity may regulate NF-κB activation in non-neuronal cells (33). Moreover, the control of NO production in inflammatory processes, such as LPS-induced macrophage activation, is achieved by transcriptional regulation of the iNOS gene by the NF-κB pathway (34).
As ascorbate and NO seem to play critical roles in neuronal cells, we are interested in studying the effects of NO and its related signaling pathways on the ascorbate uptake in cultured retinal cells. Here we show for the first time that NO strictly modulates SVCT-2 expression and ascorbate uptake in retinal cells in culture, an effect mediated by the sGC/cGMP/PKG signaling pathway and NF-κB system.
EXPERIMENTAL PROCEDURES
Drugs
8-Bromo-cyclic GMP (8-bromoguanosine 3′,5′-cyclic monophosphate sodium salt), LY83583 (6-anilinoquinoline-5,8-quinone), 7-NI (7-nitroindazole), and KT5823 were from Calbiochem. ODQ (1H-[1,2,4]oxadiazole[4,3-a]quinoxalin-1-one), Zaprinast (1,4-dihydro-5-(2-propoxyphenyl)-7H-1,2,3-triazolo(4,5-d)pyrimidin-7-one), SNAP (S-nitroso-n-acetyl-dl-penicillamine), NOC-5 (3-(aminopropyl)-1-hydroxy-3-isopropyl-2-oxo-1-triazene), DAPI, actinomycin D, cycloheximide (3-[2-(3,5-dimethyl-2-oxo-cyclohexyl)-2-hydroxy ethyl]glutarimide), anisomycin ((2R,3S,4S)-2-(4-methoxybenzyl)-3,4-pyrrolidinediol-3-acetate, 2-[(4-methoxyphenyl)methyl]-3,4-pyrrolidinediol 3-acetate), DTT, EDTA, PMSF, sodium orthovanadate, sulfasalazine (5-[4-(2-pyridylsulfamoyl)phenylazo]salicylic acid), PDTC (1-pyrrolidinecarbodithioic acid ammonium salt), penicillin, streptomycin, Hepes, ascorbic acid, TEMED, β-mercaptoethanol, poly-l-ornithine; l-NAME (Nω-nitro-l-arginine methyl ester hydrochloride); l-arginine, anti-TUJ-1 antibody, and BSA were from Sigma. cPTIO (2-(4-carboxyphenyl)-4,4,5,5-tetramethylimidazoline-1-oxyl-3-oxide, potassium salt), anti-goat Alexa 488, anti-rabbit and anti-mouse Alexa 568, anti-goat HRP-conjugated secondary antibody, and ProLong Gold reagent were from Molecular Probes. Trypsin, minimum essential medium, 199 medium, glutamine, and FBS were from Invitrogen. [14C]Ascorbate (13 mCi/mmol), ECL kit, PVDF membranes, and anti-mouse/anti-rabbit HRP-conjugated secondary antibodies were from GE Healthcare. SVCT-2 (G-19) antibody was from Santa Cruz Biotechnology (Santa Cruz, CA). AKT, NF-κB, pIKK, and pIκB antibodies were from Cell Signaling (Beverly, MA). Anti-eNOS antibody, TRIzol reagent, DNase I, and SuperScript® First-Strand Synthesis System for RT-PCR kit was from Life Technology (Paisley, UK), and anti-iNOS antibody was from Abcam (Cambridge, UK). All primers used were from Nzytech (Lisbon, PT). Cytochrome c antibody was from Clontech (Mountain View, CA). Anti-phospho-histone H2A.X antibody was from Millipore (Billerica, MA). Mouse monoclonal 2M6 antibody was kindly supplied by B. Schlosshauer (NMI Naturwissenschaftliches und Medizinisches Institut an der Universität Tübingen, Reutlingen, Germany). Leupeptin (N-acetyl-l-leucyl-l-leucyl-l-argininal hemisulfate salt) was from U. S. Biochemical Corp. All other reagents were of analytical grade.
Mixed Primary Culture
Eight-day-old chicken embryo retinas (E8) were dissected from other ocular tissues (including from the retinal pigmented epithelium) and digested with 0.1% trypsin (w/v) in Ca2+ and Mg2+-free Hanks' balanced salt solution (HBSS) for 12 min at 37 °C. Then, cells were suspended in minimum essential medium, supplemented with 3% FBS (v/v), 100 units/ml of penicillin, 100 μg/ml of streptomycin and glutamine (2 mm), dissociated using a Pasteur pipette, and seeded in 40-mm or 24-well culture plastic dishes in a density of 2 × 10⁷ cells/mm2. Cells were maintained at 37 °C in a humidified incubator with 5% CO2, 95% air (v/v) for 3 to 4 days. The presence of neurons and glial cells in these cultures has been previously characterized (35).
Purified Neurons Primary Culture
Purified neurons were cultured as previously described (36). Briefly, retinas from 8-day-old chick embryos were dissected free from other ocular tissues (including the retinal pigmented epithelium), incubated with 0.1% trypsin (w/v) for 8 min, and then dissociated using a fire-polished Pasteur pipette. The cells were plated on poly-l-ornithine-coated dishes at a density of 104 cells/mm2 in medium 199 containing 10% FBS (v/v), 100 units/ml of penicillin, 100 μg/ml of streptomycin and glutamine (2 mm). Cultures were kept in a humidified atmosphere containing 5% CO2, 95% air (v/v) at 37 °C for 3 days.
[14C]Vitamin C Uptake
E8C3 cultures were rinsed twice with HBSS, containing NaCl 140 mm; KCl 5 mm; Hepes 20 mm; glucose 4 mm; MgCl2 1 mm; and CaCl2 2 mm, pH 7.4. For uptake experiments, cultured cells were preincubated for 10 min at 37 °C with HBSS in the absence or presence of different drugs, incubated with [14C]ascorbate (0.1 μCi/ml) during the indicated periods, and lysed with 5% TCA (w/v) for determination of intracellular radioactivity.
Kinetic Analysis
Mixed cultured primary cells were washed twice with HBSS and preincubated or not with the indicated stimuli (100 μm SNAP or 2 mm l-arginine) for 10 min. Cultures were then incubated with increasing concentrations (0, 1, 2, 5, 10, 15, 25, 50, 100, 200, and 500 μm) of ascorbate, [14C]ascorbate (0.1 μCi/ml), and in the presence or absence of stimuli for 5 min. The reaction was stopped by 5% TCA (w/v), the radioactivity was analyzed by liquid scintillation and the total amount of protein was determined by the Lowry method. Ascorbate content in each time point was calculated using its specific activity per protein content per minute. Data were first set up for a two-site (specific biding) nonlinear regression according to the equation: Site 1 = Bmax(Hi)·X/(Kd(Hi) + X); Site 2 = Bmax(Lo)·X/(Kd(Lo) + X); Y = Site 1 + Site 2. High- and low-affinity components were plotted using the Eadie-Hofstee transformation. Data were analyzed using GraphPad Prism version 5.00 for Windows (GraphPad Software, San Diego, CA).
Western Blotting
For detection of SVCT-2 levels, cultures were washed with HBSS, scraped off from the culture dishes in 50 μl of sample buffer, and the material was boiled for 5 min. Samples were submitted to 9 or 15% SDS-PAGE, proteins (60 μg/lane) were transferred to PVDF membranes that were then incubated overnight with specific antibodies against SVCT-2 (1:100), AKT (1:2000), cytochrome c (1:100), histone H2AX (1:1000), NF-κB (1:50), pIKK (1:100), and pIκB (1:100). Subsequently, cells were washed in TBS buffer, incubated with HRP-conjugated secondary antibodies (1:1000 mouse, 1:2000 rabbit, 1:3000 goat) and revealed using the ECL kit. The total amount of protein in each sample was determined using the Bradford reagent. Quantification of Western blots were performed using ImageJ software (Wayne Rasband, National Institutes of Health).
Nuclear Fraction Preparations
E8C3 mixed cultures were washed twice with HBSS and treated as specified under “Results.” Next, saline was removed and cells were lysed with lysis buffer (50 mm Tris-HCl, 5 mm EDTA, 100 mm NaCl, 1 mm DTT, 100 μm PMSF, 200 μm sodium orthovanadate, 1% Triton X-100, 4 μg/ml of leupeptin). The material was scrapped off the dishes and transferred to tubes, which were kept in constant motion at 4 °C for 10 min. Then, the tubes were centrifuged (16,000 × g for 10 min at 4 °C), the supernatant (cytoplasmic fraction) was collected, and the pellet (nuclear fraction) was re-suspended. Both fractions were next subjected to electrophoresis and Western blotting. To confirm the efficacy of the separation assay we used fractional markers: cytochrome c (cytoplasm fraction) and histone H2AX (nuclear fraction).
Immunocytochemistry
E8C3 cultures were fixed with 1% paraformaldehyde (w/v), washed twice for 10 min with PBS, and incubated for 2 h with blocking solution (5% BSA (w/v), 5% FBS (v/v), and 0.01% Triton X-100 (v/v) in PBS). Next, primary antibody (1:25 anti-SVCT-2, 1:25 anti-NF-κB, 1:100 2M6, 1:500 anti-TUJ, 1:150 anti-eNOS, and 1:100 anti-iNOS) was incubated and the slides were maintained overnight in a humidified chamber. The next day, coverslips were washed 3× 10 min with PBS and secondary antibodies (anti-rabbit Alexa 568, anti-mouse Alexa 568, or anti-goat Alexa 488 (1:200)) were added and maintained for 2 h. After that, coverslips were washed 3× 10 min with PBS, DAPI (1:1000), a nuclear marker, was added for 30 s, then removed and the cells were washed 3× 5 min. Then, coverslips were mounted with ProlongGold reagent and visualized using either a Nikon 80i fluorescence microscope or a Zeiss LSM711 confocal microscope. Pixel intensity was quantified by ImageJ software (National Institutes of Health). In the case of double staining, primary antibodies were incubated separately.
Total RNA Extraction, cDNA Synthesis, and Quantitative Real Time PCR
Harvested cells from mixed retinal cultures were resuspended in 1 ml of TRIzol® reagent. Total RNA was extracted according to the manufacturer's instructions, and its quality and concentration were determined using a NanoDrop® ND-1000 Spectrophotometer (Thermo Scientific, Wilmington, DE). First strand synthesis was performed using 2 μg of total RNA (DNase I treated), random primers, and the SuperScript First-Strand Synthesis System for RT-PCR kit. qRT-PCR was carried out using iTaq SYBR Green Mastermix with ROX (Bio-Rad) on an iQTM5 multicolor real-time PCR detection system (Bio-Rad). The final reaction volume was 20 μl. Reaction conditions were: denaturation at 95 °C for 3 min and 48 cycles of 95 °C for 15 s and annealing temperature (Tm) for 30 s. Melt curve analysis was performed for quality control at the end of each reaction. Primers were designed using Primer3plus: Slc23a2 forward, TCTTCCAGCCCTAACATTGG and reverse, ACTGAACTTGCCAACCATCC; Gapdh forward, GACCCCAGCAACATCAAATG and reverse, TTAGCACCACCCTTCAGATG and rpL27 forward, CATTCCCCTGGACAAAACTG and reverse, ATCGCAGCTTCTGGAAGAAC. Primer concentration, Tm, and reaction efficiency (E) were optimized for each primer set (Slc23a2, 200 nm, 58 °C, 1.94; Gapdh, 100 nm, 58 °C, 1.91; rpL27, 300 nm, 60 °C, 2.00). The efficiency was analyzed using a log-based standard curve (with cDNA pool from all samples) for each gene, according to the equation: E = 10(−1/slope). Relative quantities of Slc23a2 products in control versus SNAP-treated cultures were calculated by the method described by Pfaffl (37) using GAPDH and L27 as reference genes.
Intact Retina Experiments
E8 embryos had their retina dissected at 4 °C and were equilibrated in HBSS for 20 min at 37 °C. Next, uptake experiments were carried out as described above. The assay was stopped by adding 5% TCA (w/v) and the material was frozen overnight. The material was centrifuged at 20,627 × g for 15 min at 4 °C. The supernatant was collected and the radioactivity measured by liquid scintillation. The pellet was re-suspended in 1 m NaOH and the protein content in each sample was determined by the Lowry method.
For Western blot experiments, retinas from E8 embryos were dissected in ice-cold calcium and magnesium-free HBSS, transferred to tubes containing HBSS, and equilibrated at 37 °C for 20 min. Retinas were treated with SNAP for 80 min and then homogenized in sample buffer, boiled for 10 min, and centrifuged at 214 × g for 15 min at 4 °C. The supernatant was collected and transferred to tubes; the protein was determined by the Bradford method.
Statistical Analysis
The data were evaluated by one-way analysis of variance followed by the Bonferroni post-test and unpaired Student t test, using GraphPad Prism software.
RESULTS
Model Characterization
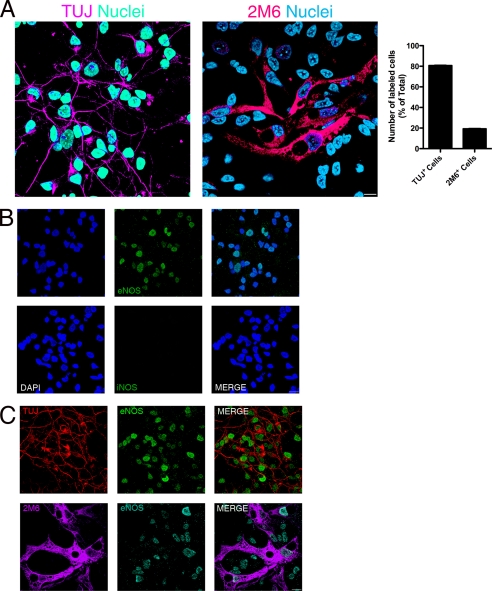
With the aim of better characterizing our model system, we performed immunocytochemistry in combination with confocal microscopy to define the neuron/glia proportion in these cultures. We observed that 80.7% of labeled cells were TUJ+ and 19.3% were 2M6+ cells (Fig. 1A). Moreover, in accordance with our goal, we evaluated the expression of NOS isoforms in our model system. The presence of nNOS in neurons has already been described, but not in glial cells, in this culture paradigm (26); so we analyzed the presence of the two other NOS isoforms. As seen in Fig. 1B, iNOS immunostaining in control cells is completely absent. On the other hand, eNOS positive cells were present in these cultures (Fig. 1B). To determine in which cell type eNOS is expressed, we performed double-labeling experiments with TUJ and 2M6, specific markers for neuronal and glial cell populations, respectively. Fig. 1C demonstrates that eNOS is co-localized with both TUJ and 2M6 positive cells.
FIGURE 1.
Mixed retinal culture characterization. Cultures were washed twice and immunocytochemistry was performed. In A, cells were immunostained for TUJ or 2M6 and total (DAPI stained), TUJ+ and 2M6+ were counted and the proportions displayed in the histogram. In B, cells were labeled for iNOS or eNOS to verify the expression of these enzymes. In C, cells were double stained for eNOS and TUJ or 2M6 to evaluate which type of cells expressed eNOS. Depicted are the representative photomicrographs (acquired using a confocal microscope) from 3 different and independent experiments, all carried out in duplicate.
NO Enhances Ascorbate Uptake in a sGC/cGMP/PKG-dependent Manner
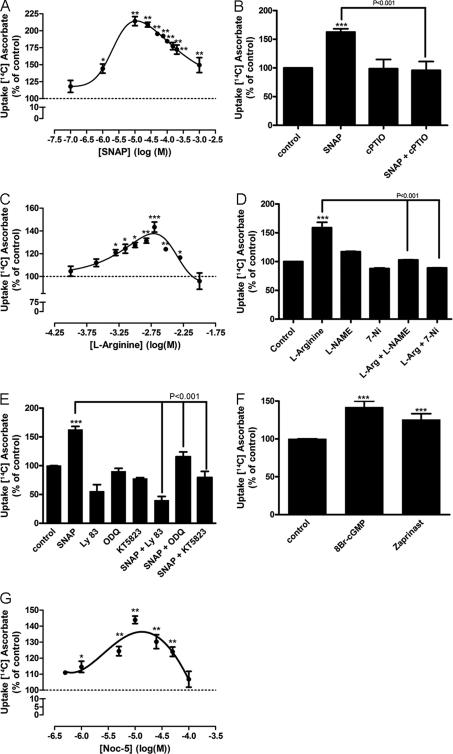
Previous works have clearly suggested that NO is an important signaling molecule in retinal cell cultures. Therefore, we tested whether NO modulates ascorbate uptake in cultured retinal cells. SNAP, a NO donor, was capable of increasing ascorbate uptake in a dose-dependent manner, with low doses (e.g. 1 and 10 μm) displaying significant effects in the uptake of ascorbate (Fig. 2A). As SNAP is a nitrosothiol compound, we further confirmed whether its effect was mediated by releasing NO. As can been seen in Fig. 2B, SNAP-induced ascorbate uptake was mediated by the release of NO because it was abolished by cPTIO (100 μm), a NO scavenger (from 62.6 ± 5.6% to −4 ± 15.3%).
FIGURE 2.
Effect of nitric oxide and its canonical pathway on ascorbate uptake. In A, C, and G, cultures were washed twice, incubated with different concentrations of SNAP (100 nm, 1 μm, 10 μm, 25 μm, 50 μm, 75 μm, 100 μm, 150 μm, 200 μm, and 1 mm), l-arginine (100 μm, 250 μm, 500 μm, 750 μm, 1 mm, 1.5 mm, 2 mm, 3.5 mm, and 10 mm), or NOC-5 (500 nm, 1 μm, 5 μm, 10 μm, 25 μm, 50 μm, and 100 μm), respectively. Cultures were also preincubated for 10 min with cPTIO (100 μm) (B); l-NAME (100 μm) or 7-NI (100 μm) (D); LY83583 (10 μm), ODQ (10 μm), or KT5823 (500 nm) (E). Then, cells were incubated with SNAP (100 μm) and l-arginine (2 mm) either in the presence or absence of the mentioned compounds for an additional 10 min. Next, cells were pulsed with [14C]ascorbate (0.1 μCi/ml) for a further 40 min, in the presence of 100 μm SNAP (B and E) or 2 mm l-arginine (D), lysed with 5% TCA (w/v), and radioactivity was measured. In F, cultures were incubated with 8-bromo-cGMP (1 mm) or Zaprinast (10 μm) for 10 min, followed by 40 min with a [14C]ascorbate (0.1 μCi/ml) pulse; cells were again lysed and radioactivity was determined by liquid scintillation. The results represent the mean ± S.E.M. of independent experiments, all carried out in triplicates. SNAP dose-response curve (n = 3); SNAP (n = 17); SNAP + cPTIO (n = 3); cPTIO (n = 3); l-arginine dose-response curve (n = 3); l-arginine (n = 5); l-arginine + l-NAME (n = 5); l-arginine + 7-NI (n = 4); l-NAME (n = 5); 7-NI (n = 4); SNAP + LY83583 (n = 3); LY83583 (n = 3); SNAP + ODQ (n = 7); ODQ (n = 7); SNAP + KT5823 (n = 4); KT5823 (n = 4); 8-bromo-cGMP (n = 3); Zaprinast (n = 9); NOC-5 dose-response curve (n = 3). *, p < 0.05 (relative to control); **, p < 0.01 (relative to control); ***, p < 0.001 (relative to control).
To correlate endogenous levels of NO with ascorbate uptake, a dose-response curve of l-arginine (the endogenous substrate of NOS) was carried out and a dose-dependent increase in ascorbate uptake was observed (Fig. 2C). Moreover, the l-arginine effect was completely abolished when cultures were treated with 100 μm 7-NI (from 59 ± 9.3% to −11 ± 0.3%; Fig. 2D) or 100 μm l-NAME (from 59 ± 9.3% to 2.9 ± 0.2%; Fig. 2D), both selective inhibitors of NOS.
Given that NO can mediate its effects by activating sGC, with subsequent production of cGMP and activation of PKG, we tested LY83583 (10 μm) and ODQ (10 μm), both inhibitors of sGC. As indicated in Fig. 2E, both LY83583 (−44.5 ± 11.0%) and ODQ (15.5 ± 8.4%) inhibited a SNAP-induced increase of ascorbate uptake. Moreover, KT5823 (500 nm), a PKG inhibitor, also blocked the SNAP effect (−20.3 ± 10.4%; Fig. 2E). To corroborate these results, we used 8-bromo-cGMP (1 mm), a cGMP active analog, and observed an increase in ascorbate uptake (45.8 ± 8.6%; Fig. 2F). In addition, we used Zaprinast (5 μm), a cGMP phosphodiesterase inhibitor, and enhanced ascorbate uptake was also observed (42 ± 7.9%; Fig. 2F). Furthermore, NOC-5, a non-nitrosothiol NO donor, was also capable of stimulating ascorbate uptake in a dose-dependent manner (Fig. 2G). Taken together, these data indeed suggest that NO, through its canonical signaling pathway, is the molecule responsible for the modulation observed in ascorbate uptake.
NO Modulates the Kinetics of Ascorbate Uptake
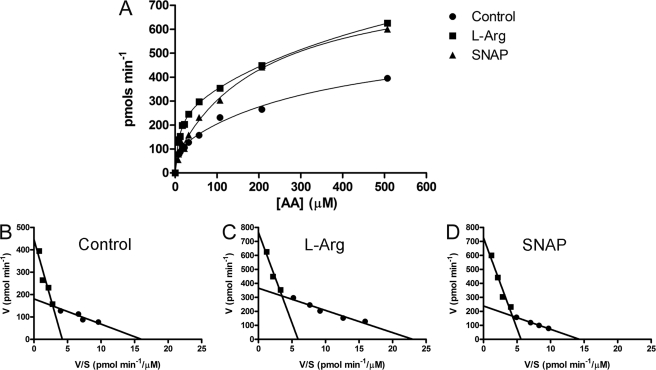
As stated above, we have observed the involvement of the classical NO signaling pathway in ascorbate uptake; therefore, we performed kinetic assays in the presence of either l-arginine or SNAP to clarify the mechanism involved in the NO-induced increase of ascorbate uptake (Fig. 3). The Eadie-Hofstee plots (Fig. 3, B–D) demonstrated that the concentration curve of ascorbate uptake displayed two components: one with high-affinity and another with low-affinity. Interestingly, both l-arginine (Fig. 3C) and SNAP (Fig. 3D) treatment increased the Vmax of both the low- and high-affinity components, respectively, without modifying their Km. Therefore, we suggest that NO modulates the transport capacity of SVCT-2.
FIGURE 3.
Kinetic characterization of SNAP-induced vitamin C uptake. A, cultures were washed twice and incubated with different ascorbate concentrations (including [14C]ascorbate (0.1 μCi/ml)) for 5 min in the absence or presence of either l-arginine (2 mm) or SNAP (100 μm). Eadie-Hofstee plots of control (B), l-arginine (C), and SNAP (D) are also shown. Cells were lysed with 5% TCA (w/v) and the radioactivity was measured. The histograms are representative curves of seven independent experiments all performed in duplicate. In B, high affinity component was Km = 12.76 ± 1.93 μm; Vmax = 187.80 ± 12.07 pmol min−1; low affinity component was Km = 105.70 ± 26.41 μm; Vmax = 446.50 ± 50.32 pmol min−1. In C, high affinity component was Km = 12.68 ± 1.78 μm; Vmax = 339.00 ± 22.76 pmol min−1; low affinity component was Km = 129.40 ± 29.77 μm; Vmax = 765.50 ± 71.18 pmol min−1. In D, high affinity component was Km = 15.26 ± 2.69 μm; Vmax = 248.80 ± 20.28 pmol min−1; low affinity component was Km = 129.8 ± 23.63 μm; Vmax = 726.10 ± 65.27 pmol min−1. AA, ascorbic acid.
NO Increases SVCT-2 Expression and Modulates Ascorbate Uptake through Its Canonical Pathway
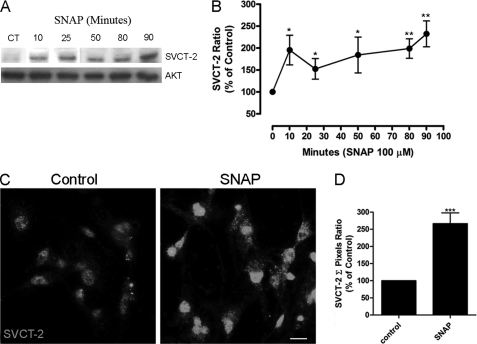
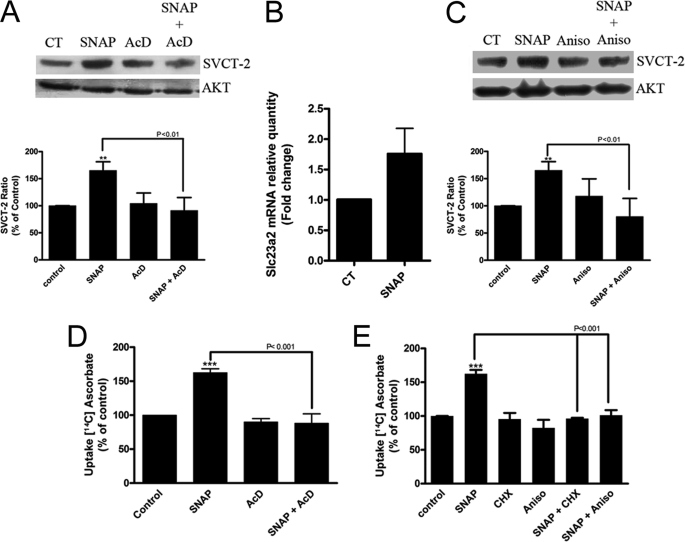
As observed, NO increases the transport capacity for ascorbate in cultured retinal cells. We then tested whether this effect could be promoted by increased SVCT-2 expression by evaluating the effect of NO on the expression levels of SVCT-2. As observed in Fig. 4, A and B, NO was capable of increasing SVCT-2 protein levels in a time-dependent manner in cultured retinal cells. Moreover, immunocytochemistry labeling corroborates Western blotting data showing that SNAP strongly enhances expression of the SVCT-2 protein in cultured retinal cells (Fig. 4, C and D). To extend these data, actinomycin D (1 μg/ml), an inhibitor of transcription, completely abolished the SNAP-induced increase in SVCT-2 expression (−8.8 ± 24.1%, n = 5; Fig. 5A). To validate that SNAP indeed regulated SVCT-2 mRNA transcription, qRT-PCR was performed and SNAP promoted an ∼1.8-fold increase in the slc23a2 gene product (Fig. 5B), demonstrating that NO regulates SVCT-2 expression at the transcriptional level. To ratify that NO modulated SVCT-2 also at the translational level, anisomycin, a protein synthesis inhibitor, completely blocked the NO-induced SVCT-2 protein increase (−19.7 ± 33.4, n = 3; Fig. 5C). In addition, CHX, another inhibitor of protein synthesis, also blocked the SNAP effect (data not shown). To confirm that NO was modulating ascorbate uptake due to boosting SVCT-2 expression levels, we used actinomycin D, CHX, and anisomycin in ascorbate uptake assays (Fig. 5, D and E). SNAP-induced increase in ascorbate uptake was completely blocked by actinomycin D (−11.7 ± 13.6%, n = 3; Fig. 5D), CHX (−3.8 ± 1.1%, n = 3; Fig. 5E), or anisomycin (1.3 ± 7.5%, n = 3; Fig. 5E). Therefore, it seems that NO increases SVCT-2 protein expression and as a result modulates ascorbate uptake.
FIGURE 4.
Stimulation of SVCT-2 expression by NO. Cultures were incubated with SNAP (100 μm) for different time periods and then prepared for Western blotting (A). Data were quantified using ImageJ software and plotted in a SVCT-2/AKT ratio normalized to the control (B). Cells were incubated with SNAP (100 μm) for 80 min and immunocytochemistry was performed (C). A histogram displaying the pixel intensity (D) relative to nitric oxide effect on SVCT-2 expression is also shown. Results in A and C are representative images. Data in B and D are the mean ± S.E.M. of different and independent experiments. For B: CT (n = 9), 10 min (n = 7), 30 min (n = 4), 50 min (n = 7), 80 min (n = 8), 90 min (n = 5); D: CT (n = 3), SNAP (n = 3). *, p < 0.05 (relative to control); **, p < 0.01 (relative to control); ***, p < 0.001 (relative to control). CT, control.
FIGURE 5.
NO modulates SVCT-2 expression and function. Cultures were preincubated with (A) actinomycin D (1 μg/ml) or (C) anisomycin (150 μm) for 10 min. Then, cells were incubated with SNAP (100 μm) in the presence or absence of the mentioned compounds for 80 min and prepared for Western blotting. Data in A and C represent the mean ± S.E.M. of independent experiments; SNAP (n = 9), SNAP + AcD (n = 5), AcD (n = 5), SNAP + Aniso (n = 3), and Aniso (n = 3). Cells were incubated with SNAP (100 μm) for 80 min and harvested in TRIzol, total RNA was extracted, cDNA was synthesized, and real-time qRT-PCR was performed (B). The results represent the mean ± S.E.M. of 3 independent experiments. Cultures were also preincubated with (D) actinomycin D (1 μg/ml) and (E) anisomycin (150 μm) or CHX (350 μm) for 10 min. Then, cells were incubated with SNAP (100 μm) in the presence or absence of the mentioned compounds for an additional 10 min. Next, cells were pulsed with [14C]ascorbate (0.1 μCi/ml) for 40 min in the presence of SNAP (100 μm), lysed with 5% TCA (w/v), and the radioactivity was measured; SNAP (n = 17), SNAP + AcD (n = 3), AcD (n = 3), SNAP + CHX (n = 3), CHX (n = 3), SNAP + Aniso (n = 3), Aniso (n = 3). **, p < 0.01 (relative to control); ***, p < 0.001 (relative to control). AcD, actinomycin; CT, control.
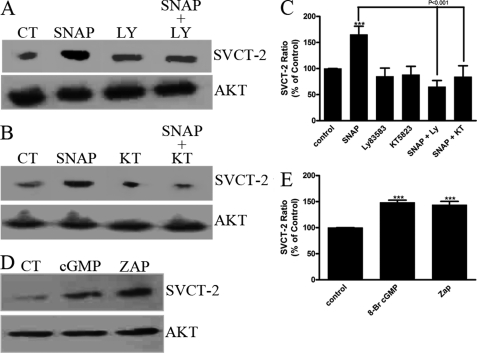
We also evaluated the involvement of the canonical NO signaling pathway in modulating SVCT-2 expression. As occurs for SNAP-induced ascorbate uptake, a SNAP-induced increase in SVCT-2 expression was totally dependent on the classical NO signaling pathway as the SNAP effect was blocked by LY83583, a sGC inhibitor (−34.9 ± 12.1%, n = 3; Fig. 6, A and C), or KT5823, a PKG inhibitor (−15.8 ± 21.1%, n = 3; Fig. 6, B and C), and mimicked by 8-bromo-cGMP (48.5 ± 4.4%, n = 3; Fig. 6, D and E) and Zaprinast (43.8 ± 6.6%, n = 3; Fig. 6, D and E).
FIGURE 6.
SVCT-2 expression is modulated by the canonical nitric oxide pathway. Cultures were preincubated with (A) LY83583 (10 μm) or (B) KT5823 (500 nm) for 10 min. Then, cells were incubated with SNAP (100 μm) either in the presence or absence of the mentioned compounds for 80 min. Next, samples were prepared for Western blotting. D, cultures were incubated with 8-bromo-cGMP (1 mm) or Zaprinast (10 μm) for 80 min and also prepared for Western blotting. Quantification histograms are plotted in C and E in a SVCT-2/AKT ratio normalized to the control. Results in A, B, and D are representative images. Data in C and E are the mean ± S.E. of different and independent experiments; SNAP (n = 9), SNAP + LY83583 (n = 3), LY83583 (n = 3), SNAP + KT5823 (n = 3), KT5823 (n = 3), 8-bromo-cGMP (n = 3), Zaprinast (n = 3). ***, p < 0.001 (relative to control). ZAP, Zaprinast; CT, control.
NO-stimulated Increase in SVCT-2 Expression Is Mediated by NF-κB
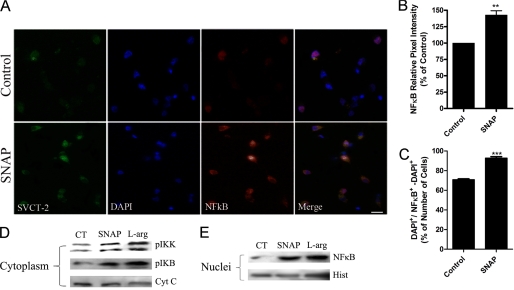
It has been shown that NF-κB can regulate SVCT-2 expression (7) and we decided to investigate whether SNAP-induced modulation in SVCT-2 expression could be mediated by NF-κB. First, we evaluated, in our model, whether NO was capable of modulating NF-κB expression. We observed that NO increased NF-κB expression (Fig. 7, A–C). Moreover, using cellular fractionation assays we showed that, when cultured retinal cells were treated with SNAP or l-arginine, there was an increase in both IKK and IκB phosphorylation at the cytoplasm compartment (Fig. 7D). Additionally, these treatments also induced the translocation of NF-κB from the cytoplasm to the nuclear compartment (Fig. 7E). Therefore, it seems that NO regulates NF-κB activation in cultured retinal cells.
FIGURE 7.
NO modulates NF-κB expression and activation. Cultures were incubated with SNAP (100 μm) for 80 min and immunocytochemistry was performed (A). Histograms displaying the pixel intensity relative to NO effect on NF-κB expression (B) and the ratio between NFκB+/total cells (C) are also shown. In B and C, results represent the mean ± S.E.M. of independent experiments; CT (n = 3), SNAP (n = 3). **, p < 0.01; ***, p < 0.001 (relative to control). Cultures were also incubated with SNAP (100 μm) for 15 min; cytosolic (D) and nuclear (E) fractions were prepared (see ”Experimental Procedures“) and samples were submitted to Western blotting. Data in A, D, and E are representative images from 3 independent experiments. Cyt C, cytochrome c; Hist, histone; l-Arg, l-arginine; CT, control.
Next, we evaluated the relationship between NF-κB and the modulatory effect played by NO in both SVCT-2 expression and ascorbate uptake. As observed in Fig. 8, A–C, both l-arginine and a SNAP-induced increase in SVCT-2 expression are regulated by NF-κB, because it was blocked by the inhibitors of the NF-κB pathway, PDTC (100 μm) or sulfasalazine (100 μm). Moreover, either l-arginine or SNAP-induced ascorbate uptake was abolished by PDTC or sulfasalazine (Fig. 8, D and E), indicating that the NF-κB signaling pathway controls the expression of SVCT-2 and, as a result, the uptake of ascorbate in cultured retinal cells.
FIGURE 8.
Involvement of NF-κB in SVCT-2 expression and ascorbate uptake. A, cultures were preincubated with PDTC (100 μm) or sulfasalazine (100 μm) for 10 min. Then, cells were incubated with SNAP (100 μm) (B) or l-arginine (2 mm) (C) either in the presence or absence of the mentioned compounds for 80 min. Next, samples were prepared for Western blotting. Results represent the mean ± S.E.M. of independent experiments, all carried out in duplicates. In B: control (n = 9), SNAP (n = 9), SNAP + Sulfa (n = 3), Sulfa (n = 3), SNAP + PDTC (n = 3), PDTC (n = 3). In C, control (n = 3), l-arginine (n = 3), l-Arg + Sulfa (n = 3), Sulfa (n = 3), l-Arg + PDTC (n = 3), PDTC (n = 3). Cultures were also preincubated with PDTC (100 μm) or sulfasalazine (100 μm) for 10 min. Then, cells were incubated with SNAP (100 μm) (D) or l-arginine (2 mm) (E) either in presence or absence of the mentioned compounds for an additional 10 min. Next, cells were pulsed with [14C]ascorbate (0.1 μCi/ml) for 40 min, lysed with 5% TCA (w/v), and the radioactivity was measured. Results represent the mean ± S.E.M. of different and independent experiments, all carried out in triplicates. In D, SNAP (n = 17), SNAP + PDTC (n = 3), PDTC (n = 3), SNAP + Sulfa (n = 3), Sulfa (n = 3). In E, l-arginine (n = 7), l-Arg + PDTC (n = 3), PDTC (n = 6), l-Arg + Sulfa (n = 3), Sulfa (n = 3). ***, p < 0.001 (relative to control); **, p < 0.01 (relative to control). CT, control.
NO Modulates Ascorbate Uptake and SVCT-2 Expression in the Intact Retina
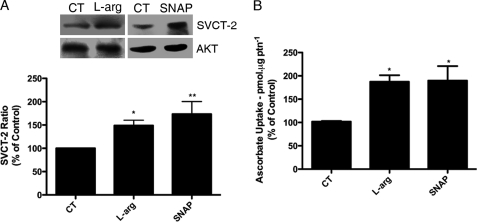
To evaluate the role played by NO in a more physiological fashion we have made use of the intact retinal tissue. This paradigm is interesting because both the cytoarchitecture of retinal layers and the cellular interactions between retinal cell types are preserved within the developing retina, unlike the employed retinal cell culture system. Interestingly, l-arginine and SNAP increased both SVCT-2 expression (Fig. 9A) and ascorbate uptake (Fig. 9B) in the intact retina, suggesting that the interplay between NO and the ascorbate system may contribute to neurochemical aspects in retinal physiology.
FIGURE 9.
Nitric oxide modulates SVCT-2 expression and function in the ex vivo retina. Retinas form E8 chick embryos were dissected and incubated with SNAP (100 μm) or l-arginine (2 mm) (A) for 80 min and prepared for Western blotting. Retinas were also incubated with SNAP (100 μm) or l-arginine (2 mm) (B) for 10 min. Next, retinas were pulsed with [14C]ascorbate (0.1 μCi/ml) for 40 min in the presence of SNAP (100 μm) or l-arginine (2 mm), lysed with 5% TCA (w/v), and the radioactivity was measured. Results represent the mean ± S.E.M. of six independent experiments. *, p < 0.05; **, p < 0.01 (relative to control (CT)).
DISCUSSION
In this work we have shown that NO increased ascorbate uptake and SVCT-2 expression through its canonical signaling pathway in cultured retinal cells. NO also regulated the NF-κB transcription factor activation in this paradigm (measured by enhanced pIκB/pIKK phosphorylation and consequent NF-κB translocation to the cell nucleus). This process is ultimately related to the NO-modulated ascorbate uptake (Fig. 8). Moreover, NO also promoted the increase of ascorbate uptake and SVCT-2 expression in a more physiological and reliable system, the intact retinal tissue.
Cross-talk between NO and Ascorbate
We have demonstrated here that NO induced an increase of SVCT-2 protein levels. When each step of the canonical NO signaling pathway is blocked by a selective inhibitor, a SNAP-induced SVCT-2 increase is completely abolished; still, NO modulation of SVCT-2 expression is tightly associated with the NO-induced increase in SVCT-2 mRNA transcription because it is abolished by a transcriptional blocker and SNAP also increased the transcription of slc23a2 in cultured cells.
NO production and nNOS activity is tightly regulated by excitatory neurotransmission in cerebellar (38), retinal (27), and cortical neurons (39). Additionally, retinal excitatory neurotransmission has already been demonstrated to play a pivotal role in regulating ascorbate release (13). Therefore, the NO pathway is possibly recruited by diverse signaling systems to differentially regulate ascorbate availability at specific neuronal microenvironments such as the hippocampus, cerebellum, cortex, or retina. In chicken retinal mixed cultures, nNOS is exclusively expressed in neuronal cells (26). Interestingly, herein we demonstrated that iNOS expression in these cultures was completely absent in nonstimulated cells. On the other hand, eNOS is present in both neurons and glial cells in these cultures, but almost solely restricted to the nuclei of these cells. In line with this, it has been demonstrated that nuclear-localized NOS displays a very low NO generation capacity in COS-7 cells (40). For this, we advocate that the main source of NO in cultured chicken retinal cells is likely to be from nNOS-containing neurons.
Ascorbate is widely known by its intracellular antioxidant role (41). Conversely, extracellular ascorbate may induce oxidative stress, due to increased conversion to dehydroascorbate, and consequently promotes neuronal damage. In line with this, it has been shown that ascorbate induces apoptotic-like cell death in several cancerous lineages such as the human squamous carcinoma (SCaBER), the transitional cell papilloma (T24) (42), the T98G glioblastoma and TC-1 human renal carcinoma cell lines (43).
However, ascorbate within neuronal cells avoids α-tocopherol oxidation; increases the viability of SH-SY5Y cells when these cells are challenged with peroxide (44) or β-amyloid (45); inhibits MPP(+)-induced cerebellar granule cells death (46); decreases ferricyanide-induced lipid peroxidation (47); and decreases H2O2-induced cell swelling in rat brain slices (48). Moreover, here we show a NO-induced regulation of ascorbate content to retinal cells and, specifically in the chicken retina, NO has been demonstrated to display a protective role against medium refeeding-induced neuronal cell death (21). Overall, the data presented herein raise the possibility that NO signals to increase intracellular ascorbate content in retinal neurons and this may protect retinal cells against oxidative stress-induced neuronal loss; furthermore, it also spans the possible intracellular mechanisms by which NO exerts its neuroprotective functions in the retina. Nevertheless, the linkage between the ascorbate transport system and NO signaling pathway in the intact retinal tissue may highlight the physiological importance of ascorbate as a signaling molecule in the nervous system and may integrate ascorbate to long-term responses in neuronal cells.
NO Signaling to Transcriptional Control
It has already been demonstrated that NO directly controls chromatin remodeling in cultured embryonic cortical neurons. This modulation is achieved by S-nitrosylation of histone deacetylase 2, which unbind the DNA and transcription may be turned on (49). Moreover, NO by means of S-nitrosylation regulates CREB/DNA binding and consequently CREB-dependent transcription in cortical neurons (50). In addition, NO has also been reported to directly regulate CREB phosphorylation through the sGC/cGMP/PKG pathway in embryonic chick retinal neurons (27). Compelling evidence in the literature show that NO tightly regulates the NF-κB signaling pathway in several experimental paradigms (51, 52). For instance, NO S-nitrosylates the p50 subunit of the NF-κB heterodimer decreasing its transcriptional activity, directly sensitizing prostate carcinoma cell lines to apoptosis (53). Moreover, NO S-nitrosylates IKKβ at Cys-179 inhibiting it, which renders NF-κB inactive in the cytoplasm (54). S-Nitrosylation also regulates p65/DNA binding activity and consequently NF-κB-dependent gene regulation in inflammation (55).
Motionless, herein we presented strong evidence that SVCT-2 expression is under control of the NO/cGMP/PKG/NF-κB signaling pathway in cultured chicken retinal neurons. Moreover, NO induced both IκB phosphorylation and NF-κB translocation to the cell nucleus; suggesting that NO activated NF-κB-dependent transcription to ultimately regulate SVCT-2 expression in cultured retinal cells. Therefore, we argue that NO modulates the activity of different sets of signaling molecules in our current model system to achieve altered signaling outcomes, e.g. control of cell survival (21), cell proliferation (25), and availability of neuromodulators (data herein).
NO and Control of SVCT-2 Synthesis: Role of NF-κB Signaling
In the SVCT-2 gene there are consensus motifs for both NF-κB and AP-1 transcription factors (7). Interestingly there are many reports in the literature showing that several signaling systems are related to NF-κB activation; for instance, A2a adenosine receptors (56), TGFβ receptors (57), NMDA receptors (58), and muscarinic receptors (59). Not surprisingly, all of these systems have already been correlated in some way with NO production (38, 60–62). It has also been demonstrated that NO/cGMP/PKG is capable of modulating NF-κB activation in cerebellar granule cells (52).
These findings are in high accordance with the data presented here showing that NO increases NF-κB transcriptional activity through a cGMP- and PKG-dependent manner in cultured retinal cells. From our knowledge, it is the first time that a positive regulation is demonstrated by NO of NF-κB activation in retinal cells as well as a suggested role of PKG/NF-κB in ascorbate transport. Moreover, this integrated signaling system may control Slc23a2 transcription and consequently SVCT-2 production. We suggest that the SVCT-2 protein is incorporated into the cellular membrane from its constitutive turnover, i.e. production (transcription and translation), transport (allocation and insertion), and operation in the plasmatic membrane (uptake); obviously with other levels of regulation in these processes. This suggestion is corroborated by our kinetics studies demonstrating that both SNAP and l-arginine increased the transport capacity for ascorbate (Vmax) but not the transport affinity (Km) of SVCT-2 for ascorbate. Furthermore, it is unlikely that NO promoted the insertion of pre-existing transporters (allocated in cytoplasmic vesicles) into the plasmatic membrane, because SNAP-induced ascorbate uptake was completely abolished by inhibiting both SVCT-2 transcription with actinomycin D and translation with either anisomycin or CHX; in addition, qRT-PCR data strongly suggest that SNAP increases mRNA content for SVCT-2 in our culture system. For these reasons, we suggest that NO promotes a de novo synthesis of SVCT-2 using PKG and NF-κB as transducing systems to increase ascorbate uptake in cultured retinal cells. However, we cannot completely rule out the possibility that NO-activated PKG modulates either the traffic or the activity of SVCT-2 by phosphorylation. Consensus motifs for PKC phosphorylation in the SVCT-2 protein have been described (3, 4); so whether PKG or even NO itself (by means of S-nitrosylation) exert some sort of post-translational control in SVCT-2 activity remains to be established and requires further investigation.
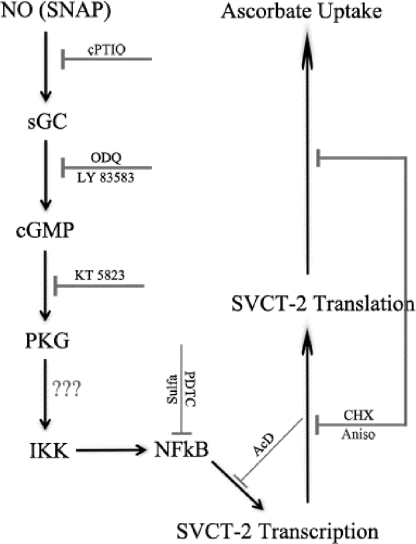
Overall, we have demonstrated that the NO signaling pathway is directly related with SVCT-2 transporter expression and, consequently, with ascorbate uptake in retinal cells (Fig. 10). Given that SVCT-2 promoter activity is under the control of NF-κB (7), in such a way, our data suggest that NO-regulated SVCT-2 expression and ascorbate uptake are achieved by a cGMP/PKG-dependent regulation of NF-κB transcriptional function.
FIGURE 10.
Schematic model of the nitric oxide signaling pathway regulating SVCT-2 expression and ascorbate uptake.
Acknowledgments
We thank Luzeli R. de Assis, Sarah A. Rodrigues, and Susana Bacelar for the technical assistance.
This work was supported in part by grants from Conselho Nacional de Desenvolvimento Científico e Tecnológico, Coordenação de Aperfeiçoamento de Pessoal de Nível Superior, Fundação de Amparo à Pesquisa de Estado do Rio de Janeiro, Programa de Apoio de Núcleos de Excelência/Ministério da Ciência e Tecnologia, and Projeto Estratégico C/SAU/UI3282/2011 (FCT, Portugal, and FEDER-COMPETE-POFC).
- SVCT
- sodium vitamin C co-transporters
- CREB
- cAMP response element-binding protein
- HBSS
- Hanks' balanced salt solution
- PKG
- cGMP-dependent protein kinase
- sGC
- soluble guanylyl cyclase
- AKT
- protein kinase B
- LY83583
- 6-anilinoquinoline-5,8-quinone
- ODQ
- 1H[1,2,4]oxadiazole[4,3-a]quinoxalin-one
- SNAP
- S-nitroso-N-acetyl-dl-penicillamine
- Zaprinast
- 1,4-dihydro-5-(2-propoxyphenyl)-7H-1,2,3-triazolo(4,5-d)pyrimidin-7-one
- cPTIO
- 2-(4-carboxyphenyl)-4,4,5,5-tetramethylimidazoline-1-oxyl-3-oxide, potassium salt
- E8
- 8-day-old chick embryo retinas
- l-NAME
- Nω-nitro-l-arginine methyl ester hydrochloride
- 7-NI
- 7-nitroindazole
- NF-κB
- nuclear factor κ light chain enhancer of activated B cells
- IκB
- inhibitor of κB
- IKK
- IκB kinase
- rpL27
- ribosomal protein L27
- CHX
- cycloheximide
- PDTC
- 1-pyrrolidinecarbodithioic acid ammonium salt
- TEMED
- N,N,N′,N′-tetramethylethylenediamine.
REFERENCES
- 1. Qiu S., Li L., Weeber E. J., May J. M. (2007) J. Neurosci. Res. 85, 1046–1056 [DOI] [PubMed] [Google Scholar]
- 2. Majewska M. D., Bell J. A., London E. D. (1990) Brain Res. 537, 328–332 [DOI] [PubMed] [Google Scholar]
- 3. Tsukaguchi H., Tokui T., Mackenzie B., Berger U. V., Chen X. Z., Wang Y., Brubaker R. F., Hediger M. A. (1999) Nature 399, 70–75 [DOI] [PubMed] [Google Scholar]
- 4. Daruwala R., Song J., Koh W. S., Rumsey S. C., Levine M. (1999) FEBS Lett. 460, 480–484 [DOI] [PubMed] [Google Scholar]
- 5. Wang Y., Mackenzie B., Tsukaguchi H., Weremowicz S., Morton C. C., Hediger M. A. (2000) Biochem. Biophys. Res. Commun. 267, 488–494 [DOI] [PubMed] [Google Scholar]
- 6. Savini I., Rossi A., Pierro C., Avigliano L., Catani M. V. (2008) Amino Acids 34, 347–355 [DOI] [PubMed] [Google Scholar]
- 7. Savini I., Rossi A., Catani M. V., Ceci R., Avigliano L. (2007) Biochem. Biophys. Res. Commun. 361, 385–390 [DOI] [PubMed] [Google Scholar]
- 8. Carey D. J., Todd M. S. (1987) Brain Res. 429, 95–102 [DOI] [PubMed] [Google Scholar]
- 9. Eldridge C. F., Bunge M. B., Bunge R. P., Wood P. M. (1987) J. Cell Biol. 105, 1023–1034 [DOI] [PMC free article] [PubMed] [Google Scholar]
- 10. Goto K., Tanaka R. (1981) Brain Res. 207, 239–244 [DOI] [PubMed] [Google Scholar]
- 11. Ng Y. C., Akera T., Han C. S., Braselton W. E., Kennedy R. H., Temma K., Brody T. M., Sato P. H. (1985) Biochem. Pharmacol. 34, 2525–2530 [DOI] [PubMed] [Google Scholar]
- 12. Lam K. W., Zwaan J., Garcia A., Shields C. (1993) Exp. Eye Res. 56, 601–604 [DOI] [PubMed] [Google Scholar]
- 13. Portugal C. C., Miya V. S., Calaza Kda C., Santos R. A., Paes-de-Carvalho R. (2009) J. Neurochem. 108, 507–520 [DOI] [PubMed] [Google Scholar]
- 14. Bredt D. S., Snyder S. H. (1990) Proc. Natl. Acad. Sci. U.S.A. 87, 682–685 [DOI] [PMC free article] [PubMed] [Google Scholar]
- 15. Wiesinger H. (2001) Prog. Neurobiol. 64, 365–391 [DOI] [PubMed] [Google Scholar]
- 16. Stone J. R., Marletta M. A. (1994) Biochemistry 33, 5636–5640 [DOI] [PubMed] [Google Scholar]
- 17. Knowles R. G., Palacios M., Palmer R. M., Moncada S. (1989) Proc. Natl. Acad. Sci. U.S.A. 86, 5159–5162 [DOI] [PMC free article] [PubMed] [Google Scholar]
- 18. Krumenacker J. S., Hanafy K. A., Murad F. (2004) Brain Res. Bull. 62, 505–515 [DOI] [PubMed] [Google Scholar]
- 19. Jaffrey S. R., Snyder S. H. (1995) Annu. Rev. Cell Dev. Biol. 11, 417–440 [DOI] [PubMed] [Google Scholar]
- 20. Hess D. T., Matsumoto A., Kim S. O., Marshall H. E., Stamler J. S. (2005) Nat. Rev. Mol. Cell Biol. 6, 150–166 [DOI] [PubMed] [Google Scholar]
- 21. Mejía-García T. A., Paes-de-Carvalho R. (2007) J. Neurochem. 100, 382–394 [DOI] [PubMed] [Google Scholar]
- 22. Liu L., Stamler J. S. (1999) Cell Death Differ. 6, 937–942 [DOI] [PubMed] [Google Scholar]
- 23. Boehning D., Snyder S. H. (2003) Annu. Rev. Neurosci. 26, 105–131 [DOI] [PubMed] [Google Scholar]
- 24. Peunova N., Enikolopov G. (1995) Nature 375, 68–73 [DOI] [PubMed] [Google Scholar]
- 25. Magalhães C. R., Socodato R. E., Paes-de-Carvalho R. (2006) Int. J. Dev. Neurosci. 24, 53–60 [DOI] [PubMed] [Google Scholar]
- 26. Cossenza M., Paes de Carvalho R. (2000) J. Neurochem. 74, 1885–1894 [DOI] [PubMed] [Google Scholar]
- 27. Socodato R. E., Magalhães C. R., Paes-de-Carvalho R. (2009) J. Neurochem. 108, 417–429 [DOI] [PubMed] [Google Scholar]
- 28. Gilmore T. D. (2006) Oncogene 25, 6680–6684 [DOI] [PubMed] [Google Scholar]
- 29. Karin M., Ben-Neriah Y. (2000) Annu. Rev. Immunol. 18, 621–663 [DOI] [PubMed] [Google Scholar]
- 30. Rothwarf D. M., Zandi E., Natoli G., Karin M. (1998) Nature 395, 297–300 [DOI] [PubMed] [Google Scholar]
- 31. Kanarek N., London N., Schueler-Furman O., Ben-Neriah Y. (2010) Cold Spring Harbor Perspect. Biol. 2, a000166. [DOI] [PMC free article] [PubMed] [Google Scholar]
- 32. Maniatis T. (1997) Science 278, 818–819 [DOI] [PubMed] [Google Scholar]
- 33. Song S. H., Min H. Y., Han A. R., Nam J. W., Seo E. K., Seoung Woo Park, Sang Hyung Lee, Sang Kook Lee. (2009) Int. Immunopharmacol. 9, 298–302 [DOI] [PubMed] [Google Scholar]
- 34. Aktan F. (2004) Life Sci. 75, 639–653 [DOI] [PubMed] [Google Scholar]
- 35. Paes de Carvalho R., de Mello F. G. (1982) J. Neurochem. 38, 493–500 [DOI] [PubMed] [Google Scholar]
- 36. Socodato R., Brito R., Calaza K. C., Paes-de-Carvalho R. (2011) J. Neurochem. 116, 227–239 [DOI] [PubMed] [Google Scholar]
- 37. Pfaffl M. W. (2001) Nucleic Acids Res. 29, e45. [DOI] [PMC free article] [PubMed] [Google Scholar]
- 38. Garthwaite J., Garthwaite G. (1987) J. Neurochem. 48, 29–39 [DOI] [PubMed] [Google Scholar]
- 39. Rameau G. A., Chiu L. Y., Ziff E. B. (2003) Neurobiol. Aging 24, 1123–1133 [DOI] [PubMed] [Google Scholar]
- 40. Jagnandan D., Sessa W. C., Fulton D. (2005) Am. J. Physiol. Cell Physiol 289, C1024-C1033 [DOI] [PubMed] [Google Scholar]
- 41. Harrison F. E., May J. M. (2009) Free Radic. Biol. Med. 46, 719–730 [DOI] [PMC free article] [PubMed] [Google Scholar]
- 42. Venugopal M., Jamison J. M., Gilloteaux J., Koch J. A., Summers M., Giammar D., Sowick C., Summers J. L. (1996) Life Sci. 59, 1389–1400 [DOI] [PubMed] [Google Scholar]
- 43. Makino Y., Sakagami H., Takeda M. (1999) Anticancer Res. 19, 3125–3132 [PubMed] [Google Scholar]
- 44. Grant M. M., Barber V. S., Griffiths H. R. (2005) Proteomics 5, 534–540 [DOI] [PubMed] [Google Scholar]
- 45. Huang J., May J. M. (2006) Brain Res. 1097, 52–58 [DOI] [PubMed] [Google Scholar]
- 46. González-Polo R. A., Soler G., Rodríguezmartín A., Morán J. M., Fuentes J. M. (2004) Cell Biol. Int. 28, 373–380 [DOI] [PubMed] [Google Scholar]
- 47. Li X., Huang J., May J. M. (2003) Biochem. Biophys. Res. Commun. 305, 656–661 [DOI] [PubMed] [Google Scholar]
- 48. Brahma B., Forman R. E., Stewart E. E., Nicholson C., Rice M. E. (2000) J. Neurochem. 74, 1263–1270 [DOI] [PubMed] [Google Scholar]
- 49. Nott A., Watson P. M., Robinson J. D., Crepaldi L., Riccio A. (2008) Nature 455, 411–415 [DOI] [PubMed] [Google Scholar]
- 50. Riccio A., Alvania R. S., Lonze B. E., Ramanan N., Kim T., Huang Y., Dawson T. M., Snyder S. H., Ginty D. D. (2006) Mol. Cell 21, 283–294 [DOI] [PubMed] [Google Scholar]
- 51. Marshall H. E., Hess D. T., Stamler J. S. (2004) Proc. Natl. Acad. Sci. U.S.A. 101, 8841–8842 [DOI] [PMC free article] [PubMed] [Google Scholar]
- 52. Bonthius D. J., Luong T., Bonthius N. E., Hostager B. S., Karacay B. (2009) Neuropharmacology 56, 716–731 [DOI] [PubMed] [Google Scholar]
- 53. Huerta-Yepez S., Vega M., Jazirehi A., Garban H., Hongo F., Cheng G., Bonavida B. (2004) Oncogene 23, 4993–5003 [DOI] [PubMed] [Google Scholar]
- 54. Reynaert N. L., Ckless K., Korn S. H., Vos N., Guala A. S., Wouters E. F., van der Vliet A., Janssen-Heininger Y. M. (2004) Proc. Natl. Acad. Sci. U.S.A. 101, 8945–8950 [DOI] [PMC free article] [PubMed] [Google Scholar]
- 55. Kelleher Z. T., Matsumoto A., Stamler J. S., Marshall H. E. (2007) J. Biol. Chem. 282, 30667–30672 [DOI] [PubMed] [Google Scholar]
- 56. Fredholm B. B., Chern Y., Franco R., Sitkovsky M. (2007) Prog. Neurobiol. 83, 263–276 [DOI] [PubMed] [Google Scholar]
- 57. Gingery A., Bradley E. W., Pederson L., Ruan M., Horwood N. J., Oursler M. J. (2008) Exp. Cell Res. 314, 2725–2738 [DOI] [PMC free article] [PubMed] [Google Scholar]
- 58. Lipsky R. H., Xu K., Zhu D., Kelly C., Terhakopian A., Novelli A., Marini A. M. (2001) J. Neurochem. 78, 254–264 [DOI] [PubMed] [Google Scholar]
- 59. Profita M., Bonanno A., Siena L., Ferraro M., Montalbano A. M., Pompeo F., Riccobono L., Pieper M. P., Gjomarkaj M. (2008) Eur. J. Pharmacol. 582, 145–153 [DOI] [PubMed] [Google Scholar]
- 60. Araújo A. V., Ferezin C. Z., Rodrigues G. J., Lunardi C. N., Vercesi J. A., Grando M. D., Bonaventura D., Bendhack L. M. (2011) Vascul. Pharmacol. 54, 44–51 [DOI] [PubMed] [Google Scholar]
- 61. Dai S. S., Zhou Y. G., Li W., An J. H., Li P., Yang N., Chen X. Y., Xiong R. P., Liu P., Zhao Y., Shen H. Y., Zhu P. F., Chen J. F. (2010) J. Neurosci. 30, 5802–5810 [DOI] [PMC free article] [PubMed] [Google Scholar]
- 62. Lee N. P., Cheng C. Y. (2003) Endocrinology 144, 3114–3129 [DOI] [PubMed] [Google Scholar]


