

Abstract
The endogenous circadian clock of the mammalian suprachiasmatic nucleus (SCN) can be reset by light to synchronize the biological clock of the brain with the external environment. This process involves induction of immediate-early genes such as the circadian clock gene Period1 (Per1) and results in a stable shift in the timing of behavioral and physiological rhythms on subsequent days. The mechanisms by which gene activation permanently alters the phase of clock neuron activity are unknown. To study the relationship between acute gene activation and persistent changes in the neurophysiology of SCN neurons, we recorded from SCN neurons marked with a dynamic green fluorescent protein (GFP) reporter ofPer1 gene activity. Phase-resetting light pulses resulted in Per1 induction in a distinct subset of SCN neurons that also exhibited a persistent increase in action potential frequency 3–5 hr after a light pulse. By simultaneously quantifyingPer1 gene activation and spike frequency in individual neurons, we found that the degree of Per1 induction was highly correlated with neuronal spike frequency on a cell-by-cell basis. Increased neuronal activity was mediated by membrane potential depolarization as a result of a reduction in outward potassium current. Double-label immunocytochemistry revealed that vasoactive intestinal peptide (VIP)-expressing cells, but not arginine vasopressin (AVP)-expressing cells, exhibited significant Per1induction by light pulses. Rhythmic GFP expression occurred in both VIP and AVP neurons. Our results indicate that the steps that link acute molecular events to permanent changes in clock phase involve persistent suppression of potassium current, downstream of Per1gene induction, in a specific subset of Per1-expressing neurons enriched for VIP.
Keywords: suprachiasmatic nucleus, circadian rhythms, GFP, transgenic mice, electrophysiology, gene expression, transcription factors, potassium channels, vasoactive intestinal peptide, arginine vasopressin, entrainment
Introduction
Virtually all eukaryotes, including humans, have an endogenous biological clock that acts as an internal representation of the solar cycle. In mammals, the suprachiasmatic nucleus (SCN) of the hypothalamus is a master pacemaker capable of self-sustained rhythms generation, with an intrinsic period of ∼1 d (Moore and Eichler, 1972; Stephan and Zucker, 1972; Ralph et al., 1990; Refinetti et al., 1994). Circadian rhythms generation is cell autonomous and dependent on cyclic gene expression mediated by intracellular molecular feedback loops (for review, see Panda et al., 2002a; Wang and Sehgal, 2002). A prominent feature of neural biological clocks in species as diverse as mollusks and mammals are clock-driven circadian rhythms in the frequency of spontaneous action potentials (Inouye and Kawamura, 1979; McMahon and Block, 1987; Welsh et al., 1995; Liu et al., 1997; Herzog et al., 1998). Rhythmic electrical activity communicates the endogenously generated oscillations within clock neurons to overt rhythmic outputs, such as locomotor behavior (Schwartz et al., 1987). Importantly, the SCN not only generates rhythmicity but is also synchronized, or entrained, to the daily light cycle of the environment (Pittendrigh and Daan, 1976).
The Period1 (Per1) gene is a key participant in the molecular feedback loop that generates circadian rhythms and is critically involved in resetting the endogenous neural clock to light signals (Akiyama et al., 1999; Albrecht et al., 2001; Bae et al., 2001;Zheng et al., 2001) (but see Cermakian et al., 2001). The process by which light resets the circadian clock involves cellular and molecular events taking place on both rapid and prolonged time scales. First, there are retinally driven acute responses of SCN neurons to light (Meijer et al., 1998). These responses are limited to the interval of light exposure but are followed within minutes by rapid induction of a number of genes in the SCN, including Per1 (Albrecht et al., 1997; Shearman et al., 1997; Shigeyoshi et al., 1997). The molecular response to light initiates a cascade that ultimately results in a shift in the timing of molecular oscillations, rhythmic electrical activity, and rhythmic behavior on subsequent daily cycles (Pittendrigh and Daan, 1976; Gillette et al., 1995; Yamazaki et al., 2000).
The specific events that link rapid Per1 induction to subsequent changes in oscillator neuron output are uncharacterized. To study changes in the neurophysiology of SCN cells after light-inducedPer1 activation, we performed targeted electrophysiological recording of SCN neurons marked with a short half-life green fluorescent protein (GFP) reporter of Per1 gene activity. Here, Per1-driven GFP fluorescence intensity is a real-time indicator of the level of Per1 gene expression in living cells (Kuhlman et al., 2000). The dynamic GFP reporter ofPer1 activation allowed us to discriminate between neurons in which Per1 was acutely induced by light and neurons that did not respond to light stimulation with rapid Per1 gene induction.
We also studied the neuronal populations involved in SCN resetting. Light information reaches SCN neurons via the retinohypothalamic tract (RHT), a monosynaptic projection from the retina to the SCN (Moore, 1973). Immediate-early gene and Per1 induction in response to light is regional and restricted to subpopulations of SCN cells (Aronin et al., 1990; Rusak et al., 1990; Shigeyoshi et al., 1997;Morris et al., 1998; Abrahamson and Moore, 2001). We used double-label immunocytochemistry to determine the neuropeptide content ofPer1 light-induced SCN neurons.
Materials and Methods
Transgenic mice. B6C3HF1 hybrid mice (Harlan Sprague Dawley, Indianapolis, IN) were crossed with University of Kentucky bred B6C3HF5–6 mice homozygous for themPer1:: d2EGFP transgene (Kuhlman et al., 2000), to produce mice hemizygous for the transgene.
Photic stimulation paradigm. The general paradigm of the light-stimulation protocol was as follows. Male mice were maintained in a 12 hr light/dark cycle and then individually housed for at least 2 d before the experiment. Zeitgeber time 0/24 (ZT 0 or ZT 24) is defined as the time of lights on and ZT 12 as the time of lights off. Photic stimulation consisted of a light pulse of 900 lux for 30 min or sham (no light) beginning at ZT 22.25 (except when noted). Animals were held in darkness for 1.5 hr after termination of the light pulse, and then SCN brain slices were prepared as described below at ZT 0.25, corresponding to 0.25 hr after the lights would have turned on in the former light cycle. Slices were allowed to stabilize for 1 hr before electrophysiological recordings were made. Recordings were made from ZT 1.25 to ZT 3.25 (3–5 hr after the initiation of the light pulse). Data collected within this time window were pooled and averaged. Using this paradigm, we avoided making slices during a phase that slice preparation itself could induce phase resetting (Gillette et al., 1995).
Slice preparation and electrophysiological recordings.Brains were removed and blocked in cold, oxygenated 95%O2–5%CO2 artificial CSF [in mm: 114.5 NaCl, 3.5 KCL, 1 NaH2PO4, 1.3 MgSO4, 2.5 CaCl, 10d(+)-glucose, and 35.7 NaCHO3]. SCN slices (220 μm) were cut on a vibroslicer (World Precision Instruments, Sarasota, Fl) at 4–10°C, trimmed to rectangles ∼4 × 8 mm, and transferred directly to an open recording chamber. Slices were allowed to recover for 1 hr before recording. SCN neurons were visualized using an Axioskop FS2 (Zeiss, Thornwood, NY) equipped with near-infrared (IR)–differential interference contrast and fluorescence optics. Each experimental treatment contains data from three to five animals unless noted. All recordings were confirmed to be from GFP-positive neurons by aligning digital images of the same neuron under near-IR and GFP fluorescence illumination. Extracellular patch electrodes were filled with extracellular solution. Firing frequency was measured as the average of a 270 sec record. Whole-cell recordings were made with pipettes filled with intracellular solution (in mm: 135 K-gluconate, 10 KCl, 10 HEPES, and 0.5 EGTA) having a resistance of 2 MΩ. Extracellular solution [in mm: 124 NaCl, 3.5 KCl, 1 NaH2PO4, 1.3 MgSO4, 2.5 CaCl2, 10d(+)-glucose, and 20 NaHCO3] was heated and perfused at a rate of 1.5–2 ml/min. For experiments in which the extracellular solution contained 30 mm tetraethylammonium (TEA), sodium chloride was reduced to 94 mm. The perfusate within the recording chamber (Warner Instruments, Hamden, CT) was maintained at a temperature of 34 ± 0.5°C. The liquid junction potential was nulled after seal formation, before membrane rupture. Data were acquired using Axopatch 1D amplifier and pClamp7 software (Axon Instruments, Union City, CA). Data were filtered through a low-pass 2 kHz filter and digitized at a sampling rate of 5 kHz. Series resistance was typically 8–11 MΩ. Whole-cell capacitance was read from the amplifier compensation circuit. Drugs were purchased from Sigma (St. Louis, MO).
All whole-cell data were collected in current-clamp mode. Input resistance and membrane time constants were calculated by injecting a 500 msec square hyperpolarizing current. The initial peak voltage deflection in response to current injection that brought the membrane potential within the range of −65 to −70 mV (5–15 pA of injected negative current) was fitted with a monoexponential function to determine the membrane time constant. At least three fits per neuron were averaged. Input resistance was calculated as the slope of the voltage responses to −5 to −25 pA of current injection. Membrane potential was calculated as the average voltage for a duration of 500 msec. In the case of spiking neurons, this value was identical to the voltage at the midpoint of the interspike interval. Because not all neurons of the sham condition displayed spontaneous action potentials frequently enough to determine a midpoint of interspike interval, we chose to use the average voltage over 500 msec to ensure that calculations were consistent across conditions. Criteria for accepting a recording included the following: action potential peak of at least +8 mV and, in voltage-clamp mode, <30 pA holding current to clamp membrane potential at −65 mV. All data were collected within 6 min of membrane rupture to minimize any potential washout effects from the whole-cell recording (Schaap et al., 1999). Student's ttests were used to determine significant differences between two groups when data were normally distributed. In the case when data did not fit a normal distribution, a Mann–Whitney U test was used to determine significance. Additionally, for all reported significant differences using Student's t test, data were also significantly different using the Mann–Whitney test. A two-way repeated-measures ANOVA was used to determine the presence of an interaction between light pulse (LP+) versus no light pulse (LP−) and drug treatment, with α set to 0.05. In the case of a significant interaction, a one-way repeated-measures ANOVA (paired ttest) was used to determine significance before and after drug treatment for LP+ versus LP−. Error bars report ± SEM.
Imaging. For imaging, acute SCN slices (see Fig. 1) were prepared as above at ZT 1.5 ± 0.25 (3–3.5 hr after light treatment, the same time as the electrophysiological recordings), and SCN slices were cut at 180 μm. Images were captured with a cooled CCD camera (Micromax with EEV57 chip; Princeton Instruments, Trenton, NJ) using an FITC filter set and analyzed using WinView software (Roper Scientific, Trenton, NJ) using 16-bit digitization. A standardized region of interest (ROI) was placed over the SCN, using the third ventricle and optic chiasm as reference points, and the average pixel intensity was recorded from at least two slices containing SCN per animal and averaged (both sides of a slice were imaged so that each animal was represented by at least four images of SCN nuclei). Background fluorescence was subtracted for each image by placing an ROI outside of the SCN. Student's t test was used to determine statistical significance, and error bars report ±SEM. For time-lapse imaging (see Fig. 5), slices were prepared and maintained as for physiological recording.
Fig. 1.

SCN Per1-driven GFP fluorescence increases in response to behavioral phase-shifting light treatment administered at ZT 22.25. A, Fluorescence was induced by ninefold after photic stimulation (right) (n = 4 each group; p < 0.005). Examples of coronal sections of bilateral SCN acutely imaged 3–3.5 hr after light (LP+; bottom) and no light treatment (LP−;top) are shown on the left. Scale bar, 50 μm. B, Example of a stable phase advance in the timing of spontaneous wheel-running behavior in response to photic stimulation (at ZT 22.25) of an individual animal.
Fig. 5.

Time-lapse imaging of Per1-driven GFP fluorescence in a single SCN nucleus in the coronal plane after light treatment at ZT 22.25. Left, Three hours after photic stimulation. Right, Same SCN 6 hr after photic stimulation. Crosshairs indicate matchedx,y coordinates for visual reference. Scale bar, 10 μm.
To assess the functional relationship between neuronal activity andPer1-driven fluorescence (see Fig. 2), GFP fluorescence was imaged using the same cooled CCD camera as above at high magnification (63× Zeiss objective, 0.90 numerical aperture, narrow-band GFP filter set; Chroma Technology, Brattleboro, VT). Fluorescence was reported as the intensity of the cell body divided by the background fluorescence to normalize for differences in baseline fluorescence across preparations and fields. Background was defined as the average pixel intensity of two local measurements next to the recorded neuron and the total frame (512 × 512 pixels).
Fig. 2.

Increase in neuronal activity inPer1-expressing neurons in response to photic stimulation. A, Graph, In response to phase-advancing treatment given at ZT 22.25, spontaneous action potential (A.P.) frequency ofPer1-fluorescent neurons located in the ventral subdivision was significantly increased in the light-treated group (LP+; n = 23) compared with no light (LP−;n = 22; p < 0.001). In response to phase-delaying treatment given at ZT 15, action potential frequency of Per1-fluorescent neurons was significantly increased in the LP+ condition (n = 8) compared with the LP− condition (n = 10; Mann–WhitneyU sum; p < 0.001). In response to phase-advancing treatment (ZT 22.25), neurons expressing low levels of fluorescence (non-induced; n = 10) had significantly lower action potential frequency compared with neurons expressing high levels of fluorescence (induced; n= 11) neurons within the same slice (p < 0.001). Left, Examples of individual extracellular recordings, 5 sec in duration. Top, Treatment given at ZT 22.25: LP−, left; LP+, right.Middle, Treatment given at ZT 15: LP−,left; LP+, right. Bottom, Traces from a single SCN slice after a light pulse given at ZT 22.25, a neuron expressing dim fluorescence (left), and a neuron expressing bright fluorescence (right).B, After light treatment, Per1-driven fluorescence within one SCN slice was correlated with action potential (A.P.) generation (linear regression;r2 = 0.86; standard error of estimates, 1.29; n = 15; p < 0.001) on an individual neuron basis.
To classify cells as dim versus bright (see Fig. 2), fluorescent cells within the same field of view were selected for recording. Cells were classified as dim when fluorescent intensity was 10% or less above background. On average, induced neurons expressed fluorescence levels fivefold higher than non-induced (dim, 4.01 ± 0.8%; bright, 20.4 ± 2.7% above background). Signal above background was calculated as above. Recordings were made at the medial/ventral border, and, in every case, there was a least one dim cell and one bright cell within the same field of view, ensuring that the differences in relative fluorescence was not attributable to systematic bleaching of a particular zone.
Immunocytochemistry, animals, and housing. mPer1:: d2EGFP transgenic mice (n = 12) were housed in translucent propylene cages (48 × 27 × 20 cm) and provided with ad libitum access to food and water. They were kept in a 12 hr light/dark cycle. The room was kept at 21 ± 1°C. Before starting the experiment proper, we tested the effect of colchicine on GFP expression. For this purpose, animals (n = 12) were anesthetized (60 mg/kg ketamine and 5 mg/kg xylazine) and administered colchicine (20 μg in 10 μl saline, or vehicle) in the lateral ventricle at ZT 24. The next day, they were killed with an overdose of sodium pentobarbital (200 mg/kg) at ZT 24 after a 30 min light pulse at ZT 21 (experimental condition) or at ZT24 (control condition). Once it was established that colchicine did not interfere with GFP expression, experimental animals (n = 12) were anesthetized for colchicine administration and killed the next day at ZT 10 or ZT 24, or at ZT 24 after a light pulse at ZT 21 as described above. All handling of animals was done in accordance with Institutional Animal Care and Use Committee guidelines of Columbia University.
Tissue preparation. Mice were perfused intracardially with 50 ml of 0.9% saline, followed by 100 ml of 4% paraformaldehyde in 0.1 m phosphate buffer, pH 7.3. Brains were postfixed for 18–24 hr at 4°C and cryoprotected in 20% sucrose in 0.1 m phosphate buffer. Sections (40 μm) were cut on a cryostat and, alternate sections were stained for double-label fluorescence for arginine vasopressin (AVP)-GFP and vasoactive intestinal peptide (VIP)-GFP [guinea pig polyclonal antisera against AVP (1:5000) or VIP (1:5000); DiaSorin, Stillwater, MN] and rabbit polyclonal antisera against GFP (1:20,000; Molecular Probes, Eugene, OR). GFP was visualized with avidin-conjugated fluorescent Cy3 (Jackson ImmunoResearch, West Grove, PA) and the other peptides with fluorescent Cy2 conjugated to the secondary antibody. The sections were mounted and coverslipped with gelmount and coverglass number 1½.
Cell counts. Sections through the entire SCN were observed under a Nikon (Tokyo, Japan) E800 microscope and captured with a cool CCD camera (Diagnostic Instruments, Sterling Heights, MI) using Adobe Photoshop 5.0 (Adobe Systems, San Jose, CA). Single- and double-labeled cells were counted. Because the total number of GFP-positive cells were counted on all sections, the Abercrombie correction factor (Abercrombie, 1946) was applied. The average diameter of the GFP cells was 9.7 ± 0.06 μm, calculated from the perimeter measured in 40 cells using the NIH Image program. The number of cells was determined as follows: N =n(T/T + D), whereT is section thickness (40 μm), and D is cell diameter (9.7 μm; correction factor of 0.805).
To confirm that not all cells were double labeled (pale staining in double-labeled cells is not always visible under light microscopy), sections from each animal were also observed under a ZeissAxiovert 100TV fluorescence microscope with a Zeiss LSM 410 laser scanning confocal attachment. The sections were excited with an argon–krypton laser using the excitation wavelengths of 568 nm (for Cy3) and 488 nm (for Cy2). The images were collected as 1 μm multitract optical sections every 2 μm (with sequential excitation by each laser to avoid cross-talk between the two wavelengths). Using the LSM 3.95 software (Zeiss), red and green images of the sections were superimposed.
Results
The physiologic properties ofPer1-expressing neurons were studied in living SCN slices after a phase-shifting nocturnal light pulse was delivered to the intact animal. We used transgenic mice in which sequences of thePeriod1 promoter drive expression of a short half-life form of green fluorescent protein (Kuhlman et al., 2000).
We first quantified the effects of a phase-advancing light pulse onPer1 induction in the SCN and on behavioral rhythmicity. Animals received a 30 min light pulse or sham treatment (no light) beginning at ZT 22.25. After the light pulse, animals were held in darkness for 2.5–3 hr, brains were removed, and slices were made for acute imaging (approximately ZT 1.5) to obtain a “snap shot” ofPer1-driven GFP fluorescence in the SCN (Fig.1A). A ninefold increase in GFP fluorescence of the SCN as a whole was observed in the LP+ condition compared with no light (LP+, 36.0 ± 6.0%; LP−, 3.9 ± 0.8% above background; n = 4 each group;p < 0.05; Mann–Whitney U test) (Fig.1A). Induction of Per1 fluorescence tended to be most intense in the ventral region. Fluorescence was uniformly low in the LP− condition.
Because the behavioral effect of light administered in the late night can vary depending on mouse strains, we confirmed the phase-advancing effect of the ZT 22.25 light pulse in Per1-GFP mice. Mice housed in constant darkness in cages equipped with running wheels phase advanced the timing of their spontaneous wheel-running activity in response to a 30 min light pulse given at circadian time 22.25. The average shift was 1.04 ± 0.24 hr, ranging from 0.4 to 2.0 hr (n = 6) (Fig. 1B).
Neuronal activity increased inPer1-induced neurons
The frequency of spontaneous action potentials in SCN neurons from animals receiving the ZT 22.25 phase-advancing light-pulse (LP+) was compared with that of neurons from animals receiving no light treatment (LP−). Extracellular recordings made 3–5 hr after the 30 min light stimulation (approximately ZT 1.25–3.25) revealed that the spontaneous firing rate of Per1-fluorescent neurons in SCN slices from light-treated animals was 2.4-fold greater than in animals receiving no light (Fig. 2A). The mean firing rate for LP+ was 3.1 ± 0.5 Hz (n = 23), and the mean firing rate for LP− was 1.3 ± 0.37 Hz (n = 21; p < 0.005; Mann–WhitneyU test).
In addition to examining firing rate in response to a phase-advancing light treatment, neuronal activity was also examined after a light treatment given in the early night, which produces a phase-delaying action on the SCN pacemaker in these mice (Le Sauter et al., 2003). For these experiments, animals were given a 30 min light pulse in the early night beginning at ZT 15 (3 hr after lights off), SCN slices were made at ZT 16, and recordings were made from ZT 17–ZT 18. As with the advancing light treatments, spontaneous action potential frequency was significantly higher inPer1-expressing neurons from animals of the phase-delaying light treatment condition (LP+, 4.27 ± 0.51 Hz; n= 8) compared with animals receiving no light (LP−, 0.17 ± 0.10 Hz; n = 10; p < 0.001; Mann–WhitneyU test) (Fig. 2A).
We next compared the spontaneous spike frequency ofPer1-induced neurons (bright GFP fluorescence) to non-induced Per1-fluorescent neurons (dim GFP fluorescence; for fluorescent quantification details, see Materials and Methods) within slice preparations from animals receiving light treatment.Per1-induced neurons displayed a fourfold increase in spontaneous firing rate (3.18 ± 0.51 Hz; n = 11) 3–5 hr after photic stimulation compared with Per1 neurons in which Per1 was not induced during this time window (0.77 ± 0.24 Hz; n = 12; p < 0.005; Mann–Whitney U test) (Fig. 2A). These results indicate that phase-shifting light treatments evoke a persistent change in the neurophysiology of SCN neurons afterPer1 induction and that there is heterogeneity in the responsiveness of Per1-expressing SCN neurons to light.
To further define the relationship between mPer1 gene activity and neuronal activity, we quantified the degree ofPer1 induction versus spike frequency on an individual neuron basis by combining quantitative fluorescence imaging and extracellular recording of living SCN neurons. ThePer1-driven GFP fluorescence intensity of SCN neurons ranged over a 10-fold difference (3.9–41.4% above background), and there was a corresponding 10.4 Hz difference in spontaneous firing rate (0.01–10.5 Hz). The relationship between Per1 gene activity and action potential frequency was well fit by a linear relationship (Fig. 2B). These results demonstrate that degree ofPer1 promoter activation in individual neurons predicts the rate of spontaneous neuronal activity during the initial hours after nocturnal photic stimulation. It should be noted that, within the restricted time frame examined (ZT 1.25–ZT 3.25), neither fluorescence intensity nor firing rate was correlated with time of data collection for a cell, and thus these data represent a sampling of neurons in different functional states of activity after light treatment rather than progression of ongoing temporal processes.
Intrinsic membrane properties are modified afterPer1 induction
The elevated spike rates recorded in Per1-induced neurons after photic stimulation could be attributable to increased synaptic drive or a change in intrinsic excitability. To distinguish between the two possibilities, the underlying membrane properties of light-induced Per1-expressing neurons were characterized and then examined in the presence of agents designed to significantly reduce synaptic communication.
Whole-cell current-clamp recordings of light-inducedPer1-fluorescent neurons from the LP+ condition were made and compared with Per1-fluorescent neurons recorded from the LP− condition. Resting membrane potential was found to be depolarized by 5.5 mV, and input resistance was 690 MΩ higher in light-inducedPer1-fluorescent neurons (LP+,Vrest, −43.8 ± 1.15 mV;Rin, 1.69 ± 0.19 GΩ) compared with no light treatment (LP−, Vrest, −49.3 ± 0.95 mV, n = 13 each group,p < 0.005; Rin, 1.01 ± 0.08 GΩ, n = 13 each group,p < 0.005, Mann–Whitney U test) (Fig.3). Accordingly, the membrane time constant was also significantly increased in the LP+ condition compared with the LP− condition (LP+, 33.6 ± 2.6 msec; LP−, 22.5 ± 1.2 msec; p < 0.005). Furthermore, there was also not a significant difference in whole-cell capacitance (LP−, 11.60 ± 0.13 pF; LP+, 11.79 ± 0.26 pF), ruling out the possibility that the change in input resistance was attributable to differences in cell size.
Fig. 3.
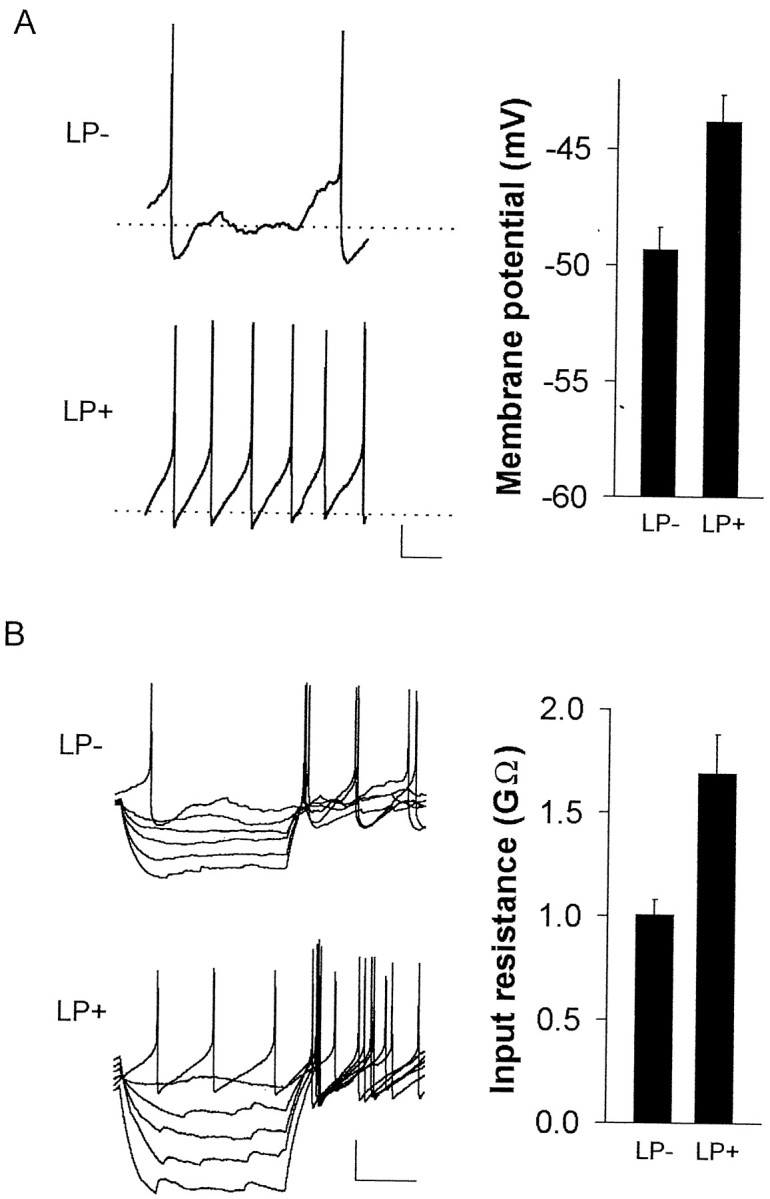
Photic stimulation alters both membrane potential and input resistance of Per1-expressing neurons.A, Graph, Membrane potential was significantly depolarized in the LP+ condition compared with LP− (n = 13 each group; p < 0.005). Left, Examples of individual whole-cell, current-clamp recordings from LP− (top) and LP+ (bottom) conditions. Calibration: 10 mV, 200 msec.B, Graph, Input resistance was significantly increased in the LP+ condition compared with LP− (same cells as above; n = 13 each group;p < 0.005). Left, Examples of individual whole-cell, current-clamp recordings from LP− (top) and LP+ (bottom) conditions showing voltage deflections in response to 5 pA steps of hyperpolarizing current. Calibration: 20 mV, 200 msec.
The changes in membrane properties in response to light persisted when synaptic communication in slices was reduced by tetrodotoxin (TTX) (1 μm) to block spike-mediated transmitter release and bicuculline methiodine (Bic) (12.5 μm) to block a principal class of receptors for GABA, the most pervasive chemical transmitter within the SCN. In the presence of TTX–Bic, light-inducedPer1-fluorescent neurons were also depolarized and exhibited increased input resistance (Δ6.0 mV and Δ1.21 GΩ; LP+, −38.42 ± 1.4 mV, 2.20 ± 0.0.29 GΩ, n = 5; LP−, −44.45 ± 2.13 mV, 1.36 ± 0.17 GΩ,n = 7; p < 0.05) (Fig.4A). Consistent with this analysis, using a two-way repeated-measures ANOVA, it was determined there was not an interaction between drug and light condition for both membrane properties (membrane potential,p = 0.86; input resistance, p = 0.315). These data suggest that the persistent increase in activity that accompanies Per1 induction in light-induced neurons is attributable to changes intrinsic to the neurons rather than ongoing changes in synaptic input.
Fig. 4.
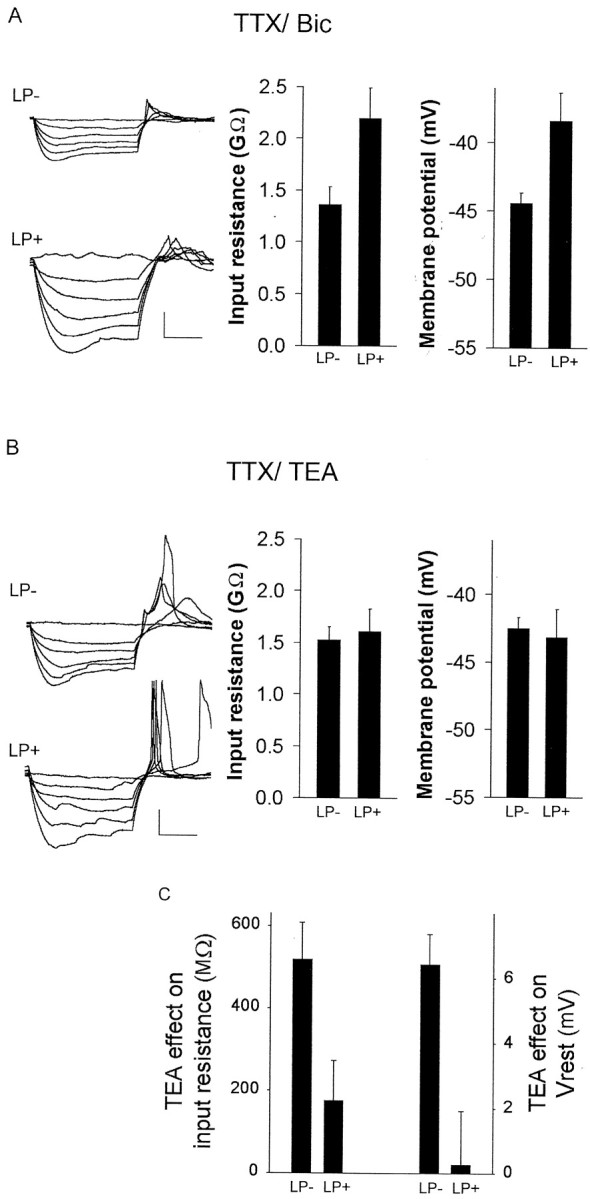
Light-induced changes in membrane properties persist in the presence of TTX–bicuculline and are mimicked by blocking K+ channels. A, In the presence of 1 μm TTX and 12.5 μmbicuculline, input resistance was significantly increased in LP+ condition (n = 5) compared with LP− (n = 7; p < 0.05), and membrane potential was significantly depolarized in the LP+ condition (n = 5) compared with LP− (n = 7; p < 0.05). Left, Examples of individual whole-cell, current-clamp recordings from LP− (top) and LP+ (bottom) conditions in the presence of TTX–Bic. B, In the presence of 1 μm TTX and 30 mm TEA, there was not a significant difference between input resistance (p > 0.9) or membrane potential (p > 0.2) in the LP+ (n= 7) and LP− (n = 6) conditions.Left, Examples of individual whole-cell, current-clamp recordings from LP− (top) and LP+ (bottom) conditions in the presence of TTX–TEA. Calibration: 20 mV, 200 msec. C, Blockade of potassium current had a differential effect on membrane properties for neurons of LP+ or LP− conditions (ANOVA; p < 0.005). The change (Δ) in membrane potential (Vrest) and input resistance (Rin) attributable to application of 30 mm TEA–1 μm TTX was significantly different between the two conditions: membrane potential,p < 0.01; input resistance, p< 0.05.
Photic stimulation suppresses K+ currents
The above results indicate that a hyperpolarizing current is reduced in Per1-expressing SCN neurons in the hours after photic stimulation. To test the hypothesis that a decrease in potassium current is an underlying mechanism of the light-induced changes in neuronal activity, the effect of blocking potassium current was assessed under both LP+ and LP− conditions. We reasoned that, if the excited state of the light-induced neurons was based on the closing or downregulation of potassium channels, then treating SCN slices with a potassium channel blocker should affect neurons of the LP− condition to a greater extent than neurons from LP+ condition. In contrast to application of TTX–Bic in which the difference between LP− and LP+ was maintained, in the presence of 30 mm TEA, a general blocker of potassium channels, and TTX, there was not a difference in membrane properties between LP− and LP+ conditions (LP−, Rin 1.53 ± 0.12 GΩ,Vrest, −42.5 ± 0.8 mV; LP+,Rin, 1.61 ± 0.22,p = 0.8, Vrest, −43.2 ± 0.2 mV) (Fig. 4B). The application of 30 mm TEA had little effect onPer1-induced neurons but resulted in an increase in membrane input resistance and depolarization for neurons of the LP− condition (Fig. 4C) (LP−, ΔVrest, 6.44 ± 0.92 mV, ΔRin519.4 ± 88.9 MΩ, n = 6; LP+, ΔVrest, 0.27 ± 1.65 mV, ΔRin, 176.4 ± 96.4 MΩ,n = 7; Vrest,p < 0.01; Rin,p < 0.05). There was an interaction between TEA–TTX drug treatment and light condition for both membrane properties (membrane potential and input resistance; two-way repeated-measures ANOVA; p < 0.005). During blockade of potassium channels, Per1-fluorescent neurons of the LP− condition displayed membrane properties similar to neurons of the light-stimulated condition.
A distinct subpopulation of Per1 neurons respond to photic stimulation
Our combined electrophysiological and imaging experiments above indicated that, by ∼3 hr after a phase-shifting light pulse, neurons in which Per1 was highly induced exhibited persistent physiological changes (Figs. 1, 2). There was considerable variability in the degree of Per1 gene induction inPer1-expressing SCN neurons and in their spontaneous activity. To further examine heterogeneity among SCN neurons after a phase-shifting light pulse, we prepared SCN slices as above in the recording experiments and performed time-lapse imaging. Images taken at the time of electrophysiological recording (ZT 1.75, 3.5 hr after the initiation of the light pulse) show that Per1 light induction was concentrated in the ventral or core SCN (Fig.5, left). In contrast, 3 hr later, at ZT 4.75 (i.e., 6.5 hr after the light pulse), fluorescent cells were present throughout the medial shell of the SCN as well (Fig.5, right), indicating that indeed a specific subset ofPer1-expressing SCN neurons in the core form the initial response.
To further characterize the subpopulation of neurons that exhibited initial Per1 induction and persistent elevation of electrophysiological activity after light stimulation, we performed double-label immunocytochemistry for GFP and either VIP or AVP. Pilot work showed that colchicine increased VIP expression [no colchicine treatment, 64 ± 5 (n = 3) vs colchicine treatment, 139 ± 12 (n = 5); p < 0.01] but had no effect on GFP expression at ZT 24 after a light pulse [light plus no colchicine, 370 ± 24 (n = 4) vs light plus colchicine treatment, 342 ± 84 (n = 3)]. Therefore, the use of this paradigm maximizes visualization of AVP and VIP cells without affecting the dynamics of GFP induction and degradation. Consistent with fluorescence imaging of living tissue (Fig. 1), induction of GFP peptide was detected in fixed tissue using anti-GFP antibodies after light stimulation as an increase in the mean number of GFP-positive neurons (LP−, 190 ± 33 vs LP+, 310 ± 32 cells; p < 0.05). Colocalization studies revealed that the mean proportion of VIP cells containing GFP increased after light treatment (LP−, 31% vs LP+, 59%;t(5) = 3.3; p < 0.05) (Figs. 6,7A). This is in contrast to the proportion of AVP cells expressing GFP after a light pulse (LP−, 29% vs LP+, 41%; t(6) = 1.1; NS) (Figs. 6, 7B); the number of AVP cells was actually lower after the light pulse (LP−, 292 vs LP+, 226;t(6) = 2.8; p = 0.03). Thus, light induction of Per1 occurs in VIP neurons to a much greater extent than AVP neurons.
Fig. 6.

Immunocytochemistry of GFP, VIP, and AVP. Histogram representing the proportion of AVP and VIP cells expressing GFP at ZT 10 versus ZT 24 and with or without a light pulse at ZT 21. Although both AVP and VIP cells rhythmically express GFP, VIP cells, but not AVP cells, express light-induced GFP.
Fig. 7.
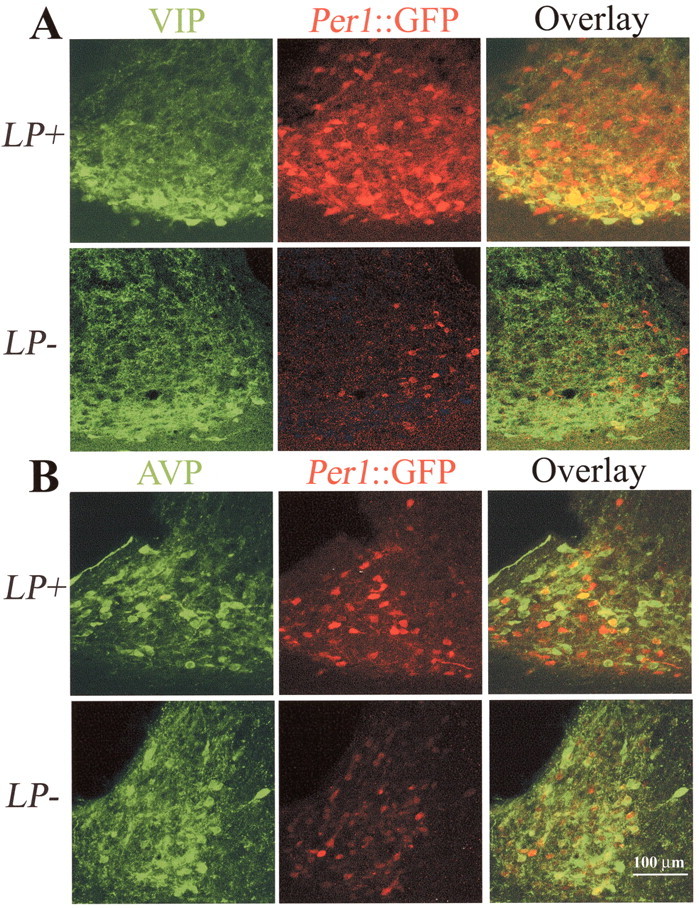
Immunocytochemistry of GFP, VIP, and AVP.A, Confocal images (overlay of 2 optical sections, each 1 μm thick) through the mid-SCN region stained for VIP (green) and GFP (red) and the overlay (third panel) from SCN at ZT 24 from animals that received a light pulse at ZT21 (LP+) or no light pulse (LP−). After a light pulse (LP+), the proportion of double-labeled VIP cells is greater, indicating light induction ofPer:: GFP in VIP neurons. B, Confocal images (overlay of 2 optical sections, each 1 μm thick) through the rostral SCN region, stained for AVP (green) and GFP (red) and the overlay (third panel) from SCN at ZT 24 from animals that received a light pulse (LP+) at ZT 21 or no light pulse (LP−). Double labeling of AVP neurons is similar in LP+ and LP− conditions.
Under entrained conditions, the number of cells expressing GFP was significantly higher during the late day (ZT 10) than at dawn (ZT 24) (ZT 10, 459 ± 37; ZT 24, 190 ± 33;t(13) = 5.4; p < 0.001), thus confirming rhythmic expression ofPer1:: GFP (Kuhlman et al., 2000; Le Sauter et al., 2003). The proportion of VIP cells containing GFP was greater at ZT 10 than at ZT 24 (ZT 10, 61% vs ZT 24, 31%;t(5) = 5.7; p < 0.01) (Fig. 6). Similarly, the proportion of AVP cells containing GFP was greater at ZT 10 than at ZT 24 (ZT 10, 64% vs ZT 24, 29%;t(6) = 4.0; p < 0.01) (Fig. 6). Thus, both VIP and AVP cells show a day–night difference inPer1-driven GFP expression in entrained conditions.
We noted that not all GFP cells colocalized with VIP or AVP. Combined, VIP and AVP cells made up 51% of the total GFP cells at ZT 10, indicating the half of the Per1-expressing neurons remain peptidergically unidentified. Together, these data indicate that VIP neurons respond to light stimulation with induction ofPer1-driven GFP and express a rhythm inPer1:: GFP, whereas AVP cells do not show a direct response to light treatment but do express a rhythm inPer1-driven GFP.
Discussion
The neural rhythms of biological clock neurons are driven by interactions of a defined set of clock genes and are entrained to the environment (for review, see Panda et al., 2002a; Wang and Sehgal 2002). Key questions in understanding the mechanisms that synchronize this internal clock with the environment are to define the links between acute gene induction by light stimuli and persistent changes in physiological output of SCN neurons and to identify the participating neuronal subpopulations. We addressed these issues in a transgenic animal model in which the dynamics of the Per1 clock gene promoter are reported by the intensity of short half-life GFP.
Per1 induction, K+ current suppression, and excitability
By performing targeted electrophysiological recording of neurons in which the Per1 gene was specifically induced by a phase-resetting light pulse, neurophysiological changes downstream of rapid gene induction were determined. A subset ofPeriod1-expressing neurons responded to phase-shifting light treatment with Per1 induction and increased neuronal activity evident 3–5 hr after light treatment. This persistent increase in spontaneous neuronal activity was characterized by membrane depolarization and increased input resistance. The change in neuronal activity was attributable to changes in intrinsic membrane properties rather than increased synaptic drive. The changes in both membrane properties were sensitive to a broad spectrum potassium channel blocker in the LP− (sham) condition but insensitive to block in slices from the LP+ (light-treated) condition, indicating that the persistent elevation in spike output in response to light is mediated by a reduction of outward potassium current. Although we do not exclude the involvement of other ion channel types, our current data indicate that K+ channel regulation can account for the effects of light on membrane potential and input resistance both qualitatively and quantitatively. We identified the downregulation of K+ conductance as an apparent link between light-stimulated gene induction and persistent changes in neural output. Future studies can determine whether the number, type, or functional properties of existing channels are affected to bring about this change.
There is increasing evidence that K+channels are a critical intersection point between the molecular clockworks and the cell membrane of clock neurons. Potassium channels are already recognized to play critical roles in the circadian oscillator of marine mollusks (Ralph and Block, 1990; Michel et al., 1993) and to underlie rhythmic changes in neuronal physiology in the SCN (Kuhlman and McMahon, unpublished). In addition, K+ channel genes are under circadian transcriptional control in the mammalian SCN (Panda et al., 2002b), and mRNA levels of a regulatory subunit are rhythmic inDrosophila (Claridge-Chang et al., 2001; McDonald and Rosbash, 2001). Our results indicate that K+ channel regulation is part of the sequence of clock resetting as well.
Simultaneous quantification of the degree of Per1 induction and electrophysiological recording of neuronal output demonstrated directly that the level of Per1 gene expression is closely associated with the degree of SCN neuronal excitability. In the hours after photic stimulation, Per1-driven fluorescence intensity was highly correlated with the rate of spike output on a cell-by-cell basis. Cells exhibiting higher levels ofPer1-driven fluorescence had elevated spike rates. These results establish a relationship between the activity of a particular clock gene, Per1, and the neural output of SCN neurons. The exact nature and mechanism of this relationship remains to be tested but could involve alterations in the transcription, posttranslational modification, or subcellular distribution of K+ channels downstream of Per1induction. In addition, our results show that, in these transgenic animals, Per1-driven fluorescence intensity is an accurate predictor of SCN neuronal spike frequency in the hours after photic stimulation.
A chronology of phase resetting
We found suppression of K+ currents and the elevation of spike frequencies in SCN neurons in the first 3–5 hr after Per1 induction by light. Chronologically, this persistent increase in neural activity falls in between the transient electrical and acute molecular responses to light (which occur in seconds to minutes) and the full expression of permanently altered phase of SCN rhythms (which is detected on the next circadian cycle) (Fig. 8). Our experiments revealed that, a few hours after a phase-resetting light pulse, the SCN is in a transitional state, characterized by heterogeneity in the molecular and physiological activity of individual SCN neurons. During this “early resetting” interval, neurons of the core SCN express the highest levels of Per1 induction and spike rates. We suggest that this elevated activity of a subset of Per1-induced neurons, mediated by suppression of K+ currents, links gene induction to alterations in neural output and provides a neural or humoral signal that ultimately consolidates the new phase of the entire SCN pacemaker.
Fig. 8.

Chronology of events in phase resetting. This figure describes a model of four chronological stages of phase resetting of the biological clock: (1) transient neural response, (2) acute molecular response, (3) early resetting, and (4) expression. Thebar and sun symbol illustrate the timing of the light cycle and light pulse, although all events subsequent to the pulse proceed in darkness or in brain slices detached from retinal input. Transient neural responses (first panel) include retinally driven alterations in spike frequency (shown), NMDA receptor activation, and NOS activation (Colwell and Menaker, 1992; Vindlacheruvu et al., 1992; Rea et al., 1993; Meijer et al., 1998; Mintz et al., 1999). Acute molecular responses (second panel) include induction ofPer1 (shown), Per2, and genes coding for activity-dependent transcription factors, scaffolding factors, and chromatin modification (Hastings et al., 1995; Kornhauser et al., 1996;Park et al., 1997; Cermakian and Sassone-Corsi, 2000; Crosio et al., 2000) and rapid phosphorylation of CREB via calcium signaling and kinase pathways (Ginty et al., 1993; Ding et al., 1997; Kako et al., 1997; Obrietan et al., 1999; Yokota et al., 2001; Butcher et al., 2002;Gau et al., 2002). Early resetting (third panel) is characterized by suppression of K+ current and high levels of spontaneous spike activity in VIP neurons highly induced for Per1 (this study). Expression (fourth panel) represents the consolidated shift of SCN physiological, molecular, and behavioral rhythms detected on the next circadian cycle of the pacemaker.
Per1 induction and VIP neurons
We found that only a subset of Per1-expressing neurons showed elevated spike rates after photic stimulation. Detailed anatomical description of the mouse SCN indicates that there are two functional subdivisions within the nucleus (Abrahamson and Moore, 2001). The RHT preferentially innervates the SCN core, and cells expressing VIP are highly localized to this region. In contrast, the shell region of the SCN is relatively devoid of direct retinal input, and cells expressing AVP are highly localized to this region (Abrahamson and Moore, 2001). The notion that SCN neurons respond differentially to photic cues has important implications for modeling entrainment of the multioscillator system (Shigeyoshi et al., 1997;Abrahamson and Moore, 2001; Hamada et al., 2001).
Our data are consistent with the view that one population ofPer1-expressing neurons responds to phasic light and is driven by environmental input, and another population is driven by self-sustained intracellular molecular oscillations (Shigeyoshi et al., 1997; Yan et al., 1999; Hamada et al., 2001). Light induction ofPer1-driven GFP occurs in VIP and other unidentified cells distributed primarily in the ventral SCN. In the light-induced cells identified in this study, the pathway to gene induction likely involves NMDA-mediated signaling coupled to kinase pathways, resulting in the phosphorylation of cAMP response element-binding protein (CREB) (Ding et al., 1997; Obrietan et al., 1998; Guido et al., 1999; Moriya et al., 2000; Yokota et al., 2001; Gau et al., 2002;Travnickova-Bendova et al., 2002). Our results raise the possibility that VIP, or other substances secreted during elevated activity by neurons within the ventral area (Aida et al., 2002), serve to communicate the phase-shifting stimulus within the SCN network. Indeed, VIP has been shown to shift behavioral rhythms in a manner similar to light when injected into the rodent SCN (Piggins et al., 1995) as well as to shift SCN electrical rhythms and induce Per1expression in vitro (Reed et al., 2001; Nielsen et al., 2002).
The non-induced Per1-expressing neurons identified in the present study likely represent the light-insensitive population described previously (Shigeyoshi et al., 1997; Yan et al., 1999; Hamada et al., 2001) and correspond to endogenously rhythmicPer1-expressing neurons. AVP cells located in the shell of the SCN did not show light-induced acute induction of Per1fluorescence. However, like the VIP population, the AVP population did show a rhythm in Per1-driven fluorescence in entrained conditions. It is interesting to note that, at ZT 10, the peak ofPer1:: GFP expression, VIP and AVP neurons account for ∼50% of all GFP-positive neurons, indicating that half of the Per1 neurons remain peptidergically unidentified.
Summary
Using a transgenic animal model in which the dynamics of thePer1 clock gene promoter are reported by the intensity of short half-life GFP, we examined the neurophysiological events downstream of Per1 gene induction and the peptidergic identity of responding neuronal populations during phase resetting of the SCN biological clock by light. Our findings have identified thePer1-induced population as containing VIP neurons preferentially to AVP neurons. We found a striking correlation between the activation of the circadian clock gene Per1 and the spontaneous activity of clock neurons. Our results indicate that regulation of K+ channels by the molecular clockworks is part of the cascade of events by which gene induction engenders a lasting shift in the phase of clock oscillations.
Footnotes
This work was supported by National Institutes of Health Grants MH63341 (D.G.M.), NS37919 (R.S.), and U54NS41069 (Specialized Neuroscience Research Program: National Institute of Neurological Disorders and Stroke, National Institute of Mental Health, National Center for Research Resources, and National Center on Minority Health and Health Disparities) (A.B.-I. and R.S.).
Correspondence should be addressed to Dr. Douglas G. McMahon, Department of Biological Sciences, Vanderbilt University, MRB III, 465 21st Avenue South, Nashville TN 37235-1634. E-mail:douglas.g.mcmahon@vanderbilt.edu.
S. J. Kuhlman's present address: Cold Spring Harbor Laboratory, 1 Bungtown Road, Cold Spring Harbor, NY 11724. E-mail: kuhlman@cshl.edu.
References
- 1.Abercrombie M. Estimation of nuclear population from microtome sections. Anat Rec. 1946;94:239–247. doi: 10.1002/ar.1090940210. [DOI] [PubMed] [Google Scholar]
- 2.Abrahamson EE, Moore RY. Suprachiasmatic nucleus in the mouse: retinal innervation, intrinsic organization and efferent projections. Brain Res. 2001;916:172–191. doi: 10.1016/s0006-8993(01)02890-6. [DOI] [PubMed] [Google Scholar]
- 3.Aida R, Moriya T, Araki M, Akiyama M, Wada K, Wada E, Shibata S. Gastrin-releasing peptide mediates photic entrainable signals to dorsal subsets of suprachiasmatic nucleus via induction of Period gene in mice. Mol Pharmacol. 2002;61:26–34. doi: 10.1124/mol.61.1.26. [DOI] [PubMed] [Google Scholar]
- 4.Akiyama M, Kouzu Y, Takahashi S, Wakamatsu H, Moriya T, Maetani M, Watanabe S, Tei H, Sakaki Y, Shibata S. Inhibition of light- or glutamate-induced mPer1 expression represses the phase shifts into the mouse circadian locomotor and suprachiasmatic firing rhythms. J Neurosci. 1999;19:1115–1121. doi: 10.1523/JNEUROSCI.19-03-01115.1999. [DOI] [PMC free article] [PubMed] [Google Scholar]
- 5.Albrecht U, Sun ZS, Eichele G, Lee CC. A differential response of two putative mammalian circadian regulators, mper1 and mper2, to light. Cell. 1997;91:1055–1064. doi: 10.1016/s0092-8674(00)80495-x. [DOI] [PubMed] [Google Scholar]
- 6.Albrecht U, Zheng B, Larkin D, Sun ZS, Lee CC. MPer1 and mper2 are essential for normal resetting of the circadian clock. J Biol Rhythms. 2001;16:100–104. doi: 10.1177/074873001129001791. [DOI] [PubMed] [Google Scholar]
- 7.Aronin N, Sagar SM, Sharp FR, Schwartz WJ. Light regulates expression of a Fos-related protein in rat suprachiasmatic nuclei. Proc Natl Acad Sci USA. 1990;87:5959–5962. doi: 10.1073/pnas.87.15.5959. [DOI] [PMC free article] [PubMed] [Google Scholar]
- 8.Bae K, Jin X, Maywood ES, Hastings MH, Reppert SM, Weaver DR. Differential functions of mPer1, mPer2, and mPer3 in the SCN circadian clock. Neuron. 2001;30:525–536. doi: 10.1016/s0896-6273(01)00302-6. [DOI] [PubMed] [Google Scholar]
- 9.Butcher GQ, Dziema H, Collamore M, Burgoon PW, Obrietan K. The P42/44 MAP kinase pathway couples photic input to circadian clock entrainment. J Biol Chem. 2002;277:29519–29525. doi: 10.1074/jbc.M203301200. [DOI] [PubMed] [Google Scholar]
- 10.Cermakian N, Sassone-Corsi P. Multilevel regulation of the circadian clock. Nat Rev Mol Cell Biol. 2000;1:59–67. doi: 10.1038/35036078. [DOI] [PubMed] [Google Scholar]
- 11.Cermakian N, Monaco L, Pando MP, Dierich A, Sassone-Corsi P. Altered behavioral rhythms and clock gene expression in mice with a targeted mutation in the Period1 gene. EMBO J. 2001;20:3967–3974. doi: 10.1093/emboj/20.15.3967. [DOI] [PMC free article] [PubMed] [Google Scholar]
- 12.Claridge-Chang A, Wijnen H, Naef F, Boothroyd C, Rajewsky N, Young MW. Circadian regulation of gene expression systems in the Drosophila head. Neuron. 2001;32:657–671. doi: 10.1016/s0896-6273(01)00515-3. [DOI] [PubMed] [Google Scholar]
- 13.Colwell CS, Menaker M. NMDA as well as non-NMDA receptor antagonists can prevent the phase-shifting effects of light on the circadian system of the golden hamster. J Biol Rhythms. 1992;7:125–136. doi: 10.1177/074873049200700204. [DOI] [PubMed] [Google Scholar]
- 14.Crosio C, Cermakian N, Allis CD, Sassone-Corsi P. Light induces chromatin modification in cells of the mammalian circadian clock. Nat Neurosci. 2000;3:1241–1247. doi: 10.1038/81767. [DOI] [PubMed] [Google Scholar]
- 15.Ding JM, Faiman LE, Hurst WJ, Kuriashkina LR, Gillette MU. Resetting the biological clock: mediation of nocturnal CREB phosphorylation via light, glutamate, and nitric oxide. J Neurosci. 1997;17:667–675. doi: 10.1523/JNEUROSCI.17-02-00667.1997. [DOI] [PMC free article] [PubMed] [Google Scholar]
- 16.Gau D, Lemberger T, von Gall C, Kretz O, Le Minh N, Gass P, Schmid W, Schibler U, Korf HW, Schutz G. Phosphorylation of CREB Ser142 regulates light-induced phase shifts of the circadian clock. Neuron. 2002;34:245–253. doi: 10.1016/s0896-6273(02)00656-6. [DOI] [PubMed] [Google Scholar]
- 17.Gillette MU, Medanic M, McArthur AJ, Liu C, Ding JM, Faiman LE, Weber ET, Tcheng TK, Gallman EA. Intrinsic neuronal rhythms in the suprachiasmatic nuclei and their adjustment. Ciba Found Symp. 1995;183:134–144. doi: 10.1002/9780470514597.ch8. [DOI] [PubMed] [Google Scholar]
- 18.Ginty DD, Kornhauser JM, Thompson MA, Bading H, Mayo KE, Takahashi JS, Greenberg ME. Regulation of CREB phosphorylation in the suprachiasmatic nucleus by light and a circadian clock. Science. 1993;260:238–241. doi: 10.1126/science.8097062. [DOI] [PubMed] [Google Scholar]
- 19.Guido ME, de Guido L, Goguen D, Robertson HA, Rusak B. Differential effects of glutamatergic blockade on circadian and photic regulation of gene expression in the hamster suprachiasmatic nucleus. Brain Res Mol Brain Res. 1999;67:247–257. doi: 10.1016/s0169-328x(99)00074-1. [DOI] [PubMed] [Google Scholar]
- 20.Hamada T, LeSauter J, Venuti JM, Silver R. Expression of period genes: rhythmic and nonrhythmic compartments of the suprachiasmatic nucleus pacemaker. J Neurosci. 2001;21:7742–7750. doi: 10.1523/JNEUROSCI.21-19-07742.2001. [DOI] [PMC free article] [PubMed] [Google Scholar]
- 21.Hastings MH, Ebling FJ, Grosse J, Herbert J, Maywood ES, Mikkelsen JD, Sumova A. Immediate-early genes and the neural bases of photic and non-photic entrainment. Ciba Found Symp. 1995;183:175–189. doi: 10.1002/9780470514597.ch10. [DOI] [PubMed] [Google Scholar]
- 22.Herzog ED, Takahashi JS, Block GD. Clock controls circadian period in isolated suprachiasmatic nucleus neurons. Nat Neurosci. 1998;1:708–713. doi: 10.1038/3708. [DOI] [PubMed] [Google Scholar]
- 23.Inouye ST, Kawamura H. Persistence of circadian rhythmicity in a mammalian hypothalamic “island” containing the suprachiasmatic nucleus. Proc Natl Acad Sci USA. 1979;76:5962–5966. doi: 10.1073/pnas.76.11.5962. [DOI] [PMC free article] [PubMed] [Google Scholar]
- 24.Kako K, Banasik M, Lee K, Ishida N. Regulation of cAMP response element binding protein (CREB) binding in the mammalian clock pacemaker by light but not a circadian clock. Brain Res Mol Brain Res. 1997;44:39–45. doi: 10.1016/s0169-328x(96)00202-1. [DOI] [PubMed] [Google Scholar]
- 25.Kornhauser JM, Mayo KE, Takahashi JS. Light, immediate-early genes, and circadian rhythms. Behav Genet. 1996;26:221–240. doi: 10.1007/BF02359382. [DOI] [PubMed] [Google Scholar]
- 26.Kuhlman SJ, Quintero JE, McMahon DG. GFP fluorescence reports Period 1 circadian gene regulation in the mammalian biological clock. NeuroReport. 2000;11:1479–1482. [PubMed] [Google Scholar]
- 27.Le Sauter J, Yan L, Vishnubhotla B, Quintero JE, Kuhlman SJ, McMahon DG, Silver R (2003) A short half-life GFP mouse model for analysis of suprachiasmatic nucleus organization. Brain Res, in press. [DOI] [PMC free article] [PubMed]
- 28.Liu C, Weaver DR, Strogatz SH, Reppert SM. Cellular construction of a circadian clock: period determination in the suprachiasmatic nuclei. Cell. 1997;91:855–860. doi: 10.1016/s0092-8674(00)80473-0. [DOI] [PubMed] [Google Scholar]
- 29.McDonald MJ, Rosbash M. Microarray analysis and organization of circadian gene expression in Drosophila. Cell. 2001;107:567–578. doi: 10.1016/s0092-8674(01)00545-1. [DOI] [PubMed] [Google Scholar]
- 30.McMahon DG, Block GD. The Bulla ocular circadian pacemaker. I. Pacemaker neuron membrane potential controls phase through a calcium-dependent mechanism. J Comp Physiol [A] 1987;161:335–346. doi: 10.1007/BF00603959. [DOI] [PubMed] [Google Scholar]
- 31.Meijer JH, Watanabe K, Schaap J, Albus H, Detari L. Light responsiveness of the suprachiasmatic nucleus: long-term multiunit and single-unit recordings in freely moving rats. J Neurosci. 1998;18:9078–9087. doi: 10.1523/JNEUROSCI.18-21-09078.1998. [DOI] [PMC free article] [PubMed] [Google Scholar]
- 32.Michel S, Geusz ME, Zaritsky JJ, Block GD. Circadian rhythm in membrane conductance expressed in isolated neurons. Science. 1993;259:239–241. doi: 10.1126/science.8421785. [DOI] [PubMed] [Google Scholar]
- 33.Mintz EM, Marvel CL, Gillespie CF, Price KM, Albers HE. Activation of NMDA receptors in the suprachiasmatic nucleus produces light-like phase shifts of the circadian clock in vivo. J Neurosci. 1999;19:5124–5130. doi: 10.1523/JNEUROSCI.19-12-05124.1999. [DOI] [PMC free article] [PubMed] [Google Scholar]
- 34.Moore R. Retinohypothalamic projection in mammals: a comparative study. Brain Res. 1973;49:403–409. doi: 10.1016/0006-8993(73)90431-9. [DOI] [PubMed] [Google Scholar]
- 35.Moore RY, Eichler VB. Loss of a circadian adrenal corticosterone rhythm following suprachiasmatic lesions in the rat. Brain Res. 1972;42:201–206. doi: 10.1016/0006-8993(72)90054-6. [DOI] [PubMed] [Google Scholar]
- 36.Moriya T, Horikawa K, Akiyama M, Shibata S. Correlative association between N-methyl-d-aspartate receptor-mediated expression of period genes in the suprachiasmatic nucleus and phase shifts in behavior with photic entrainment of clock in hamsters. Mol Pharmacol. 2000;58:1554–1562. doi: 10.1124/mol.58.6.1554. [DOI] [PubMed] [Google Scholar]
- 37.Morris ME, Viswanathan N, Kuhlman S, Davis FC, Weitz CJ. A screen for genes induced in the suprachiasmatic nucleus by light. Science. 1998;279:1544–1547. doi: 10.1126/science.279.5356.1544. [DOI] [PubMed] [Google Scholar]
- 38.Nielsen HS, Hannibal J, Fahrenkrug J. Vasoactive intestinal polypeptide induces per1 and per2 gene expression in the rat suprachiasmatic nucleus late at night. Eur J Neurosci. 2002;15:570–574. doi: 10.1046/j.0953-816x.2001.01882.x. [DOI] [PubMed] [Google Scholar]
- 39.Obrietan K, Impey S, Storm DR. Light and circadian rhythmicity regulate MAP kinase activation in the suprachiasmatic nuclei. Nat Neurosci. 1998;1:693–700. doi: 10.1038/3695. [DOI] [PubMed] [Google Scholar]
- 40.Obrietan K, Impey S, Smith D, Athos J, Storm DR. Circadian regulation of cAMP response element-mediated gene expression in the suprachiasmatic nuclei. J Biol Chem. 1999;274:17748–17756. doi: 10.1074/jbc.274.25.17748. [DOI] [PubMed] [Google Scholar]
- 41.Panda S, Hogenesch JB, Kay SA. Circadian rhythms from flies to human. Nature. 2002a;417:329–335. doi: 10.1038/417329a. [DOI] [PubMed] [Google Scholar]
- 42.Panda S, Antoch MP, Miller BH, Su AI, Schook AB, Straume M, Schultz PG, Kay SA, Takahashi JS, Hogenesch JB. Coordinated transcription of key pathways in the mouse by the circadian clock. Cell. 2002b;109:307–320. doi: 10.1016/s0092-8674(02)00722-5. [DOI] [PubMed] [Google Scholar]
- 43.Park HT, Kang EK, Bae KW. Light regulates Homer mRNA expression in the rat suprachiasmatic nucleus. Brain Res Mol Brain Res. 1997;52:318–322. doi: 10.1016/s0169-328x(97)00292-1. [DOI] [PubMed] [Google Scholar]
- 44.Piggins HD, Antle MC, Rusak B. Neuropeptides phase shift the mammalian circadian pacemaker. J Neurosci. 1995;15:5612–5622. doi: 10.1523/JNEUROSCI.15-08-05612.1995. [DOI] [PMC free article] [PubMed] [Google Scholar]
- 45.Pittendrigh C, Daan S. A functional analysis of circadian pacemakers in nocturnal rodents. IV. Entrainment: pacemaker as clock. J Comp Physiol. 1976;106:291–331. [Google Scholar]
- 46.Ralph MR, Block GD. Circadian and light-induced conductance changes in putative pacemaker cells of Bulla gouldiana. J Comp Physiol [A] 1990;166:589–595. doi: 10.1007/BF00240008. [DOI] [PubMed] [Google Scholar]
- 47.Ralph MR, Foster RG, Davis FC, Menaker M. Transplanted suprachiasmatic nucleus determines circadian period. Science. 1990;247:975–978. doi: 10.1126/science.2305266. [DOI] [PubMed] [Google Scholar]
- 48.Rea MA, Buckley B, Lutton LM. Local administration of EAA antagonists blocks light-induced phase shifts and c-fos expression in hamster SCN. Am J Physiol. 1993;265:R1191–R1198. doi: 10.1152/ajpregu.1993.265.5.R1191. [DOI] [PubMed] [Google Scholar]
- 49.Reed HE, Meyer-Spasche A, Cutler DJ, Coen CW, Piggins HD. Vasoactive intestinal polypeptide (VIP) phase-shifts the rat suprachiasmatic nucleus clock in vitro. Eur J Neurosci. 2001;13:839–843. doi: 10.1046/j.0953-816x.2000.01437.x. [DOI] [PubMed] [Google Scholar]
- 50.Refinetti R, Kaufman CM, Menaker M. Complete suprachiasmatic lesions eliminate circadian rhythmicity of body temperature and locomotor activity in golden hamsters. J Comp Physiol [A] 1994;175:223–232. doi: 10.1007/BF00215118. [DOI] [PubMed] [Google Scholar]
- 51.Rusak B, Robertson HA, Wisden W, Hunt SP. Light pulses that shift rhythms induce gene expression in the suprachiasmatic nucleus. Science. 1990;248:1237–1240. doi: 10.1126/science.2112267. [DOI] [PubMed] [Google Scholar]
- 52.Schaap J, Bos NP, de Jeu MT, Geurtsen AM, Meijer JH, Pennartz CM. Neurons of the rat suprachiasmatic nucleus show a circadian rhythm in membrane properties that is lost during prolonged whole-cell recording. Brain Res. 1999;815:154–166. doi: 10.1016/s0006-8993(98)01025-7. [DOI] [PubMed] [Google Scholar]
- 53.Schwartz WJ, Gross RA, Morton MT. The suprachiasmatic nuclei contain a tetrodotoxin-resistant circadian pacemaker. Proc Natl Acad Sci USA. 1987;84:1694–1698. doi: 10.1073/pnas.84.6.1694. [DOI] [PMC free article] [PubMed] [Google Scholar]
- 54.Shearman LP, Zylka MJ, Weaver DR, Kolakowski LF, Reppert SM., Jr Two period homologs: circadian expression and photic regulation in the suprachiasmatic nuclei. Neuron. 1997;19:1261–1269. doi: 10.1016/s0896-6273(00)80417-1. [DOI] [PubMed] [Google Scholar]
- 55.Shigeyoshi Y, Taguchi K, Yamamoto S, Takekida S, Yan L, Tei H, Moriya T, Shibata S, Loros JJ, Dunlap JC, Okamura H. Light-induced resetting of a mammalian circadian clock is associated with rapid induction of the mPer1 transcript. Cell. 1997;91:1043–1053. doi: 10.1016/s0092-8674(00)80494-8. [DOI] [PubMed] [Google Scholar]
- 56.Stephan FK, Zucker I. Circadian rhythms in drinking behavior and locomotor activity of rats are eliminated by hypothalamic lesions. Proc Natl Acad Sci USA. 1972;69:1583–1586. doi: 10.1073/pnas.69.6.1583. [DOI] [PMC free article] [PubMed] [Google Scholar]
- 57.Travnickova-Bendova Z, Cermakian N, Reppert SM, Sassone-Corsi P. Bimodal regulation of mPeriod promoters by CREB-dependent signaling and CLOCK/BMAL1 activity. Proc Natl Acad Sci USA. 2002;99:7728–7733. doi: 10.1073/pnas.102075599. [DOI] [PMC free article] [PubMed] [Google Scholar]
- 58.Vindlacheruvu RR, Ebling FJ, Maywood ES, Hastings MH. Blockade of glutamatergic neurotransmission in the suprachiasmatic nucleus prevents cellular and behavioural responses of the circadian system to light. Eur J Neurosci. 1992;4:673–679. doi: 10.1111/j.1460-9568.1992.tb00176.x. [DOI] [PubMed] [Google Scholar]
- 59.Wang GK, Sehgal A. Signaling components that drive circadian rhythms. Curr Opin Neurobiol. 2002;12:331–338. doi: 10.1016/s0959-4388(02)00324-0. [DOI] [PubMed] [Google Scholar]
- 60.Welsh DK, Logothetis DE, Meister M, Reppert SM. Individual neurons dissociated from rat suprachiasmatic nucleus express independently phased circadian firing rhythms. Neuron. 1995;14:697–706. doi: 10.1016/0896-6273(95)90214-7. [DOI] [PubMed] [Google Scholar]
- 61.Yamazaki S, Numano R, Abe M, Hida A, Takahashi R, Ueda M, Block GD, Sakaki Y, Menaker M, Tei H. Resetting central and peripheral circadian oscillators in transgenic rats. Science. 2000;288:682–685. doi: 10.1126/science.288.5466.682. [DOI] [PubMed] [Google Scholar]
- 62.Yan L, Takekida S, Shigeyoshi Y, Okamura H. Per1 and Per2 gene expression in the rat suprachiasmatic nucleus: circadian profile and the compartment-specific response to light. Neuroscience. 1999;94:141–150. doi: 10.1016/s0306-4522(99)00223-7. [DOI] [PubMed] [Google Scholar]
- 63.Yokota S, Yamamoto M, Moriya T, Akiyama M, Fukunaga K, Miyamoto E, Shibata S. Involvement of calcium-calmodulin protein kinase but not mitogen-activated protein kinase in light-induced phase delays and Per gene expression in the suprachiasmatic nucleus of the hamster. J Neurochem. 2001;77:618–627. doi: 10.1046/j.1471-4159.2001.00270.x. [DOI] [PubMed] [Google Scholar]
- 64.Zheng B, Albrecht U, Kaasik K, Sage M, Lu W, Vaishnav S, Li Q, Sun ZS, Eichele G, Bradley A, Lee CC. Nonredundant roles of the mPer1 and mPer2 genes in the mammalian circadian clock. Cell. 2001;105:683–694. doi: 10.1016/s0092-8674(01)00380-4. [DOI] [PubMed] [Google Scholar]