Abstract
Purpose: Computed tomographic colonography (CTC) is a minimally invasive technique for colonic polyps and cancer screening. Teniae coli are three bands of longitudinal smooth muscle on the colon surface. Teniae coli are important anatomically meaningful landmarks on human colon. In this paper, the authors propose an automatic teniae coli detection method for CT colonography.
Methods: The original CTC slices are first segmented and reconstructed to a 3D colon surface. Then, the 3D colon surface is unfolded using a reversible projection technique. After that the unfolded colon is projected to a 2D height map. The teniae coli are detected using the height map and then reversely projected back to the 3D colon. Since teniae are located at the junctions where the haustral folds meet, the authors apply 2D Gabor filter banks to extract features of haustral folds. The maximum response of the filter banks is then selected as the feature image. The fold centers are then identified based on local maxima and thresholding on the feature image. Connecting the fold centers yields a path of the folds. Teniae coli are extracted as lines running between the fold paths. The authors used the spatial relationship between ileocecal valve (ICV) and teniae mesocolica (TM) to identify the TM, then the teniae omentalis (TO) and the teniae libera (TL) can be identified subsequently.
Results: The authors tested the proposed method on 47 cases of 37 patients, 10 of the patients with both supine and prone CT scans. The proposed method yielded performance with an average normalized root mean square error (RMSE) ( ± standard deviation [95% confidence interval]) of 4.87% ( ± 2.93%, [4.05% 5.69%]).
Conclusions: The proposed fully-automated teniae coli detection and identification method is accurate and promising for future clinical applications.
Keywords: CT colonography, teniae coli, Gabor filter banks
INTRODUCTION
Computed tomographic colonography (CTC), also known as virtual colonoscopy (VC), is an emerging minimally invasive technique for colonic polyps and cancer screening.1, 2 Computer-aided diagnosis (CAD) systems enable radiologists to identify colorectal polyps more easily and accurately.3, 4, 5, 6 To increase the sensitivity of polyp detection in CTC, a patient will be scanned twice--in both supine and prone positions. This can improve the specificity of polyp detection if the lesions are visible in both scans.7 Sensitivity can also be improved if polyps are obscured on one scan but not the other due to uninterpretable collapse or fluid-filled segments. False positives may be reduced due to residual stool or segmentation artifacts.8
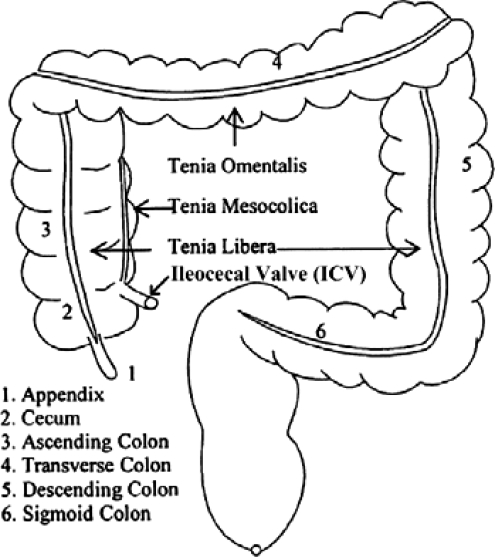
Teniae coli are three approximately 8-mm-wide longitudinal smooth muscle bands in the colon wall.9 They are parallel, equally distributed, and form a triple helix structure from the appendix to the sigmoid colon. The width of the teniae remains fairly constant along the length of the colon until they broaden to occupy more of the circumference of the sigmoid colon in its distal portion and unite to form a complete longitudinal muscle covering the rectum.10 According to their position on the colon, the three teniae coli are named teniae omentalis (TO), teniae mesocolica (TM), and teniae libera (TL). Figure 1 illustrates a human colon and the configuration of the teniae coli.
Figure 1.
Colon and teniae coli configuration. Adapted from [A. Huang, D. Roy, M. Franaszek and R. M. Summers, “Teniae coli guided navigation and registration for virtual colonoscopy,” Proceedings of the IEEE Visualization Conference (2005), pp. 279–285] Copyright [2005], American Institute of Physics.
Because of their characteristics, the teniae coli are important anatomically meaningful landmarks in the human colon. They can be used as landmarks to estimate the circumferential positions of potential lesions at CT colonography, thus making the polyp detection location more precise. They can serve also as a reference for registration and synchronized virtual navigation of supine and prone CT scans.11, 12
Teniae coli are extractable landmarks. Existing methods for extracting teniae coli can be grouped into two categories, manual and automatic. Huang et al.13 manually extracted TO, the most visible tenia coli on a well-distended colon. They first looked for the TO in the cecum by locating the ileocecal valve. Once the first TO point was found, subsequent TO points were manually chosen every 2–10 cm. Then, the shortest path through the TO points was derived on the surface. Another similar method proposed by Huang et al.14 detected haustral folds using a curvature-based filter and assigned color to aid the identification of the teniae coli more quickly. Lamy and Summers15 used a curvature filter with a refinement process to detect haustral folds, then the extremities of the folds were computed and clustered, forming the segments of teniae coli. Chowdhury et al.16 used heat diffusion and fuzzy C-means clustering to detect haustral folds. Then, the extremities of the fold were detected, which served as anatomical landmark for detecting teniae. Umemoto et al.17 also used curvatures, which were calculated by fitting quadric surfaces to all voxels on the colonic wall, to extract haustral folds. Then, the gravity centers of haustral folds were obtained and connected to extract the running directions of folds. The teniae coli were located as lines running between the fold centers.
In this paper, we propose a novel method for teniae coli detection and identification on CT colonography. The 3D colon surface is first preprocessed into a 2D flattened colon height map. Teniae coli are detected on the 2D flattened image. The proposed method makes used of 2D Gabor filters to extract the features of haustral folds. Then, a Sobel operator is performed on the filtered results to acquire the edge of the folds. Thresholding is applied to identify the fold centers. By connecting the fold centers, a path of the fold can be obtained. Teniae coli are then extracted as lines running between fold paths. After teniae are detected on 2D height maps, they are projected back to a 3D CTC volume. Finally, the three teniae coli are then distinguished based on their anatomical relation with the ileocecal valve (ICV).
The remainder of this paper is organized as follows: Sec. 2 presents the proposed method for teniae detection, including colon unfolding, fold feature extraction, teniae coli extraction, data description, and analysis methods, Sec. 3 presents teniae identification using ICV, Sec. 4 describes the experiments and presents the results, and Sec. 5 concludes the paper.
METHODS
Our method for teniae coli detection consists of four major stages: (1) colon segmentation and unfolding to obtain 2D height maps, (2) Gabor filter banks to extract haustral fold feature, (3) local maxima and thresholding to identify fold center, and (4) fold center path interpolation to obtain teniae coli.
Colon unfolding for 2D height maps
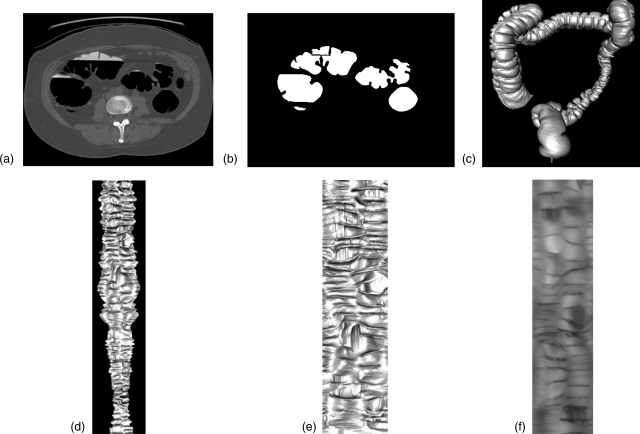
In our work, 2D height maps are 2D intensity images that record the elevation of 3D surfaces. There are two major reasons for teniae detection using 2D height maps. The first reason is the visibility of teniae. Teniae coli are not conspicuous on the original CTC slices. Figure 2a shows an example of a 2D slice of a prone CTC. The teniae in the colon wall are indicated by the red arrows. It is apparent that it is very difficult to detect teniae on 2D CTC slices. Teniae are visible as continuous flat bands on a 3D colon surface [Fig. 2c]. However, the twist and deformation of the colon makes the tracking and identification of teniae coli a difficult problem. Teniae coli are more obvious and easier to detect on unfolded and flattened colons. Therefore we conducted our analysis on the 2D flattened colon instead of the 3D colon surface.
Figure 2.
The preprocessing steps of obtaining height map for teniae detection. (a) 2D slice from prone CTC. The arrows indicate locations of three teniae in the wall of one part of the colon. It is very difficult to see teniae on 2D CTC slices. (b) Colon segmentation of image (a). (c) Reconstructed 3D colon surface. (d) 3D flattened colon surface. (e) Unfolded colon mapped to a rectangular region. (f) 2D height map image.
Figure 2 shows how to obtain a 2D height map of the colon. Colon segmentation was first performed on the original CTC slices [Fig. 2b]. The segmented colon was reconstructed to 3D colon surface [Fig. 2c]. The segmentation and reconstruction were done using our in-house software.18, 19, 20, 21, 22 Then, we unfolded the 3D colon surface into 2D flattened colon using a reversible projection technique for colon unfolding. This method makes use of rotation-minimizing frames, recursive ring sets, mesh skinning, and cylindrical projections.23 Figure 2d shows a 3D unfolded view, which is then stretched to a rectangular region [Fig. 2e]. After that the unfolded images are converted to a 2D height map [Fig. 2f]. The height map records the elevation of the colon surface relative to the unfolding plane, where haustral folds correspond to high elevation points and teniae to low elevation points.
The second reason for using 2D height maps is that the mapping procedure in our colon unfolding is completely reversible. Both forward and reverse mapping can be computed from points on the colon surface and the 2D height map. The correspondence of the voxels was preserved in each step of the preprocessing. Colon unfolding, stretching and projecting to 2D change neither the voxel correspondence, nor the perpendicular property between centerline and haustral folds. Therefore, once teniae coli are detected on the 2D height maps, they can be back projected to the original 3D colon surface.
Gabor filter banks for fold feature extraction
Our method for the teniae coli detection takes into account the main characteristic of the teniae: they are located where the haustral folds meet. With this information, haustral fold detection is the foundation of our teniae detection algorithm. Haustra are the small pouches of the colon wall between folds. Because the teniae coli runs about one-sixth shorter than the colon,24 this relative shortness causes bulges and sacculation to develop, forming the haustra. Haustral folds are the semilunares folds separating haustra. There are three sets of haustral folds running side-by-side on the colon wall, each set occupying one-third of the colon circumference.25 Haustral folds have several characteristics: they are thin and elongated structures; they have a hyperbolic curvature shape; and they are mostly perpendicular to the colon centerline.
We used two-dimensional Gabor filter banks to extract haustral fold features. Two-dimensional Gabor filters can simulate the receptive field of human visual cortex.26, 27 A bank of 2D Gabor filters has various scales and orientations. With this characteristic, Gabor filter banks can achieve optimal description of images in spatial and frequency domain. A Gabor function consists of a complex sinusoid of some frequency and orientation, modulated by a two-dimensional Gaussian.27 The Gabor filter in the spatial domain is given by
| (1) |
where θ denotes the frequency and φ denotes the orientation of the Gabor function. is an isotropic Gaussian function
| (2) |
The window sizes for Gaussian function in Eq. 2 are chosen based on the image resolution, e.g., for an 2D Gaussian function, n is selected as: , where denotes the width of the 2D height map which covers the colon circumference. σ is selected as one-sixth of the window size.
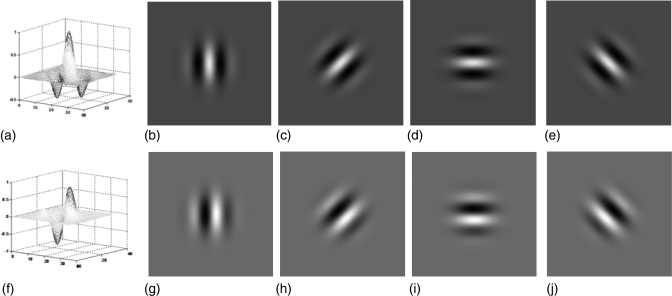
The real part of Eq. 1 corresponds to the even Gabor function, while the imaginary part corresponds to the odd Gabor function. Figure 3a shows the spatial response profile of the even Gabor function. Figures 3b–3e show the intensity plots of even Gabor filters with orientation , respectively. Figure 3f shows the spatial response profile of the odd Gabor function. Figures 3g–3j show the intensity plots of odd Gabor filters with orientation , respectively. Malik and Perona28 demonstrated that texture segregation is mainly based on even symmetric mechanisms. As only the real part of the Gabor filter is an even-symmetric filter, we used it to extract haustral fold features. The response of the Gabor filter to an image can be obtained by 2D convolution
| (3) |
where denotes the image, and denotes the filtering response with frequency θ and orientation φ .
Figure 3.
(a) Spatial response profile of the even Gabor function. (b)–(e) Intensity plots of even Gabor filters with orientation: . (f) Spatial response profile of the odd Gabor function. (g)–(j) Intensity plots of odd Gabor filters with orientation: .
Haustral folds are structures perpendicular to the colon centerline. On the flattened colon in which the colon centerline is oriented vertically, haustral folds present as horizontal textures on the colon wall [see Fig. 2d]. The Gabor filters incorporates sinusoidal functions, which make them particularly appropriate to analyze the intensity variation of the haustral fold on the 2D height maps, since the shape of Gabor wavelet is very similar to haustral folds. The 2D height maps are sent to 2D Gabor filter banks, where the image pixels are characterized by their responses to a set of orientations and special-frequency selective Gabor filters. We used Gabor filter banks with 3 scales (radial frequency: ) and 4 orientations (). Among the four orientations, the Gabor filter with orientation , receive maximum response at the location of most folds [Fig. 3d]. The sidelobes of this specific filter are parallel in the horizontal direction, which can well extract the fold feature. Orientations and , shown in Figs. 3c, 3e, may receive maximum response at certain folds which are not parallel to the horizontal axis due to the deformation of the colon. The feature image is a single response which is formed by the maximal response of the filtering results from each scale and orientation, which highlights the fold region versus the nonfold region. One example of the filtering response is presented in Fig. 4a, showing that the fold regions were highlighted by Gabor filter banks.
Figure 4.
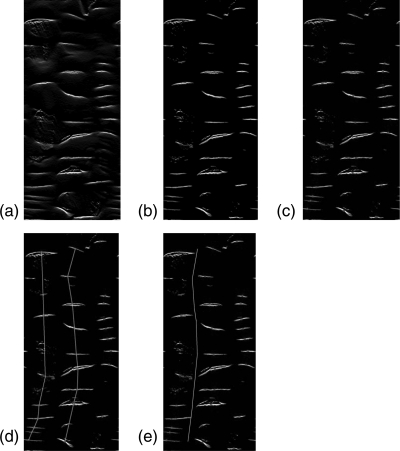
Illustration of detection process of one tenia. (a) 2D Gabor filter response to height map image. (b) Sobel operator with thresholding applied to image (a). (c) Detected fold centers. (d) Connected fold centers. (e) A detected tenia.
Detecting edge of Haustral folds using Sobel operator
By convolving Gabor filter banks with the height map image, the response image can be obtained by highlighting the region of the haustral fold, as shown in Fig. 4a. Then, we use Sobel operator to enhance the response image and detect the edge of the folds. We use horizontal Sobel operator in our experiment, since the folds are mostly running in the horizontal direction.
The resulting edge enhanced image can be computed as
| (4) |
where the operator * denotes the two-dimensional convolution operation. Figure 4b shows the gradient image after applying the Sobel operator.
Identifying Haustral fold centers using local maxima and thresholding
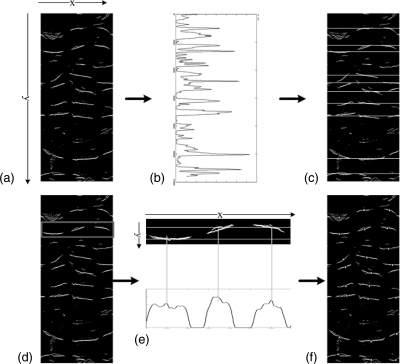
Haustral fold centers are identified on the edge image obtained by the above step. Identification of haustral fold centers is treated as a thresholding problem. As we have observed, the haustral folds are thin and elongated structures oriented in the horizontal direction. Therefore, we developed a two-step method to identify the center of the folds using the edge map . Our first step is to locate the vertical coordinates of the folds. This can be obtained by integrating the image in the horizontal direction
| (5) |
The local maxima of , denoted as , correspond to the vertical coordinate of the fold. We identified the local maxima above a threshold as vertical coordinates: . The value of the threshold, , depends on the size and distention of the colon. In our experiment, is selected as the mean value of integration of a fold set which contains 50 fold regions. This step may miss some folds that have weak response to the filter banks, however, it also eliminates some noise regions, making the fold center path more robust. Note that it is not necessary to extract every fold to construct the fold center path. Figures 5a–5c illustrated how to locate the vertical coordinates. Figure 5a is the image . Figure 5b shows the integration result using Eq. 5. Figure 5c shows the location of the vertical coordinate of the folds.
Figure 5.
Illustration of how to locate fold centers. (a) Image before fold center location. (b) Integration of image (a) along its horizontal direction. (c) The located vertical coordinates of fold centers. (d) Example of rectangular ROI, highlighted in rectangle, used to locate the horizontal coordinate. (e) Magnified image of the ROI, and integration of the ROI in vertical direction. Vertical lines indicate the detected local maxima. (f) Detected haustral fold centers superimposed on image (a).
The second step is to locate the horizontal coordinates of the folds, which is illustrated in Figures 5d, 5e. For each vertical coordinate detected in the first step, we define a rectangular neighborhood ROI [Fig. 5d]. We then compute the cumulative intensity of the ROI in the vertical direction
| (6) |
As each fold approximately occupies one-third of the colon circumference, the local maxima of the ROI correspond to the horizontal coordinates of the folds. Generally speaking, there are three local maxima of each ROI equally distributed along the horizontal direction. The horizontal coordinates are identified as
| (7) |
where is the threshold used to identify the fold center. is set adaptively as the average intensity of the fold region in the image . The local maxima is subject to several constraints: (1) the number of fold centers, , for each ROI is set to no more than 3, based on the anatomic characteristic of the colon. Note that not every region of the colon would exhibit exactly three folds. Fewer than three folds may be observed in the distal descending colon or when folds are obsured due to fluid or over/underdistension. (2) The distance between two horizontal adjacent folds should be larger than a certain value δ, which is to avoid the situation where two local maxima that are too close to each other are both selected as fold centers. Theoretically the distance between two fold centers should be , where C is the circumference of the colon. To allow some tolerance for colon deformation, δ is chosen as in our method. In the regions where only two folds can be observed, Eq. 7 produces only two local maxima; the third local maximum does not meet the constraints in Eq. 7 and does not exist. Figure 5e shows the magnified image of the ROI in red, and plots in Eq. 6. The green lines in the figure highlight the local maxima detected. Again, this process may miss a few folds, but our method is not required to detect every fold. All the points with coordinates serve as the fold centers. Figure 5f shows the detected haustral fold centers.
Extraction of teniae coli
Teniae coli are located where the haustral folds meet. Connecting the fold centers yields a path of running direction of the folds. Each tenia coli is in the middle of a pair of fold paths. Obtaining the fold center path is considered as an optimization problem
| (8) |
where each fold center is treated as a node, x denotes each node, n is the number of nodes. denotes the length of the path between two connected nodes, and denotes the slope of the line between two connected nodes. α and β are the weight parameters. As there are three sets of folds running side-by-side on the colon wall, a minimal length of the path together with a minimal slope of two fold centers, described by Eq. 8, can ensure that two folds in different paths would not connect to each other. A greedy algorithm is employed to solve Eq. 8. One thing worth mentioning is the unfolded colon is cut open from a tube structure, so the vertical borders of the flattened colon are actually connected. This periodic structure was taken into consideration, as it is described in Ref. 29, when the fold centers were connected. Figure 4d shows a pair of fold paths. There are three fold paths on the image, two of which are shown in this figure. The third fold is cut open during colon unfolding.
The teniae coli are then extracted as the line running between a pair of fold paths
| (9) |
where and denote the coordinates of the folds, and denote the coordinates of the teniae. is the third tenia which is the scenario when two adjacent fold paths are near the border. C is the circumference of the colon. Figure 4e highlights an extracted tenia.
Map teniae coli back to 3D surface and CTC slices
As we have mentioned in Sec. 2A, the merit of using our 2D height map for teniae coli detection is that the entire procedure is completely reversible. A lookup table is built when the 3D colon surface is mapped to the 2D height map. This table records the correspondence of the 3D colon voxels and the 2D height map pixels. Therefore once a tenia is detected on the 2D images, its 3D correspondence is known. Figures 6a, 6b shows the detected teniae highlighted with different colors on the 3D colon surface. Figures 6c, 6d shows the detected teniae marked on CTC slices.
Figure 6.
A pair of supine (a, c) and prone (b, d) CTC: (a, b) Teniae highlighted on 3D colon surfaces. (c, d) Teniae marked on CTC slice.
Patient data for validation experiments
For quantitative evaluation, we tested our method on a dataset of 47 well-distended CTC scans, which included 24 supine scans and 23 prone scans. The dataset were from 37 patients, with both supine/prone scans from 10 patients, only supine scans from 14 patients and only prone scans from 13 patients. Only good quality images were selected for the experiment. Nonqualified images include poor quality scans caused by colon collapse or heavy deformation, failure of the preprocessing, or artifact introduced by the preprocessing steps. The use of this patient data was approved by our institution’s Office of Human Subjects Research. Each patient underwent a cathartic bowel preparation with fecal and fluid tagging before CT scanning. Each scan was performed during a single breath-hold using a four or eight-channel CT scanner (General Electric Light Speed or Light Speed Ultra, GE Healthcare Technologies, Waukesha, WI). CT scanning parameters included 1.25–2.5 mm section collimation, 15 mm table speed, 1 mm reconstruction interval, 100 mAs, and 120 kVp.
Statistical analysis
An experienced radiologist manually labeled the teniae coli on 2D height maps as the reference standard. Root mean square error (RMSE) was employed for the assessment
| (10) |
where and denote the teniae location in 2D height map of the reference standard and detection results, respectively. N denotes the number of points compared. To obtain a percentage distance relative to the colon circumference, we normalized the RMSE by the circumference of the colon: where C denotes the colon circumference.
Since colons are tubular structures, it is more straightforward to use angle to represent the deviation of the detected results to the reference standard. The deviation angle ξ is proportional to the error rate
| (11) |
The notation of the items in Eq. 11 is the same as in Eq. 10.
TENIAE COLI INDENTIFICATION BASED ON ICV
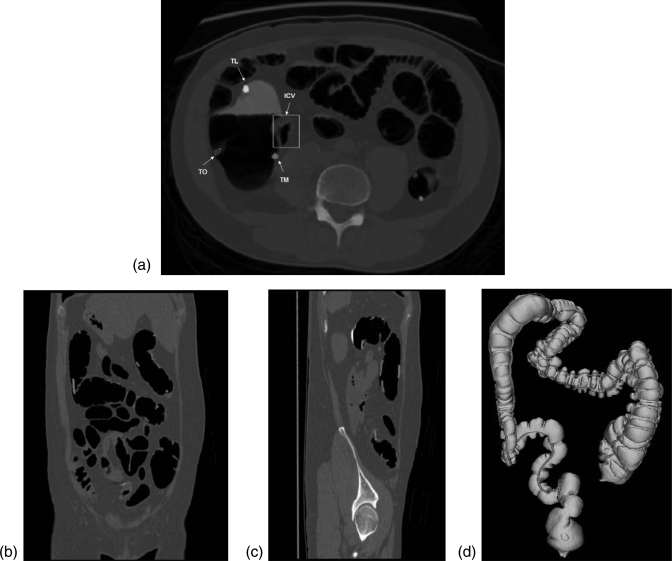
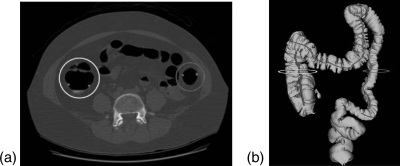
As mentioned in Sec. 1, the three teniae coli have different names according to their anatomic positions. To apply teniae coli as landmarks to register supine and prone CT scans, or to synchronize virtual navigation in both scans requires identification of the three teniae. We used the anatomic relations between teniae and ICV for the identification. The ICV is a sphincter situated at the junction of the small intestine and the colon. The ICV lies anterior to the TM, and can be used to identify the TM. The anatomic position of ICV on colon surface is shown in Fig. 1. The relationship between the location of ICV and the three teniae on CTC slice is shown in Fig. 7a. Our CAD system can automatically detect the ICV,30, 31 with a detection accuracy about 84% in 70 CT scans.30 We then look for the tenia nearest to the location of ICV, and label it the TM. Once the TM is identified, the TO and TL can be subsequently derived by their relative position. Figure 7 shows the identification results of one patient. Figures 7b, 7c present the teniae projected in coronal and sagittal view. Figure 7d shows the identified teniae on 3D colon surface labeled in different colors.
Figure 7.
Teniae coli identification. (a) The relationship between the locations of the ICV and the three teniae on a transaxial CTC slice; (b) Teniae projected on coronal view; (c) Teniae projected on sagittal view; (d) Teniae highlighted on 3D colon surface (back to front view).
EXPERIMENTAL RESULTS
Teniae coli detection results on 2D height maps
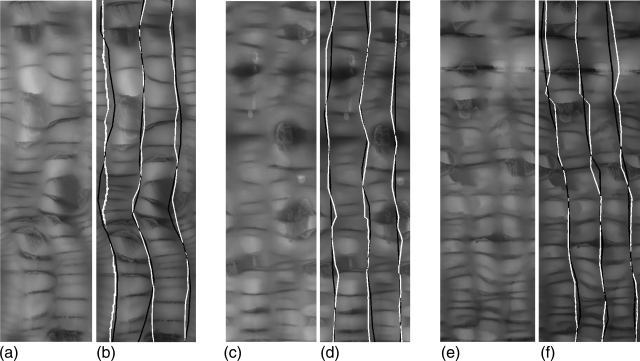
Table TABLE I. presents the qualitative and quantitative comparison between the existing methods and our proposed method. Since the methods of Lamy and Summers,15 Chowdhury et al.16 and Umemoto et al.17 do not work for the entire colon, we only compared the method of Huang et al.13 with our method quantitatively. To simulate the results of method in Ref. 13, we selected TO from the manually labeling results provided by radiologist, then derived the corresponding TM and TL in one-third of the circumference location of the colon. When calculating the RMSE of their method,13 only TM and TL were measured, since the TO itself was the reference standard. The proposed method achieved an average normalized RMSE ( ± standard deviation, [95% confidence interval]) of 4.87% ( ± 2.93%, [4.05% 5.69%]), while Huang’s method13 had an average normalized RMSE of 5.65% ( ± 1.94%, [5.60% 5.71%]). The difference between these two methods is not statistically significant (p = 0.08). The deviation angle ξ of our method was approximately 10°, while ξ of Huang’s method13 was 12°. Figure 8 compares the detection results to the reference standard.
TABLE I.
Qualitative and quantitative comparisons between the existing methods and the proposed method. Note that quantitative comparison only perform between Huang’s method13 and the proposed method, since the other three methods15, 16, 17 do not work in the entire colon. The performance of Huang’s method13 and the proposed method were obtained in the same dataset, while the datasets of methods15, 16, 17 were reported as they were described in the original documents.
| Lamy and Summers15 | Chowdhury et al.16 | Umemoto et al.17 | Huang et al.13 | Proposed | |
|---|---|---|---|---|---|
| Degree of automation | Semi-automatic | Automatic | Automatic | Manually | Automatic |
| Colon region | Entire | Transverse | Ascending/transverse | Entire | Entire |
| Teniae integrity | Teniae segment | Teniae segment | Whole teniae | Whole teniae | Whole teniae |
| Size of dataset (cases) | 4 | 5 | 6 | 47 | 47 |
| Fold detection accuracy | N/A | N/A | 76% | N/A | 91% |
| NRMSE | N/A | N/A | N/A | 5.65% | 4.87% |
| Standard deviation | N/A | N/A | N/A | 1.94% | 2.93% |
| 95% confidence interval | N/A | N/A | N/A | [5.60% 5.71%] | [4.05% 5.69%] |
Figure 8.
Teniae coli detection results in portion of the colon of three different cases (a, b), (c, d), (e, f). (a), (c), and (e): height maps. (b), (d), and (f): detection results (white line) and manual reference standard (black line).
Table TABLE II. presents the analysis of pair-wise supine and prone teniae detection results. The TL is about 22% shorter than the TO and 18% shorter than TM as expected from prior anatomic knowledge. Paired t-test shows that the length differences between every two teniae (TO&TM, TO&TL, and TM&TL) are statistically significant (p < 0.01), the difference of each tenia between the supine and prone scans is not statistically significant (p > 0.05).
TABLE II.
Pair-wise supine and prone teniae detection results analysis. The average lengths of the three teniae and centerline are presented. TLECL denotes that the points of TL end in respect to the centerline. LDPSP (unsigned) denotes the length difference between a pair of supine and prone CTC.
| TO (cm) | TM(cm) | TL (cm) | 3 Teniae (cm) | Centerline (cm) | TLECL | |
|---|---|---|---|---|---|---|
| Ave. length | 144 | 136 | 112 | 131 | 171 | 70% |
| Ave. LDPSP | 6.2 | 5.0 | 3.6 | 4.9 | 2.8 | 3.3% |
| Std. LDPSP | 2.5 | 2.2 | 1.2 | 1.9 | 1.6 | 1.7% |
Of the 47 CTC scans in our dataset, 38 (81%) ICVs were successfully detected. Of the 10 patients with both supine and prone scans, ICVs of both supine and prone scans from one patient were not detectable; ICVs of two patients’ supine scans were not detectable but their prone scans were detectable.
Numbers of teniae coli detected in different colonic regions
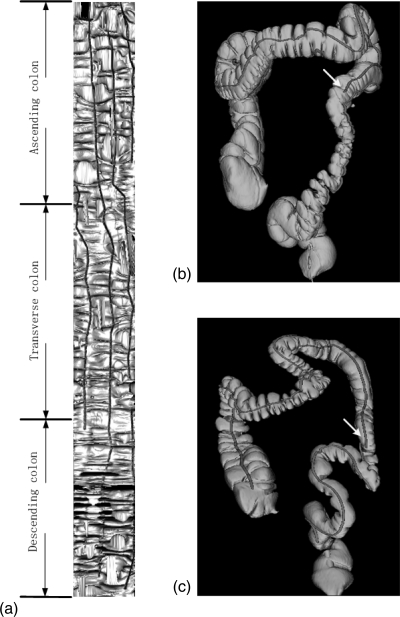
Although theoretically there are three teniae coli parallelly distributed from the appendix to the sigmoid colon, our experiments showed that the number of teniae coli varies from region to region. For 32 out of 37 patients (86%) in our experiment, there were three teniae coli detected in the ascending colon and transverse colon, but only two teniae could be found in the descending colon. Figure 9 shows some examples of how teniae end. Figure 9a presents the flattened view of a colon, in which we can see the obscurity of the descending colon and the number of teniae detected on the descending colon. The detected teniae are also presented on the flattened colon, showing that one of them ends at the descending colon. Figures 9b, 9c shows two cases of 3D colon, highlighting one tenia ending at the descending colon. Figure 10 shows the correspondence between 3D colon surface and one of its CTC slices, with indication that the number of teniae on ascending colon varies from descending colon.
Figure 9.
(a) An example of flattened colon with different colon regions (ascending, transverse, and descending) labeled. Detected teniae also shown on the colon. The obscurity of descending colon is presented and only two teniae were detected on descending colon. (b) and (c) Two examples of different patients illustrate one of the teniae ended at the descending colon, pointed by arrows. Case shown in (c) is the same case in Fig. 6a.
Figure 10.
Example showing how number of teniae coli varies from region to region. In the ascending colon, three teniae coli are detected; in the lower part of the descending colon, only two teniae are detected (TO and TM).
DISCUSSION
In this paper, we have proposed an automatic teniae coli detection method for CT colonography. The 3D colon surface is first unfolded into a 2D flattened colon. Two-dimensional Gabor filters are applied to extract fold features. The Sobel operator is used to extract the edge of the folds. The centers of the folds are then identified using local maxima and thresholding. A path of the fold centers with minimal cost is derived. The teniae coli are finally extracted as the medial lines running between fold paths. Identification of the three teniae coli is based on their anatomic relationship with the ICV. The proposed method had a high level of performance. The normalized RMSE is 4.87% ( ± 2.93%, [4.05% 5.69%]). The average error rate projected to angle is about 10°.
Our method has advantages compared to several previous works on teniae coli detection. The work of Huang et al.13, 14 is the earliest investigation on this problem. They manually localized TO and subsequently derived TM and TL by assuming the distance between every two teniae is equal. Their method extracted TO on the 3D colon and then virtually flattened the colon along the TO. The RMSE of TM and TL, compared with manually tracing results, was 5.65% ( ±1.94%, [5.60% 5.71%]). Compared with Huang’s method,13 we not only successfully achieved automatic detection, but also with a lower error rate. Huang’s method13 has more detailed experiments on polyp location with the circumferential localization systems referring to teniae coli, which is also one of our future works. Lamy and Summers15 used curvature filters to detect haustral folds in order to extract teniae. The detected teniae coli in their work were incomplete, only presented as a set of short segments. Compared to their method, ours can produce continuous teniae on the colon. The method of Chowdhury et al.16 is more about haustral fold detection rather than teniae detection. They did not clearly demostrate teniae detection either by showing figure or quantitative analysis. Our method bears some similarities to the framework of Umemoto et al.,17 but the techniques used in each step are different. Curvature information was used in this method17 for fold extraction, while our proposed method used Gabor filter banks to extract haustral folds. We also use reversible unfolding technique to project the extracted teniae back to the 3D surface. Futhermore, we distinguish the three teniae based on the ICV. Their method was conducted on ascending colon and transverse colon, while the performance in descending colon, which is the most challenging region, is unknown. The proposed method presented a higher haustral fold detection accuracy than their method, In terms of teniae detection, their experiments were carried out on six cases, three of which were very challenging, with extraction accuracy 33.7%, 0%, and 35.9%, respectively. The other three cases with good image quality yield an average extraction accuracy of 87.0% (82.0%, 85.6%, and 93.3%). The data used in our experiment are relatively well-distended colons. The average error rate by our method is 4.87%. The error metric employed by these two methods are totally different, which may not be comparable at this point.
One important application of teniae coli is to use them in supine and prone colon registration. Lamy and Summers32 applied teniae detection results to supine and prone colon registration. They used teniae to produce a deformation field as feature for matching corresponding scans. The root mean square error of the registration was reduced by 71%. Zeng et al.12 proposed a method for supine and prone matching by incorporating teniae coli information. They employed a similar approach as in Ref. 16, using heat diffusion and fuzzy C-means clustering to detect haustral folds and then extract the teniae omentalis. The colon was then cut open along the TO and unfolded to rectangular domain. The feature points of supine and prone scans were extracted separately in each scan. The registration was based on the matching results of the feature points. Traditional supine and prone colon registration methods usually use centerline information. Li et al.33 use centerline registration and statistical analysis. Suh and Wtyatt34 use centerline feature matching and lumen deformation. Wang et al.35 use correlation optimized warping (COW) based on centerline. Wang et al.36 also develop a noncenterline based method using graph matching. While those centerline based method33, 34, 35 generally achieved distance errors of 12–15 mm, the graph matching method36 achieves error of 40 mm, the registration incorporating teniae information achieves an error of 7.85 mm,12 which is lower than the traditional methods.
To use teniae in supine and prone colon registration requires each tenia to be correctly identified in both scans. The ICV detector30, 31 of our CAD system yielded a performance of 81% accuracy. For two out of ten patients in our study, we could successfully detect ICV in one scan but fail in the other. In this case, teniae registration based on spatial information, such as their relationship with centerline, can be applied to identify the teniae in the complementary scan. The ICV detector described in Ref. 30 mostly use shape and intensity information as features. With spatial information incorporated, such as the relationship between ICV and centerline, a higher ICV detection accuracy can also be expected, which may accordingly increase the teniae identification accuracy.
Our experimental results show that the TO and TM were about 30 cm shorter than the centerline in average, which is reasonable since there are no teniae in the rectum. In 32 of 37 patients in our study, the TL ended earlier than the TO and TM, with 22% shorter than TO and 18% shorter than TM. TL often ended in the mid region of the descending colon. These results are also in agreement with the anatomy literature which states that the TL and TO fuse to form a single teniae near the sigmoid colon.24
One of the vulnerabilities of the present method is that it highly depends on the scan quality and success of the preprocessing steps. A challenging data set, e.g., colon collapse or underdistention, or high complexity, twisting or deformity of the colon surface, will result in teniae that are more difficult to detect. The method may work better on the transverse colon because it is generally well-distended and has less complicated surface, and may have difficulty in the descending colon because it is more likely to collapse. Centerline extraction, colon segmentation and colon unfolding, and flattening need to be successful in order to detect teniae. Since colon unfolding itself is a very complicated procedure, the failure of the flattening will result in unsuccessful detection. The artifacts introduced by the flattening and stretching may also decrease the performance. During colon flattening, voxels can be viewed as uniformly sampled in colon region where curvature is low (ascending, transverse, descending colon), and nonuniformly sampled where curvature is high (splenic flexure, hepatic flexure). For the nonuniformly flattening or stretching region, teniae paths are estimated to remain roughly the same, but the smoothness of the teniae could be decreased.
In conclusion, we have proposed an automatic teniae coli detection method, which achieves a high level of performance, indicating its promising application for future clinical practices.
ACKNOWLEDGMENTS
This research was supported by the Intramural Research Program of the NIH Clinical Center. The authors thank Dr. Perry Pickhardt, Dr. J. Richard Choi, and Dr. William Schindler for providing CT colonography data.
References
- Pickhardt P. J., Choi J. R., Hwang I., Butler J. A., Puckett M. L., Hildebrandt H. A., Wong R. K., Nugent P. A., Mysliwiec P. A., and Schindler W. R., “Computed tomographic virtual colonoscopy to screen for colorectal neoplasia in asymptomatic adults,” N. Engl. J. Med. 349, 2191–2200 (2003). 10.1056/NEJMoa031618 [DOI] [PubMed] [Google Scholar]
- Summers R. M., Yao J., Pickhardt P. J., Franaszek M., Bitter I., Brickman D., Krishna V., and Choi J. R., “Computed tomographic virtual colonoscopy computer-aided polyp detection in a screening population,” Gastroenterology 129, 1832–1844 (2005). 10.1053/j.gastro.2005.08.054 [DOI] [PMC free article] [PubMed] [Google Scholar]
- Yoshida H. and Nappi J., “Three-dimensional computer-aided diagnosis scheme for detection of colonic polyps,” IEEE Trans. Med. Imaging 20, 1261–1274 (2001). 10.1109/42.974921 [DOI] [PubMed] [Google Scholar]
- Paik D. S., Beaulieu C. F., Rubin G. D., Acar B., Jeffrey R. B., Yee J., Dey J., and Napel S., “Surface normal overlap: A computer-aided detection algorithm, with application to colonic polyps and lung nodules in helical CT,” IEEE Trans. Med. Imaging 23, 661–675 (2004). 10.1109/TMI.2004.826362 [DOI] [PubMed] [Google Scholar]
- Wang Z., Liang Z., Li L., Li X., Li B., Anderson J., and Harrington D., “Reduction of false positives by internal features for polyp detection in CT-based virtual colonoscopy,” Med. Phys. 32, 3602–3616 (2005). 10.1118/1.2122447 [DOI] [PMC free article] [PubMed] [Google Scholar]
- Suzuki K., Yoshida H., Nappi J., Armato S. G., and Dachman A. H., “Mixture of expert 3D massive-training ANNs for reduction of multiple types of false positives in CAD for detection of polyps in CT colonography,” Med. Phys. 35, 694–703 (2008). 10.1118/1.2829870 [DOI] [PubMed] [Google Scholar]
- Fletcher J. G., Johnson C. D., Welch T. J., MacCarty R. L., Ahlquist D. A., Reed J. E., Harmsen W. S., and Wilson L. A., “Optimization of CT colonography technique: Prospective trial in 180 patients,” Radiology 216, 704–711 (2000). [DOI] [PubMed] [Google Scholar]
- Chen S. C., Lu D. S., Hecht J. R., and Kadell B. M., “CT colonography: Value of scanning in both the supine and prone positions,” Am. J. Roentgenol. 172, 595–599 (1999). [DOI] [PubMed] [Google Scholar]
- Horton K. M., Corl F. M., and Fisman E. K., “CT Evaluation of the Colon: Inflammatory Disease,” RadioGraphics 20, 399–418 (2000). [DOI] [PubMed] [Google Scholar]
- Standring S., Gray’s Anatomy: The Anatomical Basis of Clinical Practice (Elsevier Churchill, Livingstone, 2005). [Google Scholar]
- Zeng W., Marino J., Gu X., and Kaufman A., “Conformal geometry based supine and prone colon registration,” Medical Image Computing and Computer-Assisted Intervention (MICCAI) Virtual Colonoscopy Workshop (Springer-Verlag Berlin Heidelberg, Beijing, China, 2010), pp. 149–154. [Google Scholar]
- Zeng W., Marino J., Gurijala K. C., Gu X., and Kaufman A., “Supine and prone colon registration using quasi-conformal mapping,” IEEE Trans. Vis. Comput. Graph. 16, 1348–1357 (2010). 10.1109/TVCG.2010.200 [DOI] [PMC free article] [PubMed] [Google Scholar]
- Huang A., Roy D. A., Summers R. M., Franaszek M., Petrick N., Choi J. R., and Pickhardt P. J., “Teniae coli-based circumferential localization system for CT colonography: Feasibility study,” Radiology 243, 551–560 (2007). 10.1148/radiol.2432060353 [DOI] [PubMed] [Google Scholar]
- Huang A., Roy D., Franaszek M., and Summers R. M., “Teniae coli guided navigation and registration for virtual colonoscopy,” Proceedings of the IEEE Visualization Conference (IEEE, Minneapolis, MN, 2005), pp. 279–285.
- Lamy J. and Summers R. M., “Teniae coli detection from colon surface: Extraction of anatomical markers for virtual colonosopy,” International Symposium on Visual Computing (Springer, Lake Tahoe, NV, 2007), Vol. 1, pp. 199–207. [Google Scholar]
- Chowdhury A. S., Yao J., VanUitert R. L., Linguraru M. G., and Summers R. M., “Detection of anatomical landmarks in human colon from computed tomographic colonography images,” International Conference on Pattern Recognition (2008).
- Umemoto Y., Oda M., Kitasaka T., Mori K., Hayashi Y., Suenaga Y., Takayama T., and Natori H., “Extraction of teniae coli from CT volumes for assisting virtual colonoscopy,” Proceedings of SPIE Medical Imging (San Diego, CA, 2008), Vol. 6916.
- Summers R. M., Franaszek M., Miller M. T., Pickhardt P. J., Choi J. R., and Schindler W. R., “Computer-aided detection of polyps on oral contrast-enhanced CT colonography,” Am. J. Roentgenol. 184, 105–108 (2005). [DOI] [PubMed] [Google Scholar]
- Iordanescu G., Pickhardt P. J., Choi J. R., and Summers R. M., “Automated seed placement for colon segmentation in computed tomography colonography,” Acad. Radiol. 12, 182–190 (2005). 10.1016/j.acra.2004.11.013 [DOI] [PubMed] [Google Scholar]
- Franaszek M., Summers R. M., Pickhardt P. J., and Choi J. R., “Hybrid segmentation of colon filled with air and opacified fluid for CT colonography,” IEEE Trans. Med. Imaging 25, 358–368 (2006). 10.1109/TMI.2005.863836 [DOI] [PubMed] [Google Scholar]
- Summers R. M., Beaulieu C. F., Pusanik L. M., Malley J. D., Jeffrey R. B., Jr., Glazer D. I., and Napel S., “Automated polyp detector for CT colonography: Feasibility study,” Radiology 216, 284–290 (2000). [DOI] [PubMed] [Google Scholar]
- Summers R. M., Johnson C. D., Pusanik L. M., Malley J. D., Youssef A. M., and Reed J. E., “Automated polyp detection at CT colonography: Feasibility assessment in a human population,” Radiology 219, 51–59 (2001). [DOI] [PubMed] [Google Scholar]
- Yao J., Chowdhury A. S., Aman J., and Summers R. M., “Reversible Projection Technique for Colon Unfolding,” IEEE Trans. Biomed. Eng. 57, 2861–2869 (2010). 10.1109/TBME.2010.2052255 [DOI] [PMC free article] [PubMed] [Google Scholar]
- Beck D. E., Roberts P. L., Saclarides T. J., Senagore A. J., Stamos M. J., and Wexner S. D., The ASCRS Textbook of Colon and Rectal Surgery (Springer, New York, 2011). [Google Scholar]
- Kahle W. and Leonhardt H., Color Atlas and Textbook of Human Anatomy: Internal Organs (Thieme Medical Publishers, New York, NY, 2008). [Google Scholar]
- Daugman J., “Two-dimensional spectral analysis of cortical receptive field profiles,” Vision Res. 20, 847–856 (1980). 10.1016/0042-6989(80)90065-6 [DOI] [PubMed] [Google Scholar]
- Daugman J., “Uncertainty relation for resolution in space, spatial frequency and orientation optimized by two-dimensional visual cortical filters,” J. Opt. Soc. Am. 2, 1160–1169 (1985). 10.1364/JOSAA.2.001160 [DOI] [PubMed] [Google Scholar]
- Malik J. and Perona P., “Preattentive texture discrimination with early vision Mechanisms,” J. Opt. Soc. Am. 7, 923–932 (1990). 10.1364/JOSAA.7.000923 [DOI] [PubMed] [Google Scholar]
- Roth H., McClelland J., Modat M., Boone D., Hu M., Ourselin S., Slabaugh G., Slabaugh S., and Hawkes D., “Establishing spatial correspondence between the inner colon surfaces from prone and supine CT colonography,” in Medical Image Computing and Computer-Assisted Intervention (MICCAI), Vol. 13 (2010), pp. 497–504. [DOI] [PubMed] [Google Scholar]
- Summers R. M., Yao J., and Johnson C. D., “CT colonography with computer-aided detection: Automated recognition of ileocecal valve to reduce number of false-positive detections,” Radiology 233, 266–272 (2004). [DOI] [PubMed] [Google Scholar]
- O’Connor S. D., Summers R. M., Yao J., Pickhardt P. J., and Choi J. R., “CT colonography with computer-aided polyp detection: Volume and attenuation thresholds to reduce false-positive findings owing to the ileocecal valve,” Radiology 241, 426–432 (2006). 10.1148/radiol.2412051223 [DOI] [PubMed] [Google Scholar]
- Lamy J., and Summers R. M., “Intra-patient colon surface registration based on teniae coli,” in Proceedings of SPIE Medical Imaging (San Diego, CA, 2007), Vol. 6514.
- Li P., Napel S., Acar B., Paik D. S., R. B.Jeffrey, Jr., and Beaulieu C. F., “Registration of central paths and colonic polyps between supine and prone scans in computed tomography colonography: Pilot study,” Med. Phys. 31, 2912–2923 (2004). 10.1118/1.1796171 [DOI] [PubMed] [Google Scholar]
- Suh J. W. and Wyatt C. L., “Deformable registration of supine and prone colons for computed tomographic colonography,” J. Comput. Assist. Tomo. 33, 902–911 (2009). 10.1097/RCT.0b013e3181a7e2c1 [DOI] [PubMed] [Google Scholar]
- Wang S., Yao J., Liu J., Petrick N., Van Uitert R. L., Periaswamy S., and Summers R. M., “Registration of prone and supine CT colonography scans using correlation optimized warping and canonical correlation analysis,” Med. Phys. 36, 5595–5603 (2009). 10.1118/1.3259727 [DOI] [PMC free article] [PubMed] [Google Scholar]
- Wang S., Petrick N., Van Uitert R.L., Periaswamy S., and Summers R. M., “3D supine and prone colon registration for computed tomographic colonography scans based on graph matching,” in Proceedings of SPIE Medical Imaging (Orlando, FL, 2011), Vol. 7963.


