

Abstract
Objectives
The objective of this study was to update an in-depth analysis of the time trend for prostate cancer (PCA) mortality in the population of Tyrol by 5 years, namely to 2008. In Tyrol, prostate-specific antigen (PSA) tests were introduced in 1988/89; more than three-quarters of all men in the age group 45–74 had at least one PSA test in the past decade.
Methods
We applied the same model as in a previous publication, i.e., an age-period-cohort model using Poisson regression, to the mortality data covering more than three decades from 1970 to 2008.
Results
For Tyrol from 2004 to 2008 in the age group 60+ period terms show a significant reduction in prostate cancer mortality with a risk ratio of 0.70 (95% confidence interval 0.57, 0.87) for Tyrol, and for Austria excluding Tyrol a moderate reduction with a risk ratio of 0.92 (95% confidence interval 0.87, 0.97), each compared to the mortality rate in the period 1989–1993.
Conclusions
This update strengthens our previously published results, namely that PSA testing offered to a population at no charge can reduce prostate cancer mortality. The extent of mortality reduction is in line with that reported in the other recent publications. However, our data do not permit us to fully assess the harms associated with PCA screening, and no recommendation for PSA screening can be made without a careful evaluation of overdiagnosis and overtreatment.
Keywords: Prostate-specific antigen, Prostate cancer, Mortality, Screening, Early detection
Introduction
Prostate cancer (PCA) is the second-leading cause of male cancer death in most industrialized countries (Boyle et al. 2008). One out of six men in the United States and in most industrialized countries will be affected by PCA during his lifetime (SEER 2011). These facts explain why there is an exceptional interest in scientifically proven evidence on whether organized prostate-specific antigen (PSA) screening reduces PCA mortality and what harms are associated with such screening. Until now, screening healthy men for PCA has shown to be feasible and acceptable in the large studies (De Koning et al. 2002). The results of two large randomized studies with more than 75,000 cases and controls in each study were recently published (Schröder et al. 2009; Andriole et al. 2009), one showing a 20% reduction in the PCA death rate with a p value of 0.04, and the other showing no reduction.
Tyrol is one of the few countries where PSA testing was introduced already as early as 1988/89, and since 1993 it has been offered to all men aged 45–74 (Bartsch et al. 2001). In 2006, we published an analysis of PCA mortality in Tyrol until the year of death 2003 and concluded that PSA testing offered free of charge to a population can reduce PCA mortality (Oberaigner et al. 2006). Critical questions were raised about the short observation period and too small numbers and therefore unstable results. Recently, the mortality data for Austria to year of death 2008 were released, which enables us to update our analysis by adding 5 years to the observation period, namely 2004–2008.
Therefore, in order to determine whether PSA testing might be able to reduce PCA mortality in Tyrol, our goal was to update our analysis of PCA mortality in Tyrol by a 5-year period, namely by years of death 2004–2008.
Methods
Mortality data were analyzed for Tyrol, and for Austria excluding Tyrol. In Austria, mortality data are collected by Statistics Austria (Hansluwka 1989); details are described elsewhere (Oberaigner et al. 2006). We analyzed all cases coded for cause of death PCA as described above.
Population data are also collected by Statistics Austria. Census data are available for the years 1971, 1981, 1991 and 2001; for intercensus, years population figures are extrapolated based on births, deaths and migration information.
The male population of Tyrol in the last year of observation, namely 2008, was 343,340, and of Austria excluding Tyrol 3,715,295.
Analysis of mortality time trends was based on age-period-cohort (APC) modeling (Clayton and Schifflers 1987a, b). APC models allow separate effects to be estimated for age (A), period or year of death (P) and cohort (C) by means of Poisson regression. The method is identical to that used in our previous publication and was described there (Oberaigner et al. 2006).
We fitted separate models for PCA mortality for Tyrol, and for Austria excluding Tyrol. For Tyrol, the APC model reaches 24 degrees of freedom (DF) and deviance 30.4, which seems to be reasonably good. For Austria excluding Tyrol, the APC model reaches 24 DF and deviance 103.0. For every step in model extension, the likelihood ratio test shows that the parameter effect is different from a zero effect. Thus, it is justified to add each parameter step by step.
For statistical analysis, the number of PCA deaths was aggregated in 5-year age groups, 5-year period groups and consequently 5-year cohort groups. There are a very few PCA deaths for age below 60 in Tyrol (3.3% of all PCA deaths). We thus decided to build the model for age groups beginning with age 60–64 and continue in 5-year age groups. Our hypothesis was that the mortality rate decreases following PSA testing, so the reference category for period was 1989–1993.
In order to rule out the possibility that the choice of the age of PCA deaths analyzed by us, namely 60+, had a predominant influence on the result, we performed a sensitivity analysis by applying the same model to age groups 50+, 50–74 and 60–74.
The analysis was performed with Stata Version 9, using poisson procedure for Poisson regression (Stata Statistical Software 2005).
Results
Basic numbers of PCA deaths and age-standardized rates are given in Table 1; Fig. 1. Effects of the APC model are described in Table 2; reference category for age is the age group 60–64, for the period group 1989–1993 and for cohort the cohort group 1882–1886. Figure 2 shows the period effects for Tyrol and for Austria excluding Tyrol.
Table 1.
Prostate cancer mortality in Tyrol and in Austria excluding Tyrol
| Year of death | Tyrol | Austria excluding Tyrol | ||
|---|---|---|---|---|
| Number | ASRa | Number | ASRa | |
| 1970 | 56 | 17.1 | 677 | 13.5 |
| 1971 | 41 | 12.6 | 695 | 13.5 |
| 1972 | 39 | 11.0 | 700 | 13.8 |
| 1973 | 56 | 15.9 | 779 | 14.9 |
| 1974 | 51 | 13.8 | 777 | 15.1 |
| 1975 | 47 | 13.3 | 771 | 14.7 |
| 1976 | 52 | 14.7 | 809 | 15.4 |
| 1977 | 50 | 13.7 | 779 | 14.2 |
| 1978 | 57 | 15.2 | 865 | 16.3 |
| 1979 | 68 | 18.0 | 783 | 14.4 |
| 1980 | 90 | 22.9 | 845 | 15.3 |
| 1981 | 52 | 13.4 | 849 | 15.3 |
| 1982 | 69 | 17.1 | 874 | 16.0 |
| 1983 | 61 | 15.2 | 837 | 15.1 |
| 1984 | 68 | 17.1 | 835 | 15.0 |
| 1985 | 76 | 17.7 | 905 | 15.5 |
| 1986 | 70 | 16.7 | 925 | 15.8 |
| 1987 | 87 | 20.9 | 984 | 16.9 |
| 1988 | 71 | 15.7 | 941 | 16.2 |
| 1989 | 72 | 15.3 | 986 | 17.0 |
| 1990 | 96 | 20.3 | 1,014 | 16.8 |
| 1991 | 96 | 21.0 | 1,110 | 18.3 |
| 1992 | 91 | 18.3 | 1,048 | 17.1 |
| 1993 | 96 | 20.4 | 1,081 | 17.7 |
| 1994 | 95 | 19.5 | 993 | 16.1 |
| 1995 | 93 | 19.2 | 1,109 | 17.4 |
| 1996 | 91 | 17.8 | 1,079 | 16.9 |
| 1997 | 88 | 15.9 | 1,096 | 16.9 |
| 1998 | 60 | 11.3 | 1,079 | 16.1 |
| 1999 | 79 | 14.2 | 1,143 | 16.9 |
| 2000 | 79 | 13.7 | 1,150 | 16.5 |
| 2001 | 85 | 14.8 | 1,099 | 16.1 |
| 2002 | 79 | 14.0 | 1,059 | 15.2 |
| 2003 | 68 | 11.6 | 1,092 | 15.5 |
| 2004 | 59 | 10.2 | 1,080 | 14.8 |
| 2005 | 62 | 9.7 | 1,035 | 13.7 |
| 2006 | 68 | 10.5 | 1,015 | 12.8 |
| 2007 | 74 | 11.2 | 992 | 12.1 |
| 2008 | 63 | 9.0 | 1,121 | 12.9 |
aAge-standardized rate per 100,000 using SEGI weights
Fig. 1.
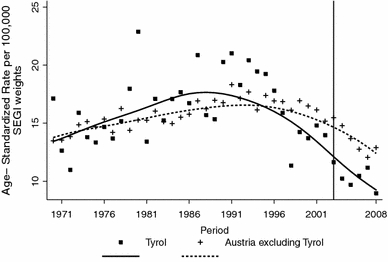
Prostate cancer mortality: age-standardized rate in Tyrol and in Austria excluding Tyrol for years of death 1970–2008 (vertical line is end of previous publication)
Table 2.
Results of the age-period-cohort model, drift in cohort
| Tyrol | Austria excluding Tyrol | |||
|---|---|---|---|---|
| Estimator | 95% CI | Estimator | 95% CI | |
| Age | ||||
| 60–64 | 1.00 | Reference | 1.00 | Reference |
| 65–69 | 2.05 | 1.65, 2.57 | 2.24 | 2.12, 2.38 |
| 70–74 | 4.63 | 3.73, 5.74 | 4.38 | 4.14, 4.64 |
| 75–79 | 7.86 | 6.23, 9.92 | 8.43 | 7.93, 8.97 |
| 80–84 | 13.29 | 10.23, 17.27 | 14.44 | 13.46, 15.48 |
| +85 | 21.40 | 16.00, 28.62 | 23.65 | 21.88, 25.57 |
| Period | ||||
| 1970–1973 | 0.66 | 0.50, 0.86 | 0.86 | 0.80, 0.93 |
| 1974–1978 | 0.62 | 0.49, 0.79 | 0.88 | 0.83, 0.94 |
| 1979–1983 | 0.78 | 0.65, 0.94 | 0.86 | 0.82, 0.91 |
| 1984–1988 | 0.81 | 0.70, 0.95 | 0.91 | 0.87, 0.95 |
| 1989–1993 | 1.00 | Reference | 1.00 | Reference |
| 1994–1998 | 0.97 | 0.84, 1.12 | 1.00 | 0.96, 1.04 |
| 1999–2003 | 0.86 | 0.72, 1.04 | 1.03 | 0.98, 1.08 |
| 2004–2008 | 0.70 | 0.57, 0.87 | 0.92 | 0.87, 0.97 |
| Cohort | ||||
| 1882–1886 | 1.00 | Reference | 1.00 | Reference |
| 1887–1891 | 1.49 | 0.93, 2.38 | 1.24 | 1.10, 1.40 |
| 1892–1896 | 1.59 | 1.05, 2.42 | 1.27 | 1.14, 1.41 |
| 1897–1901 | 1.74 | 1.18, 2.55 | 1.35 | 1.22, 1.49 |
| 1902–1906 | 1.55 | 1.08, 2.24 | 1.41 | 1.28, 1.55 |
| 1907–1911 | 1.40 | 0.98, 2.00 | 1.44 | 1.31, 1.58 |
| 1912–1916 | 1.42 | 0.99, 2.03 | 1.43 | 1.30, 1.58 |
| 1917–1921 | 1.21 | 0.84, 1.74 | 1.29 | 1.17, 1.42 |
| 1922–1926 | 0.97 | 0.66, 1.42 | 1.14 | 1.03, 1.27 |
| 1927–1931 | 0.79 | 0.53, 1.20 | 1.10 | 0.98, 1.23 |
| 1932–1936 | 0.79 | 0.50, 1.25 | 1.05 | 0.92, 1.18 |
| 1937–1941 | 0.80 | 0.48, 1.34 | 0.89 | 0.77, 1.03 |
| 1942–1946a | ||||
aBecause there is drift in cohort, there is no estimator for the last cohort 1942–1946
Fig. 2.
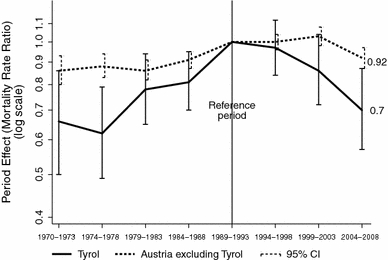
Prostate cancer mortality in Tyrol and in Austria excluding Tyrol for years of death 1970–2008, age 60+: estimated period effects
Age effects are of similar size for Tyrol and for Austria excluding Tyrol: as compared to age group 60–64, the effects are about 2, 5, 8, 14 and 22 for age groups 65–69, 70–74, 75–79, 80–84 and +85, respectively.
Period effects, each compared to years of death 1989–1993, are about 0.7–0.8 for the 1970s and 1980s in Tyrol, and about 0.9 for each of the two decades for Austria excluding Tyrol; details are shown in Table 2; Fig. 2. In the time period after optional PSA testing was introduced for all men in Tyrol, for Tyrol we observe effects of 0.97 (95% confidence interval (CI) 0.84, 1.12), 0.86 (95% CI 0.72, 1.04) and 0.70 (95% CI 0.57, 0.87) for time periods 1994–1998, 1999–2003 and 2004–2008, respectively. For Austria excluding Tyrol, we observe effects of 1 (95% CI 0.96, 1.04), 1.03 (95% CI 0.98, 1.08) and 0.92 (95% CI 0.87, 0.97), again for time periods 1994–1998, 1999–2003 and 2004–2008, respectively. The confidence intervals for the risk ratios for Tyrol and for Austria excluding Tyrol for 2004–2008 overlap only at the border.
For Tyrol, the cohort effects are about 1.5 until 1916, after which we see a decrease to about 0.8 for cohorts born after 1930. For Austria excluding Tyrol, the cohort effects are rather stable with estimators between 1.20 and 1.40 and about 1 for cohorts born after 1927.
By extending and/or subsetting the age of PCA deaths in the analysis for the time period 2004–2008, we observe estimators of 0.70 (95% CI 0.51, 0.95), 0.47 (95% CI 0.30, 0.75) and 0.40 (95% CI 0.26, 0.61) for age groups 50+, 50–74 and 60–74, respectively, each compared to 1989–1993. Details of period estimators are shown in Table 3.
Table 3.
Sensitivity analysis of the age-period-cohort model by subsetting age groups, period estimators
| Age 50+ | Age 50–74 | Age 60–74 | ||||
|---|---|---|---|---|---|---|
| Estimator | 95% CI | Estimator | 95% CI | Estimator | 95% CI | |
| Period | ||||||
| 1970–1973 | 0.66 | 0.44, 0.99 | 0.62 | 0.34, 1.13 | 0.59 | 0.37, 0.96 |
| 1974–1978 | 0.63 | 0.45, 0.87 | 0.62 | 0.3, 1.03 | 0.59 | 0.37, 0.93 |
| 1979–1983 | 0.78 | 0.61, 0.99 | 0.73 | 0.49, 1.11 | 0.70 | 0.46, 1.04 |
| 1984–1988 | 0.82 | 0.70, 0.98 | 0.99 | 0.73, 1.36 | 0.96 | 0.69, 1.34 |
| 1989–1993 | 1.00 | Reference | 1.00 | Reference | 1.00 | Reference |
| 1994–1998 | 0.95 | 0.80, 1.12 | 0.86 | 0.64, 1.17 | 0.90 | 0.66, 1.23 |
| 1999–2003 | 0.86 | 0.68, 1.09 | 0.62 | 0.42, 0.92 | 0.55 | 0.37, 0.80 |
| 2004–2008 | 0.70 | 0.51, 0.95 | 0.47 | 0.30, 0.75 | 0.40 | 0.26, 0.61 |
Discussion
Our analysis is based on an observational study of PCA mortality data conducted in the population of Tyrol, where PSA testing has been offered to men free of charge since it was introduced in the early 1990s. For Tyrol, we observed a mortality reduction of 14% for 1999–2003 and 30% for 2004–2008, and for Austria excluding Tyrol a mortality reduction of 8% for 2004–2008. The reduction for 2004–2008 is statistically significant for both Tyrol and Austria excluding Tyrol.
Are observations for Tyrol and for Austria excluding Tyrol plausible?
Our main study design is a historical comparison within Tyrol. The second comparison, although not formally included in the model, is between Tyrol and Austria excluding Tyrol. In the absence of PSA testing, we have good reasons to assume parallel time trends in PCA mortality in both regions, because health services in general as well as the diagnosis and therapy for cancer patients are uniform throughout Austria. Therefore, it is likely that the reduction in PCA mortality in Tyrol is mostly due to PSA testing, which was the main difference in PCA management between Tyrol and Austria excluding Tyrol up to 2000. In Tyrol, PSA cutoff levels equalled to 2.5, 3.5, 4.5 and 6.5 in age groups 40–49, 50–59, 60–69 and 70–79, respectively, up to October 1996 and were cut in half to 1.25, 1.75, 2.25 and 3.25 in the same age groups mentioned above (Bartsch 2008). Nevertheless, some smaller part of the reduction could be a consequence of other unknown factors. Whereas in Tyrol, PSA testing was introduced already in the early 1990s, in Austria excluding Tyrol PSA testing began some 7–10 years later. A look at PCA incidence (Statistics Austria 2008) supports this interpretation (see Fig. 3), because to our knowledge the introduction of PSA testing is the only possible explanation for the sharp increase in PCA incidence in Austria excluding Tyrol between 1995 and 2000. Hence, the 8% PCA mortality reduction in Austria excluding Tyrol could also be due to PSA testing.
Fig. 3.
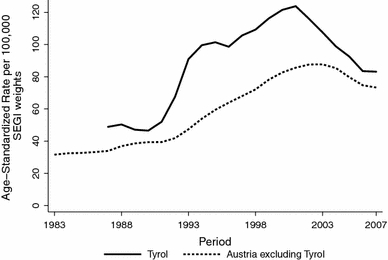
Prostate cancer incidence: age-standardized rate in Tyrol and in Austria excluding Tyrol for years of diagnosis 1983–2007
Compared to the literature, what this study adds to known facts?
It is well known that observational studies are prone to a number of possible biases (e.g. confounding), and we expect much stronger evidence from randomized studies. To date, we know of results from four randomized studies on PSA screening and mortality, see (Boyle and Brawley 2009) for a discussion of the randomized studies. However, due to contamination and attendance, the true value of screening could have been underestimated (van Leeuwen et al. 2010). Therefore, efforts have been taken to control for contamination and attendance in the ERSPC studies, and after correcting for these biases our result is in line with other results, see for example (Robool et al. 2009, van Leeuwen et al. 2010, Kerkhoff et al. 2010, Hugosson et al. 2010), bearing in mind that our approach is rather conservative because we have no age limit on PCA mortality cases.
The number needed to treat was reduced from 1,410 in the ERSPC study (Schröder et al. 2009) to 293 in the Göteburg study (Hugosson et al. 2010). Therefore, we feel it is time to revise the conclusion drawn by Boyle and Brawley, which was based on the original ERSPC results.
The advantage of our study is that it permits us to investigate the effect of PSA screening in a real-life situation. While randomised studies concentrate on the efficacy of screening, we analyze the effectiveness of a PSA testing program conducted in a well-defined population. But, of course, we cannot overcome problems that are inherent to nonrandomised studies.
In order to rule out the possibility that the model choice had a predominant effect, we compared our results with results obtained with a joinpoint regression model. We applied the SEER package (Joinpoint 2010, Kim et al. 2000), see Fig. 4. The results fit to the results obtained with the APC model, with a reduction in Tyrol beginning at about 1990 and in Austria excluding Tyrol at about 2000. The size of the mortality decrease given by the joinpoint regression model is even greater, meaning our estimates are rather conservative. In addition, we conducted a sensitivity analysis of the influence of age by extending and/or subsetting the analysis to age groups 50+, 50–74 and 60–74 (see Table 3) and obtained stable estimates.
Fig. 4.
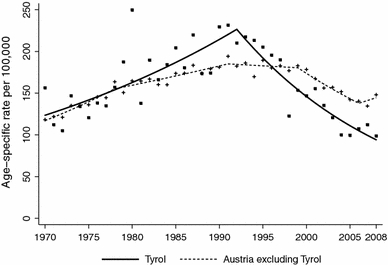
Prostate cancer mortality in Tyrol and in Austria excluding Tyrol for years of death 1970–2008: result of joinpoint regression for age-specific rate age 60+. Annual percentage change for Tyrol 2.8* (1970–1992), −5.3* (1992–2008) and for Austria excluding Tyrol 3.6* (1970–1978), 1.4* (1978–1991), −0.3 (1991–1999), −3.8* (1999–2006), 2.4 (2006–2008), *denoting statistical significance
Limitations
The facts that PSA testing was already introduced in Tyrol around 1990 and that about three-fourths of all men aged 45–74 have undergone at least one PSA test for screening purposes seem to be good reasons for conducting this analysis. However, we are faced with severe limitations.
First, and this is probably the most severe limitation, our analysis is based on an observational design, which does not allow for any control of confounders. We conducted a comparison with a historical control group and attributed the main effect to PSA testing. Of course, we cannot rule out the possibility that other factors contributed to the reduction in PCA mortality.
Second, the outcome measure we analyzed is PCA mortality, and we have no validation of PCA as cause of death. We know that mortality statistics in Austria has been of high quality for decades (Hansluwka 1989). Linking mortality data with the Cancer Registry data gives an estimate of false-positive PCA deaths: about 95% of those PCA deaths showed a PCA diagnosis in the Cancer Registry database. This proportion does not change over time (data not shown).
Third, we have no detailed knowledge of the volume of PSA testing. For Tyrol, we collected data from all PSA labs and estimated the PSA testing rate. After 9 years of intense PSA testing, we estimate that 75.1% of all men aged 45–74 in Tyrol have had at least one PSA screening test (Oberaigner et al. 2006).
Fourth, we have only a very limited data on harms caused by PSA testing. Pelzer analyzed 1,445 consecutive patients undergoing radical prostatectomy at the Department of Urology of Innsbruck Medical University and concluded that the rate of overdiagnosis is small (between 8 and 17%), but also noticed underdiagnosis (Pelzer 2008).
After weighing all limitations and strengths, our personal estimate is that although these limitations exist and cannot be formally ruled out, it is unlikely that all possible biases could have caused a 50% reduction in PCA mortality in men aged 50–74, albeit some part of this reduction can be due to a combination of biases.
Our study concerns a well-defined population of Tyrol, where we have some knowledge of PSA testing rates and information on therapy offered to the population. The APC model fits well for Tyrol, and when compared to Austria excluding Tyrol the PSA testing rate seems to be the main factor which is able to explain the difference in time trends between Tyrol and Austria excluding Tyrol. Of course, our analysis cannot overcome the problems of nonrandomized studies, but it can provide further information on the potential benefits of PSA testing or screening.
Acknowledgments
This work was supported by the Oncotyrol Center for Personal Cancer Medicine. Oncotyrol is a Comet Center funded by the Federal Ministry for Transport Innovation and Technology (BMVIT) and the Federal Ministry of Economics and Labor (BMWA), the Tyrolean Future Foundation (TZS) and the Land of Styria represented by the Styrian Business Promotion Agency (SFG) [and supported by UMIT—University for Health Sciences, Medical Informatics and Technology, Innsbruck Medical University, Tyrolean Health Insurance Fund and Tyrolean Health Company.
Conflict of interest
None.
Open Access
This article is distributed under the terms of the Creative Commons Attribution Noncommercial License which permits any noncommercial use, distribution, and reproduction in any medium, provided the original author(s) and source are credited.
References
- Andriole GL, Grubb RL, Buys SS, et al. Mortality results from a randomized prostate-cancer screening trial. N Engl J Med. 2009;360:1310–1319. doi: 10.1056/NEJMoa0810696. [DOI] [PMC free article] [PubMed] [Google Scholar]
- Bartsch G, Horninger W, Klocker H, et al. Prostate cancer mortality after introduction of prostate-specific antigen mass screening in the Federal State of Tyrol, Austria. Urology. 2001;58:417–424. doi: 10.1016/S0090-4295(01)01264-X. [DOI] [PubMed] [Google Scholar]
- Bartsch G, Horninger W, Klocker H, et al. Tyrol prostate cancer demonstration project: early detection, treatment, outcome, incidence and mortality. BJU. 2008;101:809–816. doi: 10.1111/j.1464-410X.2008.07502.x. [DOI] [PubMed] [Google Scholar]
- Boyle P, Brawley O (2009) Prostate Cancer: current evidence weighs against population screening. CA Cancer J Clin 59:220–224 [DOI] [PubMed]
- Boyle P, Levin B, editors. World cancer report 2008. Lyon: IARC; 2008. [Google Scholar]
- Clayton D, Schifflers E. Models for temporal variation in cancer rates. I. Age-period and age-cohort models. Stat Med. 1987;6:449–467. doi: 10.1002/sim.4780060405. [DOI] [PubMed] [Google Scholar]
- Clayton D, Schifflers E. Models for temporal variation in cancer rates. II. Age-period-cohort models. Stat Med. 1987;6:469–481. doi: 10.1002/sim.4780060406. [DOI] [PubMed] [Google Scholar]
- De Koning HJ, Auvinen A, Berenguer SA, et al. Large-scale randomized prostate cancer screening trials: program performances in the European randomized screening for prostate cancer trial and the prostate, lung, colorectal and ovary cancer trial. Int J Cancer. 2002;97:237–244. doi: 10.1002/ijc.1588. [DOI] [PubMed] [Google Scholar]
- Hansluwka H, Cancer Mortality Statistics . Availability and aspects of quality of mortality data worldwide. Berlin: Springer; 1989. [DOI] [PubMed] [Google Scholar]
- Hugosson J, Carlsson S, Aus G, et al. Mortality results from the Göteborg randomised population-based prostate-cancer screening trial. Lancet Oncol. 2010;11:725–732. doi: 10.1016/S1470-2045(10)70146-7. [DOI] [PMC free article] [PubMed] [Google Scholar]
- Joinpoint Regression Program, Version 3.4.3 (2010) Statistical Research and Applications Branch. National Cancer Institute, Bethesda
- Kerkhof M, Roobol MJ, Cuzick J, et al. Effect of the correction for noncompliance and contamination on the estimated reduction of metastatic prostate cancer within a randomized screening trail (ERSPC section Rotterdam) Int J Cancer. 2010;127:2639–2644. doi: 10.1002/ijc.25278. [DOI] [PubMed] [Google Scholar]
- Kim HJ, Fay MP, Feuer EJ, Midthune DN (2000) Permutation tests for joinpoint regression with applications to cancer rates. Stat Med 19:335–551. (correction: 2001; 20:655) [DOI] [PubMed]
- Oberaigner W, Horninger W, Klocker H, et al. Reduction of prostate cancer mortality in Tyrol, Austria after introduction of PSA testing. Am J Epidemiol. 2006;164(4):376–384. doi: 10.1093/aje/kwj213. [DOI] [PubMed] [Google Scholar]
- Pelzer AE, Colleselli D, Bektic J, et al. Over-diagnosis and under-diagnosis of screen- vs non-screen-detected prostate cancers with in men with prostate-specific antigen levels of 2.0–10.0 ng/mL. BJU Int. 2008;101:1223–1226. doi: 10.1111/j.1464-410X.2007.07367.x. [DOI] [PubMed] [Google Scholar]
- Robool MJ, Kerkhof M, Schröder FH, et al. Prostate cancer mortality reduction by prostate-specific antigen-based screening adjusted for nonattendance and contamination in the European randomised study of screening for prostate cancer (ERSPC) Eur Urol. 2009;56:584–591. doi: 10.1016/j.eururo.2009.07.018. [DOI] [PubMed] [Google Scholar]
- Schröder FH, Hugosson J, Roobol MJ, et al. Screening and prostate-cancer mortality in a randomized European study. N Engl J Med. 2009;360:1320–1328. doi: 10.1056/NEJMoa0810084. [DOI] [PubMed] [Google Scholar]
- SEER (2011) http://www.surveillance.cancer.gov/statistics/types/lifetime_risk.html. (Accessed 19 April 2011)
- Stata Statistical Software (2005) Release 9.0. StataCorp LP, StataCorp, College Station, Texas
- Statistik Austria (2008) Jahrbuch der Gesundheitsstatistik 2007. Wien
- van Leeuwen PJ, Connolly D, Gavin A, et al. Prostate cancer mortality in screen and clinically detected prostate cancer: estimating the screening benefit. Eur J Cancer. 2010;46:377–383. doi: 10.1016/j.ejca.2009.09.008. [DOI] [PubMed] [Google Scholar]