

Introduction
Structural biology is based on the premise that the fundamental understanding of biological functions lies in the three-dimensional structures of proteins and other biopolymers. The two well-established experimental methods for determining the structures of proteins work very well for globular proteins: witness the explosive growth of the Protein Data Bank (PDB). However, approximately 30% of all expressed polypeptides are membrane-associated, and neither X-ray crystallography nor solution nuclear magnetic resonance (NMR) spectroscopy is very effective for these proteins. The lipids required for the structural integrity and functionality of membrane proteins impede crystallization as well as the rate of overall reorientation in solution.
NMR of Proteins
NMR spectroscopy can be applied to wide variety of samples, ranging from isotropic solutions to crystalline powders, including those with slowly reorienting or immobile macromolecules, such as membrane proteins in lipid environments. NMR is capable of resolving signals from all atomic sites in proteins, and each site has several well-characterized nuclear spin interactions that can be used as sources of information about molecular structure and dynamics, as well as chemical interactions. The spin interactions can be probed through radio frequency (rf) irradiations and sample manipulations that lead to complementary strategies for NMR spectroscopy of membrane proteins reconstituted in lipid micelles or bilayers.
Comparisons between the results obtained with solution NMR experiments on lipid micelle samples, and solid-state NMR experiments on lipid bilayer samples, are especially valuable for membrane proteins with predominantly helical secondary structure. Multidimensional solution NMR methods can be successfully applied to relatively small membrane proteins in micelles; however, the size limitation is substantially more severe than for globular proteins because the many lipid molecules associated with each polypeptide slow its overall reorientation rate. In particular, using currently available instruments and methods, it is difficult to resolve, assign, and measure the “long-range” nuclear overhauser effects (NOEs) between hydrogens on hydrophobic side-chains that are needed to determine tertiary structures based on distance constraints. However, the ability to weakly align membrane proteins in micelles enables the measurement of residual dipolar couplings, and improves the feasibility of determining the structures of membrane proteins using solution NMR methods.
Nonetheless, it is highly desirable to determine the structures of membrane proteins in the definitive environment of phospholipid bilayers, where solution NMR methods fail completely for all classes of membrane proteins. Fortunately, solid-state NMR spectroscopy is well suited for peptides and proteins immobilized in phospholipid bilayers. Both oriented sample and magic angle spinning methods provide approaches to measuring orientational and distance parameters for structure determination.
Expression of Membrane Proteins
The development of bacterial expression systems is as important as that of pulse sequences or instrumentation for the success of NMR studies of membrane proteins. The ability to express membrane proteins in bacteria provides the opportunity to incorporate a variety of isotopic labeling schemes into the overall experimental strategy, since it allows both selective and uniform labeling. For selective labeling by amino acid type, the bacteria harboring the protein gene are grown on defined media, where only the amino acid of interest is labeled and the others are not. Uniform labeling, where all the nuclei of one or several types (15N, 13C, 3H) are incorporated in the protein, is accomplished by growing the bacteria on defined media containing 15N-labeled ammonium sulfate, or 13C-labeled glucose, or D2O, or a combination of these. The availability of uniformly labeled samples shifts the burden from sample preparation to spectroscopy where complete spectral resolution is the starting point for structure determination.
Because membrane proteins, including those of bacterial origin, tend to target and congest the membranes of the bacterial cells in which they are overexpressed, they usually act as toxic, antibacterial agents, regardless of their actual biological functions. Several Escherichia coli expression systems, all of which involve the use of fusion proteins, have been developed to address this problem. The fusion partner serves to keep the hydrophobic polypeptide away from the bacterial membranes, generally by sequestering it in inclusion bodies. The formation of inclusion bodies also simplifies protein isolation and purification, a process that is further facilitated by the incorporation of an engineered, N-terminal His-tag in the fusion partner, for metal affinity chromatography. After inclusion body isolation and fusion protein purification and cleavage, the final target membrane protein is purified, and then reconstituted into lipid micelles or bilayers for NMR studies.
TrpΔLE Fusion Protein E. coli Expression System
The most versatile expression system utilizes the E. coli plasmid vector pMMHa, which expresses proteins fused to the TrpΔLE1413 polypeptide.1 We have used this vector for the production of a number of membrane proteins with predominantly helical secondary structure, including Vpu, and 81-residue accessory protein of human immunodeficiency virus type-1 (HIV-1). Vpu is a typical helical membrane protein with one transmembrane hydrophobic helix and a cytoplasmic domain with two amphipathic in-plane helices. The plasmid, pHLVpu, obtained by cloning the vpu gene into the pMMHa expression vector, is diagrammed in Fig. 1A. The TrpΔLE–Vpu fusion protein, produced by pHLVpu, forms inclusion bodies when expressed in E. coli. This is an important property because the fusion protein in inclusion bodies is protected from proteolysis, is not toxic to the bacteria, and can be expressed at levels up to 20% of the total cellular protein in E. coli strain BL21(DE3). Several variants and truncated forms of Vpu with between 35 and 80 residues, including Vpu2–81, Vpu2–51, Vpu2–37, and Vpu28–81, have been expressed using this plasmid system. Overall, more than 20 different helical membrane proteins have been expressed with this approach.
Fig. 1.

(A) The plasmid pHLVpu, obtained by cloning the vpu gene into the pMMHa expression vector. (B) Outline of the four-step protocol for the expression and purification of Vpu using the TrpΔLE–Vpu fusion protein system.
Expression and Purification of Vpu from HIV-1
After protein expression, isolation and purification are accomplished via the four-step protocol outlined in Fig. 1B. First, the inclusion bodies containing the fusion protein are separated from the E. coli lysate by a series of centrifugation and wash steps. Second, the fusion protein is isolated from other proteins in the inclusion bodies by nickel affinity chromatography. Third, the polypeptide corresponding to Vpu is cleaved from the fusion protein at the N-terminal methionine with cyanogen bromide (CNBr). Finally, reversed-phase high-performance liquid chromatography (HPLC) is utilized to purify the polypetides corresponding to Vpu2–81, Vpu2–51, and Vpu2–37, all of which contain the hydrophobic N-terminal transmembrane helix. Vpu28–81, corresponding to the cytoplasmic domain, is isolated by ion-exchange and size-exclusion chromatographies, followed by reversed-phase HPLC.
The gels in Fig. 2A demonstrate the expression and isolation of inclusion bodies containing full length Vpu2–81, After induction with isopropyl-β-D-thiogalactoside (IPTG) for 4 hr, the cells are lysed by sonication and the total cell protein is analyzed by 12% SDS–PAGE (Fig. 2A, lane 1). The soluble fractions are discarded (Fig. 2A, lanes 2 and 3), and the insoluble inclusion body fraction consists of mainly the fusion protein (Fig. 2A, lane 4). Pure Vpu2–81, obtained after CNBr cleavage of the fusion protein and HPLC purification, is shown in Fig. 2B. The truncated forms Vpu2–51 and VPU2–37 were purified using a similar approach. Figure 2C demonstrates the isolation of Vpu28–81 from the cleavage mixture (Fig. 2C, lane 1). Ion-exchange chromatography was used to separate the TrpΔLE (Fig. 2C, lane 2) away from residual fusion protein and Vpu28–81 (Fig. 2C, lane 3). Size exclusion chromatography was then used to separate residual fusion protein (Fig. 2C, lane 4) from pure Vpu28–81 (Fig. 2C, lane 5).
Fig. 2.

Coomassie stained 12% SDS acrylamide gel showing the expression and purification of VPu. (A) Expression and isolation of inclusion bodies for full length Vpu2–81; (lane 1) entire cell after IPTG induction and lysis by sonication in buffer I; (lanes 2 and 3) soluble cell fraction obtained after washing and centrifugation; (lane 4) insoluble inclusion bodies fraction consisting mainly of the TrpΔLE–Vpu fusion protein. (B) Purification of Vpu2–81 after CNBr cleavage, using HPLC. (C) Purification of Vpu28–81; (lane 1) cleavage mixture; (lane 2) separation of the TrpΔLE fusion partner using ion-exchange chromatography; (lane 3) separation of residual uncleaved fusion protein and Vpu28–81 using ion-exchange chromatography; (lane 4) TrpΔLE–Vpu fusion protein fraction from size exclusion chromatography; (lane 5) Vpu28–81 isolated by size exclusion chromatography.
Materials for Membrane Protein Expression and Purification
M9 minimal media
7 g/liter Na2HPO4, 3 g/liter KH2PO4, 0.5g/liter NaCl, 0.1 mM CaCl2, 1 mM MgSO4, 50 mg/liter thiamin, 10 g/liter D-glucose, and 1 g/liter (NH4)2SO4), 1% LB media (v/v), 100 μg/ml ampicillin. For the expression of isotopically labeled proteins, (15NH4)2SO4 and [13C]glucose (Cambridge Isotope Laboratories, Andover, MA) are either used as the sole nitrogen and carbon source, respectively, or used in combination for 13C/15N-labeled samples. For 2H/13C/15N-labeled samples, an appropriate percentage of D2O(5–70%) is used together with the 13C/15N-supplemented media.
Buffer I. 50 mM Tris pH 8, 15% glycerol (v/v), 50 μg/ml lysozyme (Boehringer Mannheim), 1mM NaN3.
Buffer II. 50 mM Tris pH 8, 1% deoxycholic acid (w/v), 1% Igepal CA-630 (Sigma St. Louis, MO) (v/v), 1mM NaN3.
Buffer III. 20 mM Tris pH 8, 6 M guanidine hydrochloride (GdnHCl), 0.5 M NaCl, 5 mM imidazole.
Buffer IV. 20 mM Tris pH 8, 6 M GdnHCl, 0.5 M NaCl, 500 mM imidazole.
HPLC Buffer A. 10% acetonitrile, 90% H2O, 0.1% TEA (trifluoroacetic acid).
HPLC Buffer B. 90% acetonitrile, 10% H2O, 0.1% TFA.
Buffer C. 20 mM Tris pH 8, 8 M urea, 50 mM NaCl, 1 mM NaN3.
Buffer D. 20 mM Tris pH 8, 8 M urea, 200 mM NaCl, 1 mM NaN3.
1. Expression of TrpΔLE–Vpu
For the expression of TrpΔLE–Vpu and variants, 5 ml of M9 minimal media is inoculated with 10 μl of the glycerol stock of BL21(DE3) cells harboring the plasmids pHLVpu2–81, pHLVpu2–51, pHLVpu2–37, or pHLVpu28–81. After 5 hr of shaking at 37° and 300 rpm, 1 ml of the culture is used to inoculate 100 ml of fresh media, and the cells are cultivated overnight at 37°, with shaking at 300 rpm. In the morning, the cells are pelleted by centrifugation at 4° (10 min at 6000 rpm in Sorvall GSA rotor), and then resuspended into 1 liter of fresh medium. The cells are cultivated by shaking at 37°, to obtain a cell density corresponding to an absorbance at 600 nm (A600) of 0.7. Expression of the TrpΔLE–Vpu fusion protein is induced by the addition of IPTG to a final concentration of 0.4 mM. After induction, shaking is continued for another 4 hr at 37° until the A600 reaches 0.9. The cells are subsequently harvested by centrifugation, and the pellets stored at −80° overnight.
2. Isolation of Inclusion Bodies
Cell lysis is accomplished by resuspending the frozen cells in Buffer I, and incubating at room temperature for 10 min. The lysate is sonicated twice on ice, for 4 min, using a Branson Sonifier 450, equipped with a microtip (duty cycle 30%, power output 5), and then centrifuged for 30 min at 4° and 17,000 rpm (43,000g). The resulting supernatant is discarded, and the pellet resuspended in Buffer II, sonicated twice on ice for 4 min, and then centrifuged for 30 min at 4° and 19,000 rpm (48,000g). The resulting supernatant is discarded, and the pellet resuspended in Buffer III, and sonicated twice on ice for 4 min. The resulting homogenous mixture is transferred to GSA centrifuge bottles and diluted 10-fold with water in order to precipitate the inclusion bodies. The precipitate is centrifuged at 4° and 13,000 rpm (27,500g) for 1 hr. The resulting pellet containing the inclusion bodies is dissolved in Buffer III and stored at 4° overnight.
3. Nickel Affinity Chromatography Purification of TrpΔLE–Vpu Fusion
Nickel affinity chromatography (His Bind Resin, Novagen) is used to separate the His-tag fusion protein from the inclusion body fractions. The column is loaded with the inclusion body fraction, and washed with 3 bed-volumes of Buffer III. The bound His-tag fusion protein is eluted with 2 bed-volumes of Buffer IV. The fusion protein is concentrated in an Amicon (Danvers, MA) stirred cell concentrator fitted with a YM10 membrane having a 10,000 molecular weight cutoff (MWCO), and then dialyzed (MWCO 10,000) against water. After dialysis, the fusion protein is lyophilized to powder and stored at −20° before the cleavage reaction.
4. Cyanogen Bromide Cleavage of TrpΔLE–Vpu Fusion
Cyanogen bromide2 is used to cleave Vpu from the TrpΔLE–Vpu fusion protein. The fusion protein powder is dissolved in 70% formic acid to a concentration of 10–20 mg/ml, a 10-fold molar excess of CNBr is added to the solution, and the reaction is allowed to proceed for 2 hr, in the dark, at room temperature. The reaction mixture is immediately dialyzed (MWCO 1000) against water, then lyophilized and stored at −20° before the final purification steps.
5. Purification of Vpu
Recombinant Vpu2–81, Vpu2–51, and Vpu2–37 are purified by means of preparative reversed-phase HPLC, on a Waters Delta Prep 3000 Preparative Chromatography System, using a Delta-Pak C4 column (15-μm, 300Å, 7.8 × 300 mm, Waters, Milford, MA). The lyophilized cleavage mixture is dissolved in trifluoroethanol (TFE) with bath sonication for 10 min, and then an equal volume of Buffer A is added to the solution. Protein elution, monitored at 220 nm, is obtained after a 10-min wash with 80% Buffer A, 20% Buffer B, followed by a linear gradient to 100% buffer B over 60 min, at a flow rate of 3 ml/min; 1-minute fractions are collected. The fractions containing pure Vpu are pooled, and the organic solvents are removed by rotary evaporation. The pure recombinant protein is lyophilized to powder and stored at −20°. Protein concentration is determined by measuring the UV absorbance at 280 nm.
For the isolation of Vpu28–81, corresponding to the cytoplasmic domain of Vpu, and lacking the hydrophobic transmembrane helix, the lyophilized cleavage mixture is dissolved in Buffer C, and then loaded on a Q Sepharose Fast Flow column (Pharmacia Biotech, Uppsala, Sweden). Vpu28–81 elutes at 500 mM NaCl, together with residual, uncleaved TrpΔLE–Vpu fusion protein. The eluted protein is concentrated to 5 mg/ml, and then applied to a Superdex 75 HR 10/30 column (Pharmacia Biotech, Uppsala, Sweden) in Buffer D. Pure Vpu28–81 is obtained with a flow rate of 0.7 ml/min using FPLC. Vpu28–81 is further purified with HPLC on a Delta-Pak C18 column (15 μm, 300Å, 7.8 × 300 mm, Waters, Milford, MA) using the same Buffers A and B, and gradient, described above for reversed-phase HPLC. After acetonitrile and TFA are removed, the protein is lyophilized to powder and stored at −20°. The identities of the isolated proteins are confirmed by mass spectrometry. The yields of purified Vpu2–81, Vpu2–51, Vpu2–37, and Vpu28–81, obtained from 1 liter of cell culture in minimal media, were 1.0,0.7,0.7 and 8.0 mg, respectively.
Solution NMR of Membrane Proteins in Lipid Micelles
The determination of protein structure by multidimensional solution NMR spectroscopy is straightforward in principle.3,4 For small and medium sized globular proteins that are reasonably soluble and do not aggregate in aqueous solution, the application of this approach is generally straightforward in practice as well, especially if uniformly 15N- and/or uniformly 15N- and 13C-labeled samples can be prepared by expression in bacteria.
Solution NMR methods rely on rapid molecular reorientation for line narrowing; therefore, small micelles containing approximately 50 lipids and one polypeptide provide a generally effective model membrane environment for experiments on membrane proteins. Micelles afford relatively rapid and effectively isotropic reorientation of the polypeptide without the deleterious effects of organic solvents, which can denature proteins or promote helix formation distorting the secondary structure.5 The amphipathic nature of micelles emulates that of phospholipid bilayers and, thus, provides a more realistic alternative to organic solvents for studying membrane proteins. Indeed, membrane proteins solubilized in micelles are known to maintain their biological activities. For the proteins examined so far by both solution NMR and solid-state NMR, similar structural features have been found in micelle and bilayer samples. The first step in solution NMR structural studies of membrane proteins is the preparation of homogeneous, well-behaved micelle samples.
Preparation of Membrane Protein Samples in Lipid Micelles
The primary goal in the preparation of micelle samples is to reduce the effective rotational correlation time of the protein as much as possible, so that resonances will have the narrowest achievable linewidths. Careful handling of the protein throughout the purification is essential, since subtle changes in the protocol can have a significant impact on the quality of the resulting spectra. It is essential to optimize protein concentrations, detergent concentrations, counterions, pH and temperature, in order to obtain NMR spectra with narrow 1H and 15N resonance linewidths and well-resolved two-dimensional heteronuclear correlation spectra. The M2 peptide from the acetylcholine receptor (AchR) (23 residues) is soluble in several organic solvents; however, it also gives high quality NMR spectra in both DPC (dodecylphosphocholine) and SDS (sodium dodecyl sulfate) micelles. The major coat protein of fd bacteriophage (50 residues) can also be solubilized in DPC and SDS, as well as 1,2-DHPC (dihexanoyl-sn-glycero-3-phosphocholine) micelles. As the protein size increases, solubilization generally becomes more difficult and aggregation is more likely. Vpu (80 residues), for instance, shows evidence of severe aggregation in the presence of DPC and SDS, while it is soluble and apparently not aggregated in the presence of DHPC. On the other hand, MerF (80 residues), a mercury transporter and member of the bacterial mercury detoxification system, only gives well-resolved spectra when solubilized with SDS. Our experience suggests that no single detergent or set of experimental conditions can be considered effective for all membrane proteins, and conditions must be individually optimized for each case.
The two-dimensional 1H/15N HSQC spectra of optimized samples of uniformly 15N labeled Vpu and MerF are compared in Fig. 3. The Vpu sample consisted of 0.4 mM Vpu, 200 mM DHPC, pH 4, and the spectrum was acquired at 50° (Fig. 3A). The MerF sample contained 1 mM MerF, 600 mM SDS, 20 mM sodium phosphate pH 6.5, and the spectrum was acquired at 65° (Fig. 3B). These spectra provide the foundation for higher dimensional solution NMR experiments. The relatively narrow linewidths in both frequency dimensions and, equally important, the presence of one well-defined resonance for each amide site in the polypeptide are indicative of high quality micelle samples.6 The spectral quality obtained for these samples is comparable with that from large soluble proteins, keeping in mind the limited chemical shift dispersion due to their predominantly helical secondary structure.
Fig. 3.

Two-dimensional 1H/15N heteronuclear correlation HSQC NMR spectra from uniformly 15N labeled proteins in micelles. (A) Vpu (80 residues) in 200 mM DHPC, pH 4, at 50°. (B) MerF (80 residues) in 600 mM SDS, 20 mM sodium phosphate pH 6.5, at 65°.
Structure Determination of Membrane Proteins in Lipid Micelles
1. Resolution and Assignment of Backbone and Side-Chain Resonances
The resolution and assignment of backbone and side-chain resonances are based on both through-bond and through-space spin interactions, and are observed in two- and three-dimensional NMR spectra. There are basically two strategies for assigning resolved resonances to specific residues in a protein. One involves short-range homonuclear 1H/1H NOEs,3 and the other relies on spin–spin couplings in uniformly 15N- and 13C-labeled proteins.78 The procedure starts with heteronuclear edited total correlation spectroscopy (TOCSY) experiments supplemented with triple-resonance 13C/15N/1H experiments. Because of the limited chemical shift dispersion, selective isotopic labeling is frequently necessary in order to resolve and assign some of the resonances. Further, the incorporation of 2H is often needed in studies of membrane proteins with as few as 50 residues to limit spin diffusion and line broadening.
2. Measurement of Structural Constraints
The measurements of as many homonuclear 1H/1H NOEs as possible among the assigned resonances provide the short-range and long-range distance constraints required for structure determination. Figure 4 shows 1H/1H spectral strips taken from three-dimensional 15N-edited nuclear Overhauser spectroscopy (NOESY) spectra of Vpu in DHPC micelles. Each strip corresponds to the 15N resonance frequency of the indicated amino acid in the protein sequence. The cross peaks are between pairs of 1H nuclei separated by less than 5 Å in the protein structure. The cross peaks are grouped into three classes of strong, medium, and weak intensity, corresponding to inter-hydrogen distances of 1.9–2.5, 1.9–3.5, and 3.0–5.0 Å, respectively.
Fig. 4.

The 1H/1H spectral strips taken at individual 15N frequencies of residue 52 to 60 from a 3D 15N-edited NOESY experiment on a sample of Vpu in DHPC micelles.
These are supplemented by other structural constraints, especially spin–spin coupling constants and chemical shift correlations, in order to assign resonances and to characterize the secondary structure of the protein. Membrane proteins in micelles can be weakly aligned by the binding of lanthanide ions. This enables the measurement of residual dipolar couplings (RDCS) which provide angular constraints for the determination of the tertiary structures of membrane proteins. Finally, the amide resonances detected in a two-dimensional 1H/15N correlation spectrum at different times after the addition of D2O to the sample can be used to assign hydrogen bond constraints.
3. Structure Determination
Structure determination involves the interpretation of the distance and angular constraints in terms of secondary and tertiary protein structure. This is achieved through a combination of distance geometry, simulated annealing, molecular dynamics, and other calculations, and yields a family of energy-minimized, three-dimensional protein structures.4 This final stage of the structure determination procedure requires essentially complete assignment of the protein resonances. However, the lack of a significant number of unambiguously assigned “long-range” NOEs has limited the ability of solution NMR spectroscopy to determine the tertiary structures of membrane proteins. Fortunately, the measurement of RDCs from weakly aligned samples of membrane proteins in lipid micelles offers an additional set of constraints for structure determination. RDCs can be used to overcome limitations resulting from having few “long-range” NOE distance restraints. Structures are calculated by inclusion of all available distance and orientational constraints.
Weak Alignment of Micelle Samples
Lanthanide ions can be used to weakly align membrane proteins in lipid micelles, enabling the measurement of RDCs as orientational constraints for structure determination.9 RDCs provide direct long-range angular constraints, with respect to a molecule-fixed reference frame, that can be used for structure determination.9,10 Aqueous solutions containing bicelles,11 “purple membrane” fragments,12 or rod-shaped viruses13,14 have all been successfully employed to obtain RDCs in soluble proteins and other macromolecules. However, none of these media can be used with membrane proteins, since the hydrophobic proteins and lipids interact with and disrupt bicelles, membrane fragments, and virus particles. Moreover, membrane proteins associated with small bicelles reorient too slowly to give adequately resolved spectra.
Membrane Proteins with Adventitious Metal Binding Sites
Figure 5 illustrates the influence of lanthanide ions on the NMR spectra of three membrane proteins: Pf1 coat protein in DPC micelles, fd coat protein in SDS micelles, and MerF in SDS micelles. The schematic representations of their secondary structures are also shown (Figs. 5A, 5D, and 5G; gray for amphipathic and black for hydrophobic). An adventitious lanthanide-binding site is present in Pf1 coat protein, because it contains a 12-residue sequence similar to that found in the loop portion of an “EF-hand” calcium-binding site.15 The data in Fig. 5C show that the addition of Yb3+ ions results in resonance shifts for only those residues involved in metal binding. Figure 5B presents the values of the RDCs, which are calculated as the difference between JHN and JHN + DHN and reflect the induced orientation of the protein. At low [Ln3+]: [protein] ratios, the values of the RDCs do not have a simple relationship with lanthanide concentration. This is possibly due to competition between the “EF-hand” sequence and the C terminus. However, the measured values of the RDCs are of similar magnitude(−3 to +4 Hz) to those observed with paramagnetic metals tightly bound to single sites in calcium-binding proteins16 and other metalloproteins.17,18
Fig. 5.

Effect of lanthanide ions on the NMR spectra of (A, B, C) Pf1 coat protein; (D, E, F) fd coat protein; and (G, H, I, J, K) MerF. (A, D, G). Schematic representations (gray for amphipathic; black for hydrophobic) of helical secondary structures of (A) Pf1 coat protein, (D) fd coat protein, and (H) MerF. (C, F, I) Plots of the chemical shift changes resulting from the addition of Yb3+ ions to solutions of the same three proteins. (J, K) Plots of the RDCs and chemical shift changes measured for MerF in the presence of Dy3+ ions. Pf1 coat protein was in DPC micelles, fd coat protein in SDS micelles, and MerF in DHPC micelles. The NMR data were obtained on a Broker DMX 750 spectrometer.
Even though fd coat protein has little sequence similarity to Pf1 coat protein, its overall structural properties are the same. It, too, has an adventitious lanthanide-binding site, consisting of residues 2 through 9 (EGDDPAKA) (Fig. 5F), which has 38% identity with the binding site in Pf1 coat protein (DGNGDMKA). The RDCs values measured for fd coat protein in micelles at a [Ln3+]: [protein] ratio of 10:1 are shown in Fig. 5E. MerF is an inner membrane protein associated with transport of Hg(II) into the cell. The chemical shift data in Fig. 5I demonstrate that Ln3+ ions bind at or near one of the mercury-binding sites in the protein. The RDCs measured for MerF are somewhat smaller than those for Pf1 and fd coat proteins, possibly because of the higher sample temperature and lower [Ln3+]: [protein] ratio. The comparison of data in Figs. 5H and 5I to those in Figs. 5J and 5K demonstrate that the binding of two different lanthanide ions to the same sites yield different orientations of the protein in solution.
Membrane Proteins with Engineered “EF-Hand”
Not all membrane proteins have adventitious lanthanide binding sites. For example, Vpu could not be oriented by the simple expedient of adding lanthanide ions to the sample, as demonstrated in Fig. 5 for three other membrane proteins. However, it was possible to orient Vpu in micelles by engineering a specific, N-terminal lanthanide-binding site, in the form of 12 residues corresponding to an “EF-hand.”19 This allows the measurement of residual dipolar couplings, and other spectroscopic parameters, resulting from the presence of a single lanthanide ion in a unique, well-defined molecular site.20,21 Further, the use of more than one type of lanthanide makes it is possible to obtain multiple orientations of the protein in the magnetic field, which is valuable for eliminating ambiguities in the orientational data.22
Figure 6 compares the two-dimensional HSQC spectrum of 80-residue native Vpu (Fig. 6A) to those of 92-residue EF-Vpu in the presence of Ca2+ (Fig. 6B) and Yb3+ (Fig. 6C). Boxes are drawn around the backbone amide resonances from residues in the added “EF-hand” sequence that are not present in native Vpu.23 The boxes are empty in the spectrum of Fig. 6A, where the corresponding residues are not present in the polypeptide. Notably, the boxes are also empty in the spectrum of Fig. 6C, where all of the resonances associated with the “EF-hand” residues are shifted or broadened beyond experimental detection when the paramagnetic Yb3+ is bound instead of Ca2+. Nearly all of the amide resonances from residues 14–81 of Vpu have similar 1H and 15N chemical shifts in the presence and absence of the N-terminal “EF-hand.” Only the resonances from the 13 residues closest to the N terminus show detectable changes of chemical shifts. Thus, the added residues do not perturb the structure or environment of most of the native protein, and it may be that the resonances from residues close to the N terminus reflect only the effects of the bound metal. Significantly, different RDCs are measured for each of these resonances, upon binding Yb3+ or Dy3+. Thus, the two lanthanides result in different directions of orientation of the protein. It may be possible to utilize many other spectral perturbations from the lanthanide ions in structure determination as well.20,21
Fig. 6.

Two-dimensional heteronuclear single quantum correlation (HSQC) spectra of (A) the 80-residue native Vpu in lipid micelles, (B) the 92 residue EF-Vpu in the presence of Ca2+, and (C) the 92 residue EF-Vpu in the presence of Yb3+. Boxes are drawn around the backbone amide resonances from residues in the added “EF-hand” sequence that are not present in native Vpu. The circles in all three spectra enclose resonances from residues in the native Vpu sequence, whose locations in the protein are indicated by the circles superimposed on the structure.
Solid-State NMR of Membrane Proteins in Lipid Bilayers
Although solution NMR methods can be successfully applied to relatively small membrane proteins in micelles, the size limitation is much more severe than for globular proteins. Unfortunately, experiments derived from transverse relaxation optimized spectroscopy (TROSY)24 are ineffective with helical membrane proteins in lipid micelles, probably because of the effects of slow and intermediate time-scale motions present in these proteins. In contrast, solid-state NMR spectroscopy is well suited for studies of helical membrane proteins immobilized in fully hydrated phospholipid bilayers. It is essential to recognize that NMR studies of proteins embedded in membranes are formidable only because of the correlation time problem, and not some other chemical or physical property of polypeptides in membranes.
NMR spectra of immobile molecules have very broad resonances because the anisotropic spin interactions are not averaged out by molecular motions. High-resolution solid-state NMR spectroscopy was originally developed so that single-crystal and polycrystalline materials could be investigated; it consists of a collection of irradiation procedures and sample manipulations that replace molecular reorientation as a line-narrowing mechanism. Because these procedures can be applied in ways that lead to the selective averaging and separation of the spectral manifestations of the anisotropic spin interactions, the resulting spectra are potentially much more informative than the corresponding solution NMR spectra. The sample manipulations consist of magic angle spinning of unoriented samples or generation of highly oriented samples, and several complementary solid-state NMR approaches to membrane protein structure determination are under development.25–27 Unoriented bilayer samples are useful in characterizing the dynamics of backbone and side-chain sites. They can also be used in magic angle sample spinning experiments, which provide a complementary approach to sample orientation for obtaining high-resolution spectra of immobile proteins.25
Solid-State NMR of Oriented Samples
Solid-state NMR of oriented samples takes advantage of the spectral simplifications that result from uniaxial sample orientation parallel to the direction of the applied magnetic field. The definition of a uniaxially oriented sample is that each site on one molecule can be transformed into the identical site on another molecule, through a combination of translation, inversion, and rotation operations, about an axis parallel to the direction of the applied magnetic field. In this case, the spin interactions at 15N-, 13C-, and 2H-labeled sites yield signals that can be characterized by single resonance frequencies in each of several dimensions. The observed frequencies depend on the orientations of the principal axes of the spin-interaction tensors, present at each site, relative to the direction of the applied magnetic field. Thus, they provide the input for structure determination. The orientations of many spin-interaction tensors, including the most relevant ones for the peptide group, have been established in their molecular frame of reference, thus enabling angular factors to be determined from the experimental data. Molecular structures can be determined from angles alone, given standard bond lengths and geometries, and provided that a sufficient number of orientationally dependent spectroscopic measurements are made. Comparisons between the results obtained with solid-state NMR experiments on bilayer samples and with solution NMR experiments on micelle samples are extremely useful and are made wherever possible. The structures of a variety of membrane peptides and proteins have been investigated using this approach.
Preparation of Membrane Protein Samples in Oriented Bilayers
It is generally easier to prepare uniaxially oriented samples of many materials, including proteins in biological supramolecular structures, than single crystals for X-ray diffraction or rapidly reorienting solutions for NMR spectroscopy. Both glass-supported oriented bilayers and magnetically oriented bicelles containing membrane proteins are ideal for this approach, since both accomplish the principal requirements of immobilizing and orienting the protein.
Materials for Preparation of Oriented Samples
Buffer E. 20 mM Sodium phosphate pH 7, 5 mM SDS.
Buffer F. 10 mM Tris-Cl, pH 7, 0.1 mM EDTA, 200 mM KCl, 12 mM sodium cholate.
Buffer G. 10 mM Tris-Cl, pH 7, 0.1 mM EDTA, 200 mM KCl.
Glass-Supported Lipid Bilayers
The most widely used approach is to prepare planar lipid bilayers aligned and supported on glass slides, which are then arranged in the sample probe so that the bilayer normal is parallel to the field of the magnet. By using a stack of thin glass plates and wrapping the RF coil directly around the flat or square sample, it is possible to perform multidimensional solid-state NMR experiments on samples containing less than 1 mg of uniformly 15N-labeled polypeptide. The structures of a variety of membrane peptides and proteins have been investigated using this approach.28–32 It is possible to obtain 15N resonance line widths of less than 3 ppm.29 Notably, these line widths are less than those typically observed in single crystals of peptides, demonstrating that the proteins in the bilayers are very highly oriented, with mosaic spreads of less than about 2°.
The one-dimensional 15N chemical shift NMR spectrum in Fig. 7B was obtained from a sample of uniformly 15N-labeled fd bacteriophage coat protein in oriented phospholipid bilayers. The spectrum is strikingly different from that of an unoriented sample, which provides no resolution among resonances, without additional sample or spectroscopic manipulations (Fig. 7C). The spectrum obtained from an oriented sample displays significant resolution with identifiable peaks at frequencies throughout the range of the 15N amide chemical shift anisotropy powder pattern. Residues in the transmembrane helix have N–H bonds oriented approximately parallel to the field and to the σ33 component of the chemical shift tensor, while residues in the protein amphipathic in-plane helix have their N–H bonds perpendicular to the field and to σ33.6,29
Fig. 7.

One-dimensional 15N chemical shift solid-state NMR spectra of uniformly 15N-labeled fd coat protein in (A) magnetically oriented lipid bicelles, (B) lipid bilayers oriented on glass slides, and (C) unoriented lipid bilayers.
Two different methods for orienting lipid bilayers on glass plates are used, depending on the polypeptide, in order to obtain the best sample orientation. These are deposition from organic solvents followed by evaporation and lipid hydration, and fusion of unilamellar, reconstituted lipid vesicles with the glass surface. In both cases, before insertion into the square coil of the NMR probe, the stacked glass slide sample is wrapped in a thin layer of Parafilm, and then placed in a thin film of polyethylene, which is heat sealed at both ends to maintain sample hydration during the experiments. In all cases, the thinnest available glass plates are utilized to provide the best filling factor in the coil of the probe. Glass plates purchased from Marienfeld (Germany) have a thickness of 60–80 μm, and we have used them directly after washing in detergent and rinsing in distilled water. The thickness of the plates can be further reduced by etching with HF.33
Deposition from organic solvents
This method works well for the reconstitution and orientation of relatively small polypeptides, and we have prepared highly oriented samples of magainin and M2 peptides from acetylcholine receptor (AchR) and the NMDA receptor (NMDAR) in this way. For the AChR M2 samples, 40 mg of 1,2-dimyristoyl-sn-glycerophosphocholine (DMPC) powder (Avanti Polar Lipids, Alabaster, AL) is dissolved in trifluoroethanol (TFE) and added to 2 mg of lyophilized, HPLC purified peptide. The solution is bath sonicated for 5 min and allowed to stand overnight at −20°. In order to prepare oriented samples, the TFE solution is evenly distributed over the surface of 25 11 × 11 mm glass slides. After evaporation of the bulk organic solvent, the slides are placed under high vacuum for 3 hr in order to remove residual TFE, 2 μl of sterile filtered water is added to each slide, and the slides are stacked and placed in a chamber containing a saturated solution of ammonium phosphate that maintains relative humidity of 93%. Oriented bilayers form after the sample is equilibrated in this chamber at 30° for 15 hr.
Fusion of vesicles
This method generally works better for larger polypeptides and is used to prepare oriented samples of the fd coat protein and Vpu. Protein reconstitution in phospholipid vesicles is accomplished by adapting the freeze–thaw method of Bayer and Feigenson.34 For fd coat protein, the samples are prepared at a protein/lipid molar ratio of 1.2/100 and contain 15N-labeled coat protein plus palmitoyloleoylphosphatidylcholine (POPC) and palmitoyloleoylphosphatidylglycerol (POPG) in a molar ratio of 80/20. The coat protein is purified by size exclusion chromatography on Sephacryl-200 (Pharmacia), in 5 mM SDS (Buffer E), and then transferred to 12 mM sodium cholate by gel filtration in Buffer F. The final protein concentration is 2.5 mg/ml. The lipids are mixed in chloroform, and the solvent is evaporated under a stream of nitrogen followed by high vacuum for 1 hr. The dry lipid mixture is then suspended in 9 ml of Buffer G and sonicated to transparency using a Branson sonifier equipped with a microtip. Coat protein in Buffer F is added to the vesicle suspension.
After vortex mixing, the lipid protein mixtures are each diluted by the addition of 9 ml of Buffer G, rapidly frozen in liquid nitrogen, allowed to thaw at room temperature, and bath sonicated for 30 sec. The preparation is dialyzed (MWCO 10,000) against six 12-hour changes of 4 liter of buffer, followed by four 5-hour changes of 4 liter of water, in order to remove sodium cholate. The reconstituted vesicle preparation is concentrated by ultrafiltration (MCWO 10,000) and spread onto the surface of glass slides, and excess water is evaporated at 42°. After dehydration, the slides are stacked and placed in a sealed chamber together with a saturated ammonium phosphate solution, which provides a 93% relative humidity atmosphere. Oriented bilayers form after the sample equilibrates in this chamber at 42° for 12 hr.
Magnetically Oriented Lipid Bicelles
In a variation of this approach, membrane proteins are reconstituted in lipid bicelles, which are bilayer discs, composed of mixtures of long- and short-chain phospholipids that orient spontaneously in the magnetic field.35 Bicelles orient with their bilayer normals orthogonal to the direction of the applied magnetic field and have been used to determine the structure and dynamics of several glycolipids, myristoylated peptides, and ubiquinones.36–37 However, although some results have been obtained by orienting surface and transmembrane peptides in this way, there are substantial spectroscopic limitations associated with the use of peptide and protein samples oriented perpendicular, rather than parallel, to the direction of the applied magnetic field. In particular, if the molecules do not reorient rapidly about the axis of orientation, then broad powder patterns rather than single line spectra are observed.
Void and co-workers33 demonstrated that the addition of a small amount of lanthanide ions “flips” the bicelles to the parallel orientation. Subsequently this has become an active area of research in a number of different laboratories. We have shown that it is possible to orient protein-containing bicelles parallel to the field with the addition of lanthanide ions.38 Improvements are being made in magnetically orientable media for membrane proteins: for example, the use of chelating agents to sequester the lanthanide ions used to “flip” the bilayers. Bicelles and other magnetically orientable lipid systems need further refinement in order to provide samples that will remain stable over the course of multidimensional solid-state NMR experiments. However, there are a number of compelling reasons to continue to develop magnetically oriented bilayers. Samples in sealed glass containers enable better control of hydration and temperature; solenoidal coils have better rf homogeneity than flat coils; there is no loss in filling factor due to the glass plates; and the alignment is always exactly parallel to the field. If samples can be prepared by adding an HPLC-purified polypeptide to a mixture of lipids, water, and ions then it is likely that a wider range of biomedical researchers can perform structural studies of membrane proteins in their own laboratories. It is the combination of uniform labeling of expressed polypeptides, magnetically orientable lipid media, multidimensional solid-state NMR experiments, and high field spectrometers that has the potential to make protein structure determination by solid-state NMR spectroscopy generally applicable to membrane proteins.
The spectrum in Fig. 7A, obtained from a magnetically oriented bicelle sample of uniformly 15N-labeled fd coat protein, displays somewhat lower resolution compared to that of the glass-supported, oriented bilayer sample (Fig. 7B)38. Wobbling of the magnetically aligned bicelles about their axis of average orientation leads to motional averaging and, hence, scaling of the anisotropic interactions. In this example, the scaling is characterized by an order parameter of 0.70 ± 0.05, as determined by comparison with a rigid-lattice 15N amide chemical shift powder pattern.39 With further work, it may be possible to prepare magnetically oriented samples that yield spectra with resolution similar to that obtained with mechanically oriented samples.
Preparation of reconstituted bicelle samples
For the preparation of samples of 15N-labeled fd coat protein in lipid bicelles, the coat protein is purified in SDS (Buffer E) as described above for the glass-oriented sample. SDS and salts are removed by dialysis (MWCO 10,000) against water. After lyophilization, the protein is dissolved in 200 μl of TFE, and then transferred to a round-bottom flask. TFE is first removed by rotary evaporation, creating a thin film of protein on the walls of the flask, and then by placing the flask under high vacuum overnight. A solution of 18 mg of 1,2-dihexanoyl-sn-glycero-3-phosphocholine (DHPC; Avanti) in 150 μl of water is added to the dry protein film. This is followed by the addition of a dispersion of 92 mg of dimyristoyl-sn-glycerophosphocholine (DMPC; Avanti) in 240 μl of water that has been previously vortexed, frozen and thawed three times, and warmed to a temperature above the Tm of DMPC (23°). The mixture is briefly vortexed, quick-frozen in methanol/solid CO2, and allowed to slowly return to room temperature. The sample used for the NMR experiment shown in Fig. 7A consisted of a 22% (w/v) mixture of DMPC/DHPC, in a molar ratio of 3.4/1, and 0.25% molar fd coat protein. The bicelle sample, which is clear and free-flowing when cooled on ice, is placed in a glass cylindrical NMR tube, 6.5 mm in diameter and 20 mm long. At 43°, the bicelles orient with their normal perpendicular to the magnetic field. The addition of a solution of TmCl3, to obtain a final molar ratio of 0.05/1 of Tm3+/DMPC, flips the bicelles to the parallel orientation.
Structure Determination of Membrane Proteins in Lipid Bilayers
In nearly all applications of NMR spectroscopy to oriented membrane protein samples, the spin interactions between directly bonded nuclei are utilized and the bond length is assumed to be a fixed value, enabling angular constraints to be measured and directly interpreted. The measurement of multiple, orientationally dependent frequencies for nuclei at each residue, especially 15N-, 13C-, and 2H-labeled amide sites enables complete protein structure determination.26,28,40 This requires the resolution and assignment of the resonances in multidimensional solid-state NMR spectra.29,41,42
Resolution and Assignment of Backbone and Side-Chain Resonances
Until recently, solid-state NMR studies of proteins have relied nearly exclusively on specifically or selectively labeled samples. This type of isotopic labeling was essential for several different reasons, including basic sensitivity enhancement, spectral resolution, resonance assignments, and providing the spin interactions used for spectroscopic measurements. However, specific and selective labeling is costly in terms of effort and flexibility. In order to address this important issue, we developed a family of multidimensional solid-state NMR experiments that enable uniformly rather than selectively labeled samples to be utilized,43–44 and have shown that these experiments are capable of resolving among all sites in a uniformly 15N-labeled protein in bilayers.29 In three-dimensional solid-state NMR correlation spectra, each resonance has three associated frequencies from the 1H chemical shift, 1H–15N heteronuclear dipolar coupling, and 15N chemical shift interactions. These three spectral parameters are orientationally dependent and are sufficient to fully determine the orientation of each peptide plane with respect to the direction of the magnetic field and the sample orientation.
Resonance assignment to individual residues in a protein is the final necessary step, once the amide resonances have been resolved and their frequencies measured. Homonuclear spin exchange among either 1H or 15N nuclei provides a general spectroscopic assignment strategy for solid-state NMR spectra of uniformly 15N labeled proteins. Abundant spin exchange occurring among nearby 1H nuclei in model peptides45 and dilute spin exchange among 15N sites in both 15N-labeled model peptides and proteins46–49 have been demonstrated. Alternative assignment strategies, analogous to those used in solution NMR spectroscopy, that utilize uniformly 13C and 15N-labeled proteins and are based on 1H/15N/13C triple-resonance spectroscopy are also under development. They have been demonstrated in model peptides and oriented proteins.42–50
Spin-exchange experiments using 15N nuclei provide a general assignment strategy for solid-state NMR spectra of uniformly 15N-labeled proteins and were utilized to obtain some of the assignments in the PISEMA spectrum of the AchR M2 in bilayers. In the two-dimensional spin-exchange spectrum of M2, the resolution was limited by the 15N chemical shift dispersion. However, the PISEMA experiment, combined with 15N spin exchange, gave three-dimensional spectra characterized by 15N chemical shift, 15N chemical shift and 1H–15N dipolar coupling. The third frequency dimension provided the resolution needed for a resonance assignment pathway.
Measurement of Angular Constraints
A single three-dimensional correlation spectrum of an oriented sample of a uniformly 15N-labeled protein provides sufficient information for complete structure determination. The three frequencies, 1H chemical shift, 15N chemical shift, and 1H–15N dipolar coupling measured for each resonance depend on the magnitudes and orientations of the principal elements of the spin-interaction tensors, and on the orientation of the molecular site with respect to the direction of the applied magnetic field. Because the orientation of the bilayer is fixed by the method of sample preparation, each frequency reflects the orientation of a specific site in the protein with respect to the bilayer. Structures are calculated using the angular constraints extracted from the measured spectral frequencies. Using this approach, we have determined the three-dimensional structure of the M2 transmembrane segment from the acetylcholine receptor in oriented lipid bilayers.40 The 13C chemical shift and the 2H quadrupolar coupling frequencies measured in separate experiments also provide valuable structural information and have been used, together with the 15N chemical shift and 1H/15N dipolar coupling, to determine the structure of the gramicidin channel at high resolution.28 One advantage of this method for structure determination of membrane proteins is that it provides a highly detailed picture of the protein embedded in the membrane, potentially including the details of protein–membrane interactions. Both solution and solid-state NMR methods yield three-dimensional structures with atomic resolution; however, solid-state NMR on oriented lipid bilayer samples is unique in providing the complete topology, including the three-dimensional structure and orientation of the residues of the protein at high resolution.
Structure Determination
Given established covalent bond lengths and geometries, distance and angle measurements are interconvertible sources of structural information as illustrated in Fig. 8. The three-dimensional structure of the polypeptide backbone is depicted equivalently by vectors (Fig. 8A), representing the bonds between heavy atoms, and by the rectangular outlines of the peptide planes (Fig. 8B). It is generally necessary to measure two or more frequencies for each residue of a protein. Once the orientations of all of the individual peptide planes are determined experimentally, then the peptide planes can be assembled into a complete protein structure because they are all related to the common axis defined by the direction of the applied magnetic field. Importantly, side-chain orientations can be determined in a similar manner. An important feature of this approach is that experimental determinations are made relative to an external nonmolecular axis, and the effects of errors and uncertainties in measurements and the tensors and bond lengths do not accumulate.
Fig. 8.

Structure of an α helix in (A) bond vector representation and (B) peptide plane representation.
The final three-dimensional protein structure is mathematically related to the input experimental NMR frequencies. No averaging, assumptions, or databases need to be invoked in order to interpret these solid-state NMR data. The direct correlation between data and structure means that it is feasible to calculate the NME spectra from the structure. This provides an important check on the structure assembly process as well as the basis for a method of structure refinement. Back calculation of the starting NMR parameters from the structure at specified intervals of a molecular dynamics simulation can be incorporated as a penalty function into a refinement procedure to ensure that deviations in protein structure reflect experimental errors, and maintains the direct structure–experiment correlation.
Structural Indices and Pisa Wheels
On the path toward three-dimensional structure determination, the secondary structure and topology of membrane proteins can be described by inspection of the two-dimensional 1H/15N PISEMA spectra of uniformly 15N-labeled samples in oriented bilayers. The characteristic “wheel-like” patterns of resonances observed in these spectra reflect helical wheel projections51 of residues in both transmembrane and in-plane helices, and hence provide direct indices of secondary structure and topology of membrane proteins in phospholipid bilayers. We refer to these patterns as Pisa wheels.52,53
The resonance frequencies in PISEMA spectra of oriented samples or membrane proteins depend on helix orientation, as well as on the backbone dihedral angles, the magnitudes and orientations of the principal elements of the amide 15N chemical shift tensor, and the N–H bond length. Therefore, it is possible to calculate solid-state NMR spectra for specific structural models of proteins, as shown in Fig. 9. When the helix axis is parallel to the bilayer normal, all of the amide sites have an identical orientation relative to the direction of the applied magnetic field, and therefore all of the resonances overlap with the same dipolar coupling and chemical shift frequencies (Fig. 9A). Tilting the helix away from the membrane normal breaks the symmetry and introduces variations in the orientations of the amide NH bond vectors relative to the field (Figs. 9B–9G). This is manifest in the spectra as dispersions of both 1H–15N dipolar coupling and 15N chemical shift frequencies. Since a modest helix tilt of about 10° aligns the NH bond from one amide site and the σ33 amide 15N chemical shift tensor element of another amide site with the magnetic field, the maximum values of both of these frequencies are observed in the spectrum, albeit from different resonances. This is a direct consequence of σ33 of the amide shift tensor being rotated approximately 17° from the N–H bond vector. Many transmembrane helices are tilted with respect to the bilayer normal. The combination of tilt and the 17° angle between the σ33 and NH bond vectors makes it possible to resolve many resonances from residues in otherwise uniform helices and is responsible for the “wheel-like” pattern observed in two-dimensional PISEMA spectra of uniformly 15N labeled proteins.
Fig. 9.
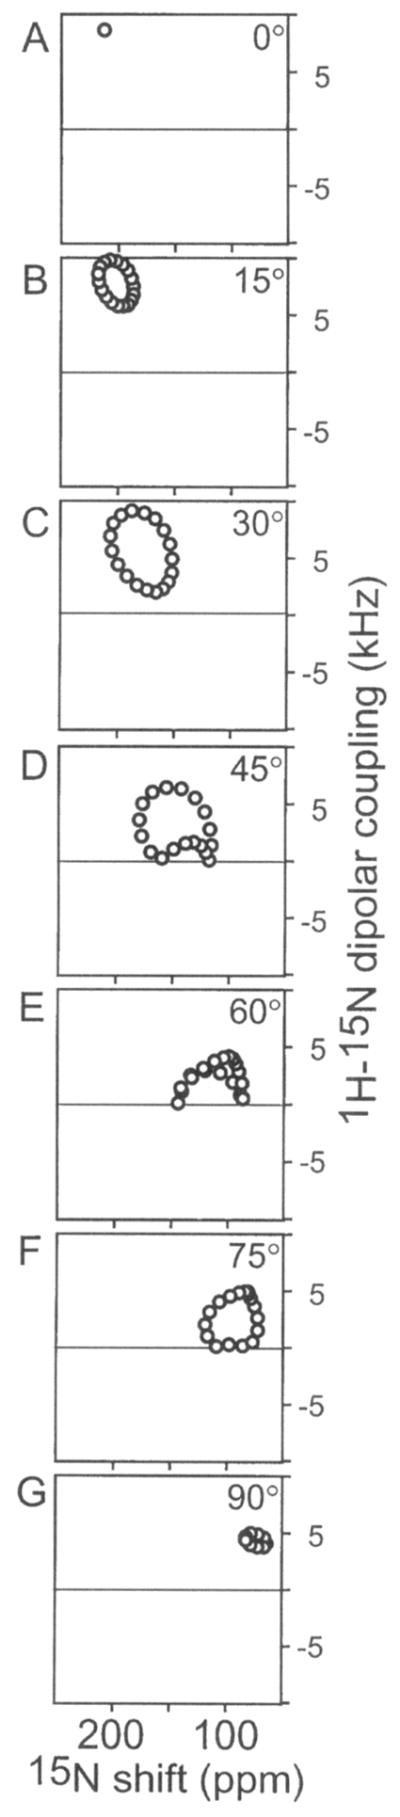
PISEMA 1H–15N dipolar coupling/15N chemical shift correlation spectra calculated for a 20-residue α-helix with uniform dihedral angles of φ = −65, ψ = −40, at different helix tilts relative to the membrane normal, (a) 0°; (b) 15°; (c) 30°; (d) 45°; (e) 60°; (f) 75°; (g) 90°. Only one-half of each symmetric spectrum is shown.
For all helix orientations other than parallel to the field (0°), the spectra have wheel-like patterns whose radii reflect the extent of helix tilt. For helices with tilts greater than 40°, some amide NH bonds adopt orientations near the magic angle (55°) and have resonances with dipolar couplings close to 0 kHz. Other amide N–H bonds are oriented with angles greater than 55° and have resonances with dipolar couplings of opposite sign, which results in a portion of the Pisa wheel PISEMA spectrum being reflected through the 0 kHz axis. Helices oriented parallel to the membrane surface have amide N–H bonds and 15N chemical shift σ33 vectors nearly orthogonal to the field. As a result, they give highly overlapped spectra with the resonance frequencies around 5 kHz and 75 ppm. The spectra in Fig. 9 demonstrate that it is possible to determine the tilt of a helix in lipid bilayers without resonance assignments.54 Cross and co-workers have performed a similar analysis and demonstrated its application to specifically labeled peptide samples.52
Pisa wheels have been observed in the PISEMA spectra of many uniformly 15N labeled α-helical membrane proteins.23,29,40,52,54,55 The pore-lining M2 transmembrane α helix of the AChR is the best-characterized example.40 The M2 α helix is tilted by 12° in lipid bilayers, and rotated about its long helix axis so that the hydrophilic residues face the N-terminal side of the membrane. This leads to the assembly of a symmetric, pentameric, funnel-like pore with its wide opening at the N-terminal side of the membrane. All of these conclusions about the qualitative structure of the AchR M2 in bilayers are immediately apparent from inspection of its assigned PISEMA spectrum, prior to complete structure determination.53 In the experimental PISEMA spectrum of AchR M2 (Fig. 10A), the Pisa wheel pattern of assigned resonances is identical to the helical wheel projection of the peptide shown in Fig. 10B. The helical wheel is arranged so that the residues align with their corresponding amide resonances. This arrangement is exactly as predicted by the assigned resonances in the simulated spectrum in Fig. 10C. The polarity of the Pisa wheel in a PISEMA spectrum provides a direct measure of the angle of helix rotation (polarity index) about its long axis, within the membrane. In principle, only a single assignment is needed to determine the polarity of a helix in the membrane. Similar correlations are found for in-plane helices and are predicted for β-stranded structures.53
Fig. 10.

Helical wheel projection and two-dimensional solid-state NMR PISEMA spectra of the uniformly 15N-labeled AchR M2 peptide in oriented lipid bilayers. (A) Helical wheel projection of AchR M2. (B) The experimental PISEMA spectrum of AchR M2 that provided the orientational constraints used for structure determination.40 (C) Spectrum calculated for an α helix with 3.6 residues per turn, and a tilt of 12° relative to the membrane normal.
Structure of Acetylcholine M2 Segment in Lipid Micelles and Bilayers
The three-dimensional structures of functional peptides corresponding to the M2 segments from the α subunit of the AchR and the NR1 subunit of the NMDAR were determined by solution and solid-state NMR spectroscopy in membrane environments.40 The relatively large quantities of isotopically labeled M2 peptides required for NMR spectroscopy were prepared by expression of recombinant peptides in E. coli for selective or uniform isotopic labeling, and by solid-phase synthesis for specifically labeled samples.
An essential feature of our approach was the direct correlation of the structures obtained by NMR spectroscopy in lipid micelles and bilayers with the functional properties of the channels recorded after reconstitution of the same peptides into lipid bilayers. The incorporation of the M2 peptides into lipid bilayers reconstitutes functional, cation-selective channels. Significantly, the channel properties of peptides prepared by expression in bacteria and by solid-phase synthesis are nearly identical. Furthermore, peptides with the same amino acid composition as the M2 but with scrambled sequences did not form channels, nor did peptides patterned after the sequences of the predicted M1, M3, or M4 helices. Taken together, these results indicate that both the recombinant and synthetic M2 peptides used in the NMR experiments were functional and formed sequence-specific, discrete ion channels in lipid bilayers.
NMR Spectroscopy
The two-dimensional solution 1H/15N HMQC spectrum of uniformly 15N-labeled AchR M2 peptide in DPC micelles is well resolved, with each amide resonance characterized by isotropic 1H and 15N chemical shift frequencies (Fig. 11A). Not surprisingly, the effect of the micelles on the reorientation rate is seen in line widths that are somewhat broader than expected for a peptide of this size in aqueous solution. The two-dimensional solid-state 1H/15N PISEMA spectrum of the same peptide in oriented bilayers (Fig. 11B) has similar resolution, with each amide resonance characterized by 15N chemical shift and 1H–15N dipolar coupling frequencies.
Fig. 11.

(A) Solution NMR 1H chemical shift/15N chemical shift correlation HMQC spectrum of AchR M2 in DPC micelles. (B) Solid-state NMR 1H–15N dipolar/15N chemical shift correlation PISEMA spectrum of AchR M2 in oriented lipid bilayers. (C) Superposition of the backbone heavy atoms for the 10 lowest energy structures of AchR M2 in DPC micelles. (D) Superposition of the average structure of the AchR M2 calculated from the solution NMR distance constraints (light), and the average structure determined from the solid-state NMR orientational constraints (dark). (E) Side and (F) top views of the AchR M2 pentameric bundle in the funnel-like architecture determined by solid-state NMR spectroscopy. The wide mouth of the funnel is on the N-terminal, intracellular side of the pore. The side view has the C terminus on top. The top view has the C-terminal synaptic side in front. A sodium ion is confined within the pore.
Solution NMR Structure of AchR M2 in Lipid Micelles
As expected for a helical peptide in micelles, the overlap in the amide NH and CαH regions of the solution NMR spectra of AchR M2 made it difficult to assign the resonances from 15N-edited TOCSY and NOESY experiments alone. In order to obtain complete backbone resonance assignments, and to measure the 13Cα chemical shifts, three-dimensional HNCA and HNCOCA experiments were performed on uniformly 13C and 15N labeled samples. The primary constraint used for structure determination by solution NMR spectroscopy is the homonuclear 1H/1H NOE. The structures that satisfy the NMR data, with no NOE violations greater than 0.5 Å and no dihedral angle violations greater than 5°, and that maintain acceptable peptide geometry are shown in Fig. 11C. The structures overlay best from residues Lys-2 to Gln-22 where the average RMSD of the heavy atoms of the backbone from the average structure is 0.77 ± 0.2 Å. AchR M2 in DPC micelles is an α helix that is only slightly curved and shows no evidence of kinks.
Solid-State NMR Structure of AchR M2 in Lipid Bilayers
The 15N chemical shift and 1H–15N dipolar coupling frequencies measured from the two-dimensional PISEMA spectrum (Fig. 11B) provided the orientational constraints for structure determination of 15N labeled AchR M2 in lipid bilayer membranes. Some of the resonances in the solid-state NMR spectrum were assigned with 15N dilute spin-exchange experiments, and others by comparison with selectively 15N-labeled synthetic peptides. The backbone structure of AchR M2, determined from 15N chemical shift, 1H–15N dipolar coupling, and some 1H chemical shift constraints, is shown in Fig. 11D (black). Superposition of the solution and solid-state NMR structures shows that they are similar, with an RMSD of 0.6 Å for the backbone atoms. Although both methods yield three-dimensional structures with atomic resolution, solid-state NMR on oriented lipid bilayer samples is unique in determining the complete topology, including three-dimensional structure and orientation, of the peptide in the membrane, at high resolution. This is an intrinsic component of membrane protein structure, and in the case of AchR M2 sheds light on the details of supramolecular channel architecture. The AchR M2 is a transmembrane α helix with its long helix axis tilted 12° relative to the lipid bilayer normal (98° from the lipid bilayer plane), in agreement with the structure inferred from the electron diffraction.56
Figures 11E and 11F show a model of the AChR channel pore, constructed from the solid-state NMR structure of the AChR M2 helix in lipid bilayers, and the pentameric organization of the channel. The optimized pentameric bundle has a right-handed, interhelical twist with an orientation angle of 12°. A central narrow pore has a diameter ranging from about 3.0 to 8.6 Å. Nonpolar residues are predominantly on the exterior of the bundle, while polar residues line the pore. The residues exposed to the pore lumen are Glu-1, Ser-4, Ser-8, Val-15, Leu-18, and Gln-22, in agreement with evidence collected from mutagenesis, affinity labeling, and cysteine accessibility measurements. A side view (Fig. 11F) shows a funnel-shaped bundle, 33 Å in length, with the wide mouth at the N terminus.
Discussion
NMR spectroscopy can determine the structures of helical membrane proteins in micelles and bilayers. The initial results on functional peptides are being extended to proteins of some complexity, including those with more than one biological activity. The methods for expression and purification of these proteins from bacteria and the preparation of samples in lipids are as important as the instrumentation and methods for the NMR experiments. A variety of NMR experiments is under development for studies for membrane proteins, including those that do not require sample orientation. However, recent results suggest that the determination of three-dimensional structures and extensions to larger membrane proteins will rely on the effects of sample orientation in both solution NMR and solid-state NMR experiments.
Acknowledgments
We thank the members of the group who contributed to the research on membrane proteins, in particular G. Veglia, D. Jones, S. Straus, A. Prantner, M. Mesleh, and K. Valentine, and our collaborators M. Montal and K. Strebel. This research was supported by grants RO1 GM29754 and PO1 GM 56538 from the National Institute of General Medical Sciences to S.J.O. and the W.W. Smith Charitable Trust to F.M.M. It utilized the Resource for Solid-State NMR of Proteins, supported by grants P41 RR09731 and RO1 RR from the Biomedical Research Technology Program, National Center for Research Resources, National Institutes of Health.
References
- 1.Staley JP, Kim PS. Protein Sci. 1994;3:1822. doi: 10.1002/pro.5560031021. [DOI] [PMC free article] [PubMed] [Google Scholar]
- 2.Gross E, Witkop B. J Am Chem Soc. 1961;83:1510. [Google Scholar]
- 3.Wüthrich K. NMR of Proteins and Nucleic Acids. Wiley; New York: 1986. [Google Scholar]
- 4.Clore GM, Gronenborn AM. Crit Rev Biochem Mol Biol. 1989;24:479. doi: 10.3109/10409238909086962. [DOI] [PubMed] [Google Scholar]
- 5.Nelson JW, Kallenbach NR. Biochemistry. 1989;28:5256. doi: 10.1021/bi00438a050. [DOI] [PubMed] [Google Scholar]
- 6.McDonnell PA, Shon K, Kim Y, Opella SJ. J Mol Biol. 1993;233:447. doi: 10.1006/jmbi.1993.1523. [DOI] [PubMed] [Google Scholar]
- 7.Ikura M, Krinks M, Torchia DA, Bax A. FEBS Lett. 1990;266:155. doi: 10.1016/0014-5793(90)81528-v. [DOI] [PubMed] [Google Scholar]
- 8.Ikura M, Kay LE, Bax A. Biochemistry. 1990;29:4659. doi: 10.1021/bi00471a022. [DOI] [PubMed] [Google Scholar]
- 9.Tolman JR, Flanagan JM, Kennedy MA, Prestegard JH. Proc Natl Acad Sci USA. 1995;92:9279. doi: 10.1073/pnas.92.20.9279. [DOI] [PMC free article] [PubMed] [Google Scholar]
- 10.Tjandra N, Grzesiek S, Bax A. J Am Chem Soc. 1996;118:6264. [Google Scholar]
- 11.Tjandra N, Bax A. Science. 1997;278:1111. doi: 10.1126/science.278.5340.1111. [DOI] [PubMed] [Google Scholar]
- 12.Sass J, Cordier F, Hoffman A, Rogowski M, Cousin A, Omichinski JG, Löwen H, Gresiek S. J Am Chem Soc. 1999;121:2047. [Google Scholar]
- 13.Hansen MR, Mueller L, Pardi A. Nat Struct Biol. 1998;5:1065. doi: 10.1038/4176. [DOI] [PubMed] [Google Scholar]
- 14.Clore GM, Starich MR, Gronenborn AM. J Am Chem Soc. 1998;120:10571. [Google Scholar]
- 15.Kishchenko G, Makowski L. Prot Struct Funct Genet. 1997;27:405. doi: 10.1002/(sici)1097-0134(199703)27:3<405::aid-prot8>3.0.co;2-b. [DOI] [PubMed] [Google Scholar]
- 16.Contreras MA, Ubach J, Millet O, Rizo J, Pons M. J Am Chem Soc. 1999;121:8947. [Google Scholar]
- 17.Biekofsky RR, Muskett FW, Schmidt JM, Martin SR, Browne JP, Bayley PM, Feeney J. FEBS Lett. 1999;460:519. doi: 10.1016/s0014-5793(99)01410-6. [DOI] [PubMed] [Google Scholar]
- 18.Tolman JR, Flanagan JM, Kennedy MA, Prestegard JH. Nat Struct Biol. 1997;4:292. doi: 10.1038/nsb0497-292. [DOI] [PubMed] [Google Scholar]
- 19.Williams TC, Corson DC, Sykes BD. J Am Chem Soc. 1984;106:5698. [Google Scholar]
- 20.Allegrozzi M, Bertini I, Janik MBL, Lee Y-M, Liu G, Luchinat C. J Am Chem Soc. 2000;122:4154. [Google Scholar]
- 21.Hus J-C, Marion D, Blackledge M. J Mol Biol. 2000;298:927. doi: 10.1006/jmbi.2000.3714. [DOI] [PubMed] [Google Scholar]
- 22.Al-Hashimi HM, Valafer H, Terrell M, Zartler ER, Eidsness MK, Prestegard JH. J Magn Reson. 2000;143:402. doi: 10.1006/jmre.2000.2049. [DOI] [PubMed] [Google Scholar]
- 23.Marassi FM, Ma C, Gratkowski H, Strans SK, Strebel K, Oblatt-Montal M, Montal M, Opella SJ. Proc Natl Acad Sci USA. 1999;96:14336. doi: 10.1073/pnas.96.25.14336. [DOI] [PMC free article] [PubMed] [Google Scholar]
- 24.Pervushin K, Riek R, Wider G, Wüthrich K. Proc Natl Acad Sci USA. 1997;94:12366. doi: 10.1073/pnas.94.23.12366. [DOI] [PMC free article] [PubMed] [Google Scholar]
- 25.Smith SO, Smith CS, Bormann BJ. Nat Struct Biol. 1996;3:252. doi: 10.1038/nsb0396-252. [DOI] [PubMed] [Google Scholar]
- 26.Opella SJ. Nat Struct Biol. 1997;4:845. [PubMed] [Google Scholar]
- 27.Griffin R. Nat Struct Biol. 1998;5:508. doi: 10.1038/749. [DOI] [PubMed] [Google Scholar]
- 28.Ketchem RR, Hu W, Cross TA. Science. 1993;261:1457. doi: 10.1126/science.7690158. [DOI] [PubMed] [Google Scholar]
- 29.Marassi FM, Ramamoorthy A, Opella SJ. Proc Natl Acad Sci USA. 1997;94:8551. doi: 10.1073/pnas.94.16.8551. [DOI] [PMC free article] [PubMed] [Google Scholar]
- 30.Kovacs FA, Cross TA. Biophys J. 1997;73:2511. doi: 10.1016/S0006-3495(97)78279-1. [DOI] [PMC free article] [PubMed] [Google Scholar]
- 31.North CL, Cross TA. Biochemistry. 1995;34:5883. doi: 10.1021/bi00017a018. [DOI] [PubMed] [Google Scholar]
- 32.Ulrich AS, Wallat I, Heyn MP, Watts A. Nat Struct Biol. 1995;2:190. doi: 10.1038/nsb0395-190. [DOI] [PubMed] [Google Scholar]
- 33.Prosser RS, Hunt SA, Vold RR. J Magn Reson B. 1995;109:109. [Google Scholar]
- 34.Bayer R, Feigenson GW. Biochim Biophys Acta. 1985;815:369. doi: 10.1016/0005-2736(85)90363-3. [DOI] [PubMed] [Google Scholar]
- 35.Prosser RS, Hunt SA, DiNatale JA, Vold RR. J Am Chem Soc. 1996;118:269. [Google Scholar]
- 36.Sanders CR, Landis GC. Biochemistry. 1995;34:4030. doi: 10.1021/bi00012a022. [DOI] [PubMed] [Google Scholar]
- 37.Losonczi JA, Prestegard JH. Biochemistry. 1998;37:706. doi: 10.1021/bi9717791. [DOI] [PubMed] [Google Scholar]
- 38.Howard KP, Opella SJ. J Magn Reson B. 1996;112:91. doi: 10.1006/jmrb.1996.0116. [DOI] [PubMed] [Google Scholar]
- 39.Wu CH, Ramamoorthy A, Gierasch LM, Opella SJ. J Am Chem Soc. 1995;117:6148. [Google Scholar]
- 40.Opella SJ, Marassi FM, Gesell JJ, Valente AP, Kim Y, Oblatt-Montal M, Montal M. Nat Struct Biol. 1999;6:374. doi: 10.1038/7610. [DOI] [PMC free article] [PubMed] [Google Scholar]
- 41.Marassi FM, Gesell JJ, Valente AP, Kim Y, Oblatt-Montal M, Montal M, Opella SJ. J Biomol NMR. 1999;14:141. doi: 10.1023/a:1008391823293. [DOI] [PMC free article] [PubMed] [Google Scholar]
- 42.Tan WM, Gu ZT, Zeri AC, Opella SJ. J Biomol NMR. 1999;13:337. doi: 10.1023/a:1008379105545. [DOI] [PubMed] [Google Scholar]
- 43.Ramamoorthy A, Wu CH, Opella SJ. J Am Chem Soc. 1997;119:10479. [Google Scholar]
- 44.Ramamoorthy A, Wu CH, Opella SJ. J Magn Reson. 1999;140:131. doi: 10.1006/jmre.1999.1827. [DOI] [PubMed] [Google Scholar]
- 45.Ramamoorthy A, Gierasch LM, Opella SJ. J Magn Reson B. 1996;111:81. doi: 10.1006/jmrb.1996.0063. [DOI] [PubMed] [Google Scholar]
- 46.Cross TA, Opella SJ. J Am Chem Soc. 1983;105:306. [Google Scholar]
- 47.Morden KM, Opella SJ. Biophys J. 1986;49:A328. [Google Scholar]
- 48.Ramamoorthy A, Wu CH, Opella SJ. J Magn Reson B. 1995;107:88. doi: 10.1006/jmrb.1995.1063. [DOI] [PubMed] [Google Scholar]
- 49.Opella SJ. Biophys J. 1998;74:A34. doi: 10.1016/S0006-3495(98)74021-4. [DOI] [PMC free article] [PubMed] [Google Scholar]
- 50.Gu ZTT, Opella SJ. J Magn Reson. 1999;140:340. doi: 10.1006/jmre.1999.1825. [DOI] [PubMed] [Google Scholar]
- 51.Schiffer M, Edmunson AB. J Magn Reson. 1967;7:121. [Google Scholar]
- 52.Wang J, Denny J, Tian C, Kim S, Mo Y, Kovacs F, Song Z, Nishimura K, Gan Z, Fu R, Quine JR, Cross TA. J Magn Reson. 2000;144:162. doi: 10.1006/jmre.2000.2037. [DOI] [PubMed] [Google Scholar]
- 53.Marassi FM, Opella SJ. J Magn Reson. 2000;144:150. doi: 10.1006/jmre.2000.2035. [DOI] [PMC free article] [PubMed] [Google Scholar]
- 54.Marassi FM, Ma C, Gesell JJ, Opella SJ. J Magn Reson. 2000;144:156. doi: 10.1006/jmre.2000.2036. [DOI] [PubMed] [Google Scholar]
- 55.Kim Y, Valentine K, Opella SJ, Schendel SL, Cramer WA. Protein Sci. 1998;7:342. doi: 10.1002/pro.5560070214. [DOI] [PMC free article] [PubMed] [Google Scholar]
- 56.Unwin AP, Bower DI, Ward IM. Polymer. 1985;26:1605. [Google Scholar]