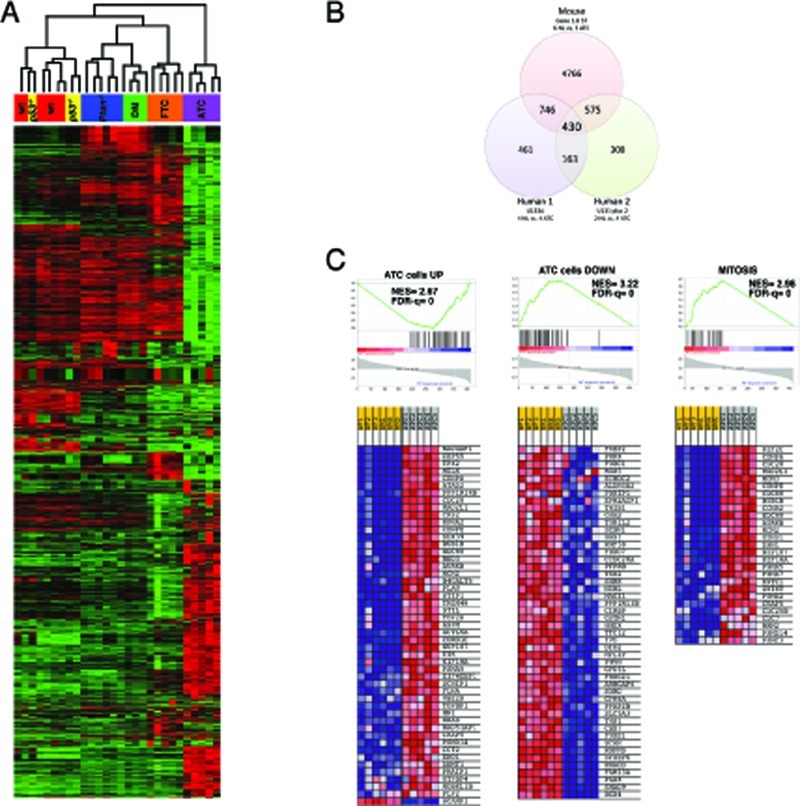
Figure 6. Expression profiling validates the [Pten, p53]thyr−/− mouse as a clinically relevant model of human ATC.

(A) Hierarchical clustering showing the unique expression profile of mouse ATCs when compared to controls, single mutants, ATC-free double mutants (DM), and follicular carcinomas developing in aging Ptenthyr−/− mice (FTC). (B) Venn's diagram showing the significant overlap between genes differentially regulated in mouse and human ATCs. (C) GSEA analysis of the 430 genes common to mouse and human ATC, showing significant enrichment in genes previously shown to be altered in human ATC cell lines as well as genes involved in the control of mitosis.
