

Abstract
Repeat proteins contain tandem arrays of a simple structural motif. In contrast to globular proteins, repeat proteins are stabilized only by interactions between residues that are relatively close together in the sequence, with no “long-range” interactions. Our work focuses on the tetratricopeptide repeat (TPR), a 34 amino acid helix-turn-helix motif found in tandem arrays in many natural proteins. Earlier, we reported the design and characterization of a series of consensus TPR (CTPR) proteins, which are built as arrays of multiple tandem copies of a 34 amino acid consensus sequence. Here, we present the results of extensive hydrogen exchange (HX) studies of the folding-unfolding behavior of two CTPR proteins (CTPR2 and CTPR3). We used HX to detect and characterize partially folded species that are populated at low frequency in the nominally folded state. We show that for both proteins the equilibrium folding-unfolding transition is non-two-state, but sequential, with the outermost helices showing a significantly higher probability than inner helices of being unfolded. We show that the experimentally observed unfolding behavior is consistent with the predictions of a simple Ising model, in which individual helices are treated as “spin-equivalents”. The results that we present have general implications for our understanding of the thermodynamic properties of repeat proteins.
Keywords: native-state hydrogen exchange, protein folding, tetratricopeptide repeat (TPR), 1D-Ising model, partially unfolded form
Introduction
Repeat proteins present a modular architecture composed of tandem arrays of a defining structural motif. There are many different types of repeat proteins, including ankyrin repeats, armadillo repeats, leucine-rich repeats and tetratricopeptide repeats (TPR).1–3 Repeat proteins are stabilized only by interactions between residues that are relatively close together in the sequence, with no `long range' interactions.2 This stands in contrast to the more extensively studied globular proteins, in which the folded structure is stabilized both by interactions between residues that are close in sequence, and by interactions between residues that are distant in sequence, yet come close together in the folded state. The simple modular design of repeat proteins, and the dominance of interactions between residues that are close together in the sequence, makes the study of repeat protein folding of interest, both intrinsically and in comparison to the behavior of globular proteins.1,4–7 For example, the thermodynamics of repeat protein folding can be described by simpler models8,9 and the energy landscape10,11 and the folding pathways12 of repeat proteins can be modulated by changing the stability of the individual units.7
Our work focuses on the tetratricopeptide repeat (TPR), which is a 34-amino-acid helix-turn-helix motif found in tandem arrays of 3 to over 16 repeats in many natural proteins.13,14 We have previously reported the design and characterization of a series of consensus TPR (CTPR) proteins.9,15–17 CTPRn proteins are built as arrays of multiple tandem copies (n) of a 34 amino acid consensus helix-turn-helix repeat terminated by a single “solvating” helix. All the CTPR proteins are stable and adopt the distinctive TPR fold (Fig. 1).9,15,16
Fig. 1.

CTPR2 and CTPR3 crystal structures. Ribbon representation of CTPR2, PDB ID 1NA3 (a) and CTPR3, PDB ID 1NA0 (b) crystal structures.15 The helices are named as helix A or B and with the number of the repeat. The helices A1 and solvating (S) with exchange rates too fast to be measured are colored gray. For CTPR2 helices B1 and B2, which are identical according to the Ising treatment, are colored magenta and red, and the central helix (A2) is colored green. For CTPR3, the different helices are named and colored as follows: helices A1 and S in gray, the two pairs of equivalent helices according to the Ising treatment B1 and B3 (cyan and blue) and A2 and A3 (magenta and red), and central B2 helix (green). The schematics show the helices in CTPR2 and CTPR3 for which the exchange parameters have been measured, the color code matches with the colors in the ribbon representations.
Here, we present the results of extensive hydrogen exchange (HX) studies of the folding-unfolding behavior of two CTPR proteins (CTPR2 and CTPR3, which contain five and seven α-helices, respectively) in which we specifically probe the nature of partially folded states. HX, which measures the exchange of backbone amide protons with the solvent, allows us to monitor the average state of individual residues within a protein.18–21 Backbone amide protons that participate in H-bonding, or are shielded from solvent, are protected from exchange with solvent to a much greater extent than are solvent-exposed, non-H-bonded amide protons. As a result, HX experiments reveal extremely rare unfolding events,22 which facilitate hydrogen exchange, within the nominally folded state of a protein, thus providing a means by which to characterize the excursions of TPR proteins into partially folded conformations.
Finally, we compare the experimentally observed behavior with that suggested by an Ising model. We showed recently that the stability of a series of CTPR proteins, containing from two to 20 repeats (CTPR2- CTPR20), may be described quantitatively by a simple 1D-Ising model.9 According to this description, the TPRs′ constituent helices correspond to Ising spins, (si=+1), interacting via a nearest-neighbor coupling. Thus, spin up (si=+1) in the Ising model corresponds to the folded state of a TPR helix, while spin down (si=−1) corresponds to the unfolded state. The Ising model free energy is defined as:
| (1) |
where H is 1/(kBT) multiplied by one-half of the difference in free energy between the folded and unfolded states of a single helix in the absence of coupling to its neighbors, and J determines the coupling free energies between neighboring helices. Note that a positive H favors the folded state. Although simple, this model captures accurately the dependence on the number of repeats of the folding-unfolding behavior of an entire series of CTPRs, using just three parameters: J, xc, and m1, where xc and m1 determine H, via the relationship H=m1 (xc - x), where x is the denaturant (concentration of GuHCl or temperature). Indeed, the denaturation measurements obtained for any two CTPRs in a series is then sufficient to predict accurately the shape and midpoint of the chemically or thermally induced denaturation curves of all other proteins, of different lengths, in that series.
A prediction of the Ising model is the existence of intermediate, partially folded configurations that are populated with significant probability across the denaturation transition, i.e. configurations with unfolded end helices, but with folded central helices. Even far into the nominally folded state, the Ising model yields quantitative predictions for the probability that such partially-folded, “end-frayed” configurations will occur. This predicted end-fraying effect is analogous to the behavior observed for short monomeric peptides.23,24 Such peptides show a distribution of helical and non-helical conformations, with the central residues having the highest probability of being helical, while the ends fray. The behavior of helical peptides has long been known to be well described by an Ising model treatment.25Y28 The difference is that in our simplified treatment of TPR folding-unfolding, individual helices, rather than individual amino acids, take the role of Ising spin equivalents.
Results and Discussion
Residue-specific hydrogen exchange in the absence of denaturant
The rate of exchange with solvent of each uniquely assignable amide proton was measured for CTPR2 and CTPR3.4 From these measurements, protection factors (PFs) were calculated as the ratio of the observed exchange rate for a particular amino acid in the folded protein kex to the tabulated exchange rate of that amino acid in an unstructured peptide kex (U) (kex (U) =kint). In Fig. 2, the PF for each backbone amide proton is plotted versus sequence for both CTPR2 and CTPR3. For ease of comparison, the relative registration of the two proteins has been adjusted, so that their central helices are aligned. Examination of these data reveals that: (1) the protection factor for each backbone proton in CTPR2 is significantly less than that of the corresponding proton in CTPR3; (2) the inner helices show greater protection from exchange than the outer helices; (3) within each helix, the general pattern is for central residues to be more protected than end residues. Point (2) implies that the helices fray as anticipated. In addition, point (3) indicates that, we observe “fraying” from the ends in the context of helices within the protein, and in the context of amino acids within each helix (Fig. 2b). Interestingly, then, these observations mirror the fraying behavior at the ends of helices that has been reported for isolated, short helical peptides.23,24
Fig. 2.
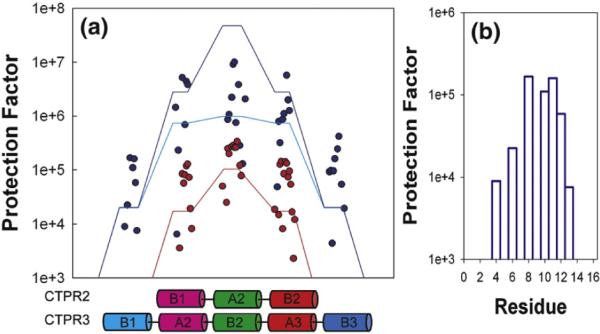
Ising model prediction of hydrogen exchange data. (a) Experimental hydrogen exchange protection factors (circles) and Ising prediction (lines) for the inverse probability that a given residue is in an unfolded configuration () for CTPR2 (red line) and CTPR3 (blue line) (Eq. (3) when pf=1, kex (F)/kex (U) =0). The magenta and cyan lines correspond to the model that includes the exchange from the folded state (Eq. (3) for kex (F)/kex (U) =3×10⁻⁷. The red line falls exactly on top of the magenta line, obscuring it. The diagonal lines connecting the levels are simply a guide to the eye. The schematics on the x-axis represent the helices in which the individual residue protection factors were measured. For ease of comparison, the central helices of CTPR2 and CTPR3 are aligned. The color code used matches that in Fig. 1. (b) Close-up of the fraying behavior of CTPR3 B1 helix. The protection factors are plotted versus the residue number within the helix.
Under conditions very far from unfolding, most amide HX may be ascribed to local fluctuations, which likely involve breaking individual hydrogen bonds. Such reactions occur very infrequently. However, even in the nominally folded state, we may expect transient partial unfolding reactions to occur which then permit HX from unfolded configurations. Under conditions in which the hydrogen exchange reaction is the rate-limiting step (EX2 mechanism), then the total HX rate (kex) for a particular amide hydrogen may be expressed as the appropriately weighted sum of the contributions from these two pathways, i.e.:
| (2) |
where pf and pu (pu=1−pf) are the probabilities that the amide hydrogen in question is in either the folded state or the unfolded state, respectively, and kex (F) and kex (U) are the HX rates from the folded and unfolded states, respectively. It follows that the protection factor may be written as:
| (3) |
where the last equality follows from setting pf equal to 1, which is an excellent approximation except near the unfolding transition. We may expect kex (F) / kex (U)<<1, although the value of this ratio is not known a priori.
Equation (3) allows the results of the HX experiments to be interpreted in the context of the Ising model described above, if we make the assumption that the probability that an amino acid is in the exchange-competent state is equal to the probability that the helix containing that amino acid is unfolded. Although the Ising model applied in this fashion cannot account for residue-to-residue variations within a helix, it has the potential to capture the overall behavior of the system.
Initially, we assume that pu>>kex (F)/ kex (U). It then follows that PF= (pu)−1. The experimentally determined protection factors (symbols), together with the Ising model predictions for (pu)−1 (lines) are plotted in Fig. 2 for each amino acid in CTPR2 (red) and CTPR3 (blue). Application of the Ising model in this fashion indeed captures the overall behavior of the system, with helices nearer the ends of the molecule having lower PFs than those nearer the middle, in both CTPR2 and CTPR3. Moreover, the experimentally determined protection factors for CTPR2 all lie within a factor of 10 of those predicted on the basis of this simplified model with no adjustable parameters.
The model also predicts that the protection factors for all the helices of CTPR3 should be greater than those for the corresponding helices of CTPR2. This difference is observed in the experimentally determined exchange behavior. Moreover, the relative magnitude of the predicted protection factors for each helix in CTPR3 mirrors the experimentally observed exchange data (Fig. 2). For the centermost helix of CTPR3, however, the experimental PFs are smaller, by a factor of about 50, than those predicted by Eq. (3). One way to explain this discrepancy is to allow for the possibility of HX exchange directly from the folded state (which would correspond to a non-zero value of kex (F)/kex (U) in Eq. (3)).29 The consequences of a non-zero value for kex (F)/kex (U) are illustrated in Fig. 2, where the magenta and cyan lines show the predictions of Eq. (3) for kex (F)/kex (U)=3×10⁻⁷, which is the value that best fits the experimentally observed data. The predicted PFs for all but the centermost helix of CTPR3 are essentially unchanged from those from Eq. (3), where kex (F)/kex (U)= 0, while for the centermost helix of CTPR3 kex (F)/kex (U)=3×10⁻⁷can reproduce the observed behavior.
Native state hydrogen exchange (NHX)
So-called native state HX (NHX) measurements have proven to be a powerful means by which to assess the relative stability of different parts of a protein, and to identify regions that undergo excursions into unfolded conformations, whilst the majority of the protein is folded.18,30 NHX involves HX measurements, performed at low concentrations of denaturant, so that local unfolding is promoted and the population of partially folded states is consequently increased. Measuring the denaturant-dependence of the HX rate allows protons to be grouped together if their exchange rates show the same denaturation dependence, permitting the identification of regions within the protein that behave as a unit. Eventually, at high enough concentrations of denaturant, all the residues in the protein will exchange via a global unfolding mechanism, and thus all will show the same denaturant-dependence of exchange.31–34
Accordingly, we performed NHX measurements on CTPR2 and CTPR3. Because pu depends on the concentration of denaturant, Eq. (2) explicitly shows that the relative importance of the two contributions to kex depends upon the amount of denaturant. Thus, NHX measurements also allow us to further test the proposed interpretation of the HX observed in the absence of denaturant.
We measured the exchange rates of the backbone amide protons in CTPR2 and CTPR3, at several concentrations of GuHCl, conditions under which the protein appears fully folded, as monitored by CD (Fig. 4a, inset) and that we have previously shown to be in the EX2 regime (bimolecular exchange).4 Examples of peak intensity versus time-decay curves are shown in Fig. 3. For both CTPR2 and CTPR3 the exchange rates of the N-and C-terminal helices (helix A1 and the solvating helix, colored in gray in Fig. 1) are too rapid to measure under the conditions used. For CTPR2, we therefore measured the exchange for three helices, the central helix A2 and flanking helices B1 and B2. For CTPR3, we measured the exchange for five helices (helices B1, A2, B2, A3, and B3).
Fig. 4.

Native hydrogen exchange data of CTPR2 and CTPR3 helices. (a) Exchange data for CTPR2. Plot of protection factor versus [Gu–HCl] for the different helices in CTPR2. The symbols represent the experimental averaged data for each helix and the lines the predicted Gu–HCl dependence from the Ising model (B1 helix, magenta; B2 helix, red; A2 central helix, green). The inset shows the chemical denaturation curves of CTPR2 (filled circles), CTPR3 (open circles) in water and the denaturation of CTPR3 in D2O (open triangles). (b) Exchange data for CTPR3. Protection factor versus [Gu–HCl] for the individual helices in CTPR3. The symbols show the experimental averaged data from all the residues within each helix, and the lines show the dependence on the [Gu–HCl] predicted by the Ising model (B1 helix, cyan; B3 helix, blue; and; A2 helix, magenta; A3 helix, red; and: B2 central helix, green). The color code used in the protection factor versus [Gu–HCl] plots for CTPR2 and CTPR3 matches with the color code for the helices in the ribbon representations in Fig. 1.
Fig. 3.

Exponential decay of intensity signal of a representative amide proton. Exponential decay of the intensity of the amide proton peak for the D73 residue in CTPR2. The curves show the decay at different [Gu–HCl] (0 M, filled circle; 0.25 M, open circle; 0.5 M, filled triangles; 0.75 M, open triangles; and 1 M, filled squares). The lines show a single exponential fit to Eq. (4).
For CTPR2 a clear difference is observed between the protection factors for residues in the central helix (A2, green circles) and the flanking helices (B1 and B2, red and magenta circles). In Fig. 4a we plot the average protection factor for a given helix versus concentration of denaturant. The denaturant-dependence of the average protection factor for residues in the central helix (A2) is clearly different from the average value for residues in the flanking helices (B1 and B2). The denaturant-dependence of the average protection factor for residues in each of the flanking helices is very similar.
For CTPR3, an even larger difference in the denaturant-dependence of the protection factors for the central helix (B2, green circles) versus the two sets of flanking helices (A2 and A3, red and magenta, and B1 and B3, blue and cyan) is evident (Fig. 4b). These data suggest that each helix unfolds as an independent unit and are also consistent with the idea that the CTPR proteins unfold by fraying from the ends. Komives and colleagues investigated the stability of tandem arrays of ankyrin repeats in the protein IκBα, using HX monitored by mass spectrometry. Exactly analogous to our results, they found that central repeats are more protected from exchange than are repeats at both ends.35
Figure 4 also shows the Ising model predictions for the denaturant-dependence of the protection factors for each helix. Overall, the model captures the behavior of the different helices supporting the idea that each helix is an independent folding unit. However, for both CTPR2 and CTPR3, although the dependence on the concentration of denaturant of the experimentally observed protection factors and those predicted by the Ising model are very similar, there is apparently a multiplicative ”offset” between the measured and the predicted protection factors for all the helices (Fig. 4). The measured protection factors are approximately twice those predicted. What could be the origin of this effect?
(1) Some proteins have been shown to be more stable in 2H2O than in H2O,36–38 and the CD data (on which the Ising fits were based) were performed in H2O, whereas the HX experiments were performed in 2H2O, but for both CTPR2 and CTPR3 we saw no appreciable difference in protein stability in H2O versus 2H2O (Fig. 4a, inset). (2) Slow cis-trans proline isomerization in the unfolded state can also lead to the measurement of higher stabilities in HX experiments compared to CD measurements.38 CTPR proteins present only one trans-proline per repeat, which could increase the stability by 0.072 kcal mol−1 per proline residue (i.e. 0.144 kcal mol−1 in CTPR2 and 0.216 kcal mol−1 in CTPR3). This contribution is much smaller than the difference in protection observed. (3) It has been shown experimentally that the intrinsic exchange rates in an unfolded helix can be slower than the rates from model peptides that are used in the protection factor calculations, because there can be more residual structure in an unfolded helical peptide than in a short model peptide.39 This effect causes the apparent protection factors measured by HX to be overestimated. We have shown that the unfolded state of all TPR proteins in the series CTPR2 to CTPR20 shows residual structure, specifically extensive polyproline II secondary structure (A.L.C. and L.R., unpublished results). We therefore conclude that the existence of such residual structure in the ”unfolded state” of CTPR2 and CTPR3 is the most reasonable explanation for the offset we observe.
Cooperative folding units
Under EX2 conditions, protection factors can be converted directly into free energies of unfolding (ΔGex), as described in detail in Materials and Methods. Amide protons display denaturant-dependent exchange as well as exchange due to local fluctuations, which are independent of the concentration of denaturant. To deconvolute the contributions of these two different processes to the measured values of ΔGex, we plotted ΔGex versus[Gu-HCl] for each amide proton, and fit these curves to Eq. (7), which takes into consideration both effects. We were thus able to calculate the free energies of the denaturant-independent local fluctuations (ΔGLF) and of the denaturant-dependent sub-global unfolding events (ΔGUNF), and the value of mex, the denaturant-dependence of ΔGUNF.40 ΔGex versus[Gu-HCl] plots for representative residues are shown in Fig. 5.
Fig. 5.

Hydrogen exchange free energy (ΔG) data as a function of [Gu–HCl]. Data for five representative residues from the five centermost helices of CTPR3: residues K34 in helix B1 (cyan), Y53 in helix A2 (magenta), Y66 in helix B2 (green), Y87 in helix A3 (red) and residue I97 in helix B3 (blue). The red lines correspond to the fits to Eq. (7). ΔGUNF and m-values are better determined for residues K34 and Y53, for example, than for residue Y66 (central helix) because the more points there are in the region of linear dependence on denaturant concentration the better the fit.
In Fig. 6a and b the ΔGUNF versusmex-values are plotted for each amide proton in CTPR2 and CTPR3, respectively. The smaller circles correspond to each individual amide protons and the larger circles correspond to the average values for all the amide protons within each helix.
Fig. 6.

Residue-specific hydrogen exchange data of CTPR2 and CTPR3. (a) ΔGversusmexplot for the residues in B1 (magenta), A2 (green) and B2 (red) helices of CTPR2 (small circles) and the averaged values for each helix (large circles). (b) ΔGversusmexplot for the residues in B1 and B3 (cyan and blue); A2 and A3 (magenta and red) and B2 (green) helices in CTPR3 (small circles) and the averaged values for each helix (large circles).
Amide protons that exchange through the same sub-global unfolding event should share similar values of both ΔGUNF and mex. If a protein underwent a single, concerted, unfolding event, a plot of ΔGUNF versusmex would show all the amide protons grouped together.40 By contrast, for a protein with multiple unfolding units, residues from independent unfolding units would be characterized by their different ΔGUNF and mex-values. The group of residues with the highest energy represents the global unfolding of the protein and the groups with lower energy reveal partially unfolded species.
Figure 6a shows the results for the helices B1 (magenta), A2 (green) and B2 (red) of CTPR2. It is clear that the centermost helix (A2) presents larger ΔGUNF and mex-values compared to the helices closer to the ends (B1 and B2). As expected because of the pseudo-symmetry of the molecule, B1 and B2 helices show very similar behavior.
For CTPR3, the differences in ΔGUNF and mex between the helices are more evident than for CTPR2, and the residues in the different helices can be clearly grouped into sub-global unfolding units (Fig. 6b). The centermost helix (B2, green) shows the largest ΔGUNF and mex values and represents the global unfolding of the protein. The helices moving out from the center present smaller ΔGUNF and mex-values. Again, because of the pseudo-symmetry of the molecule A2 (magenta) and A3 (red) helices group together and the helices as do helices B1 (cyan) and B3 (blue).
The values for the individual amide protons show variations and cluster around the average value for each helix. Specifically, within each helix, residues closer to the ends of the helix exchange faster than the residues closer to the center. Although the superposition of this effect causes “spread” in the data we can clearly distinguish the presence of high-energy partially unfolded species in the equilibrium between folded and unfolded state, with each helix being identifiable as an independent folding unit.
Hierarchical stability and independent units
The NHX data allowed us to identify different isotherms that correspond to the unfolding of co-operative independent units, specifically, the unfolding of individual helices. The Ising model simulations predict that the helices at both ends of the proteins will unfold most readily, and that the helices toward the center will unfold sequentially (with respect to the concentration of denaturant) until the central helix unfolds. The NHX data that we have presented so far shows that individual helices behave as concerted folding units, but does not specify if the different helices unfold unzipping outwards from the middle, or if they unfold as units but in random order. It has been demonstrated for a number of different proteins that the slope of a ΔG versus concentration of denaturant plot, the m-value, is proportional to the amount of surface area that becomes exposed to solvent upon unfolding (the change in solvent-accessible surface area, ΔASA).30,41 The GuHCl-dependent HX experiments, we have performed, allow us to determine the mex values for individual helices in the proteins. We can also calculate the ΔASA that would be associated with either independent unfolding of the helices or with sequential unfolding, in which the helices with lower energy unfold first (see Materials and Methods).
Figure 7 shows plots of the experimentally determined mex-values and the calculated ΔASA, assuming either a random order or sequential unzipping unfolding process. It is clear for both CTPR2 and CTPR3, that the best correlation between the experimentally observed mex values and the calculated ΔASA is for the sequential unzipping from the ends model.
To elaborate, because the independent folding units are comparable to α-helices, for an independent folding model we would expect similar ΔASA and therefore similar mex-values for all the units. However, we observe that the exchange data shows an increase in the mex-value with the increase of the free energy of the partially unfolded species (Fig. 6). This observation is in agreement with a stepwise unfolding, in which the helices closer to the end unfold first and the protein unfolds, sequentially, from both N and C termini toward the center of the protein.
Comparison of the data with the Ising model predictions
The predicted exchange isotherms from the Ising description for each helix for CTPR2 and CTPR3 (Fig. 4) were fit to Eq. (7) (Materials and Methods) in the same manner as the experimental data to calculate the ΔGUNF and mexparameters. Fig. 8 shows the average ΔGUNF and mex-values for each helix calculated from the experimental data (filled circles) and the values obtained from the fits of the Ising-predicted curves (open circles with the same color code). The NHX data show a clear grouping of the exchange behavior of residues within a particular helix; the data also highlight differences between the average exchange behavior of different helices, in a fashion that is consistent with the Ising model-based predictions for HX. Furthermore, the data agree quantitatively with the ΔGUNF and mex-values for the individual helices calculated from the Ising description.
Fig. 8.

Hydrogen exchange thermodynamic parameters measured and predicted by the Ising model for CTPR2 and CTPR3. (a) Experimental average ΔG and mex-values for the helices in CTPR2 in filled symbols: B1 and B2 helices (magenta and red) and A2 helix (green). The ΔG and mex parameters calculated from the fit of the Ising model predicted curves are shown in the same color but with open circles. (b) Data for CTPR3 show the experimental parameters (filled circles) for the B1 and B3 (cyan and blue), A2 and A3 (magenta and red), and B2 (green) helices and the parameters from the Ising model description (open circles with the same color code).
Conclusions
We report the results of extensive HX studies of the folding of two CTPR proteins, which contain different numbers of tandem repeats of an identical 34 amino acid helix-helix motif. HX methods allowed us to detect and characterize partially folded species that are populated at low frequency in the nominally folded state. Both CTPR2 and CTPR3 exhibit non-two state equilibrium folding–unfolding transitions with the outermost helices showing a significantly higher probability of being unfolded than the inner helices. Fig. 9 shows a proposed energy landscape in the absence of Gu–HCl for CTPR3 based on our HX measurements. We show also that the experimentally observed unfolding behavior is consistent with the predictions of a simple Ising model, in which individual helices are treated as “spin-equivalents”. The results we present have general implications for our understanding of the thermodynamic properties of repeat proteins. In addition, it is interesting to both compare and contrast the behavior of repeat proteins with that of globular proteins. Partially unfolded forms have been identified in globular proteins, as distinct units of structure, with distinct stabilities and roles in folding.30,42 However, in globular proteins these units are formed by residues distant in the primary sequence, whereas in repeat proteins the partially unfolded form equivalents are directly contiguous. In the linear sequence, in the case of TPR proteins, they are helices.
Fig. 9.

Proposed model for the equilibrium energy landscape of CTPR3. The free energy (ΔG) of each partially unfolded species in the absence of Gu–HCl is given relative to the native state. The m-value on the x-axis is proportional to the increase in surface area exposed for each partially unfolded form relative to the native structure. The plot shows the experimental data for CTPR3 (open circles), and the data measured from the application of the Ising model (horizontal bars). The continuous line connecting the energy levels is a guide to the eye. The figure also shows a representation of the partially unfolded forms for CTPR3, where each cylinder represents a folded helix and each line represents an unfolded helix.
Materials and Methods
Protein expression and purification
CTPR2 and CTPR3 proteins were expressed as N-terminal histidine-tagged fusion proteins and purified as described.15 The 15N-labeled proteins were expressed in M9 minimal medium supplemented with [15N]ammonium chloride.
Hydrogen exchange data collection
15N labeled 1 mM CTPR protein samples were lyophilized in water and resuspended in an equal volume of buffer in 2H2O (Cambridge Isotope Laboratories, Cambridge, UK) (150 mM NaCl, 50 mM phosphate, pH 6.8) at different concentrations of Gu–HCl (Ultrapure, Fluka, Buchs, Switzerland); 0, 0.25 M, 0.75 M and 1 M for CTPR2, and 0, 0.5 M, 1 M, 1.5 M and 2M for CTPR3. We assumed the correction pD=pH+0.4, to adjust the pH of all the buffer solutions at 6.8. The pH of all the samples was measured after the exchange was completed. 1H–15N heteronuclear single-quantum coherence (HSQC) 2D spectra were acquired immediately after resuspension in a Varian Unity Plus 600 MHz at 25 °C. The spectra were acquired using 32 increments of 2048 datapoints and eight or 16 transients for CTPR2 or CTPR3, respectively. The spectral widths were 7000 Hz in the 1H dimension and 2000 Hz in the 15N dimension. The total acquisition time of each spectrum was 12 min for CTPR2 and 23 min for CTPR3. During the first 5 h spectra were acquired every 12 or 23 min. After the first 5 h, we acquired one scan per hour for 24 h, finally data were collected regularly over the next 1–30 days. HSQC spectra were processed using NMRpipe.431H–15N HSQC spectral assignments of CTPR2 and CTPR3 have been published.4
Hydrogen exchange data analysis
The data were analyzed using the program Sparky†. The proportion of each proton that remained unexchanged with 2H2O at each time-point was determined by calculating the height of the appropriate peak. The amide exchange rates (kex) for the different residues at the different concentrations of Gu–HCl were determined by fitting the data to a first-order exponential decay:
| (4) |
where I is peak intensity, I0 is the peak intensity at time 0, t is the time and Iinf is the residual percentage of amide protons in the final solution after infinite hydrogen/ deuterium exchange times (baseline correction).
To compare the exchange rates at each position for CTPR2 and CTPR3 at different concentrations of Gu–HCl, we calculated the relative protection factors (PF) with the following equation:
| (5) |
where kex is the measured exchange rate and kint= kex (U) is the exchange rate for amino acids in random coil conformation calculated using the program Sphere‡.
Under the mild denaturing conditions of the exchange experiments, we assume that we have stable TPR structures, in which the exchange occurs under EX2 regime (bimolecular exchange) where the closing rate is slower than the intrinsic exchange rate of the random coil state (kcl>>> kint); thus, the exchange rate measured is limited by the population in the open state.21 This assumption seems reasonable because kf (kcl) is ≈20,000–35,000 s−1 (for CTPR2 and CTPR3 in the absence of Gu–HCl, respectively), whereas kint of the slowest exchanging residues is ≈1–10 s−1.4 Under EX2 conditions, the free energy of exchange (ΔGex) can be determined as follows:
| (6) |
The dependence of ΔGex on the concentration of Gu–HCl was fit as a combination of two different processes: the Gu–HCl–independent local fluctuations and the unfolding reactions dependent on Gu–HCl using Eq. (7):
| (7) |
where ΔGLF and ΔGUNF are the free energies of the denaturant-independent local fluctuations and the [Gu–HCl]-dependent unfolding, respectively, and mex is the denaturant dependence of the unfolding (Fig. 5).
Application of the 1D-Ising model to predict protection factors
The calculation of the probability of each helix to be unfolded (pu) within the context of the Ising model was accomplished using the transfer matrix method as follows. Using the normal 1D Ising model transfer matrix, i.e.:
| (8) |
We compute the mean of spin (helix) m of a TPR containing a total of n spins (helices) via:
| (9) |
Then, the probability that a particular helix is folded or unfolded is given by:
| (10) |
| (11) |
Solvent-accessible area calculations
The increment in the surface area exposed upon unfolding (ΔASA) is defined as the difference between the surface area exposed in the denatured state (ASAD) and in the native state (ASAN)
| (12) |
ASAN is calculated from the crystals structures of the CTPR2 and CTPR3 proteins using the program GETAREA§ and ASAD is calculated assuming that unfolded proteins behave as random coils. ASA for each residue X in the tripeptide Gly-X-Gly in an ensemble of 30 random coil conformations is multiplied by the number of occurrences of the residue in the protein sequence and summed. For the partial unfolding events, the ΔASA was also calculated relative to the native state. ASA of the partially unfolded species was determined by the addition of the surface area exposed of the folded part of the protein calculated by GETAREA and the unfolded part of the protein calculated from the values of G-X-G peptides.
Fig. 7.

Correlation curves between mex-values and ΔASA upon unfolding. (a) Correlation curve when ΔASA of unfolding is calculated on the basis of a random-order unfolding model for the individual helices in CTPR2 (filled circles) and CTPR3 (open circles). (b) Correlation curve when the unfolding ΔASA0 is determined on the basis of a sequential unzipping outwards from the middle unfolding model, where the proteins fray from the N and C termini for CTPR2 (filled circles) and CTPR3 (open circles). The lines show the correlation line that goes from the native to the globally unfolded state (determined by the unfolding of the central helix: A2 in CTPR2 and B2 in CTPR3).
Acknowledgements
This work was supported, in part, by the Human Frontier Science Program. We thank Tijana Grove, Meredith Jackrel, Lenka Kundrat, Roberto Valverde and Fang Yi for comments on the manuscript.
Abbreviations used
- TPR
tetratricopeptide repeat
- CTPR
consensus TPR
- HX
hydrogen exchange
- NHX
native state HX
- PF
protection factor
- HSQC
heteronuclear single-quantum coherence
Footnotes
References
- 1.Main E, Lowe A, Mochrie S, Jackson S, Regan L. A recurring theme in protein engineering: the design, stability and folding of repeat proteins. Curr. Opin. Struct. Biol. 2005;15:464–471. doi: 10.1016/j.sbi.2005.07.003. [DOI] [PubMed] [Google Scholar]
- 2.Main ERG, Jackson SE, Regan L. The folding and design of repeat proteins: reaching a consensus. Curr. Opin. Struct. Biol. 2003;13:482–489. doi: 10.1016/s0959-440x(03)00105-2. [DOI] [PubMed] [Google Scholar]
- 3.Andrade MA, Perez-Iratxeta C, Ponting CP. Protein repeats: structures, functions, and evolution. J. Struct. Biol. 2001;134:117–131. doi: 10.1006/jsbi.2001.4392. [DOI] [PubMed] [Google Scholar]
- 4.Main ER, Stott K, SE J, Regan L. Local and long-range stability in tandemly arrayed tetratricopeptide repeats. Proc. Natl Acad. Sci. USA. 2005;102:5721–5726. doi: 10.1073/pnas.0404530102. [DOI] [PMC free article] [PubMed] [Google Scholar]
- 5.Ferreiro DU, Cho SS, Komives EA, Wolynes PG. The energy landscape of modular repeat proteins: topology determines folding mechanism in the ankyrin family. J. Mol. Biol. 2005;354:679–692. doi: 10.1016/j.jmb.2005.09.078. [DOI] [PubMed] [Google Scholar]
- 6.Street TO, Bradley CM, Barrick D. Predicting coupling limits from an experimentally determined energy landscape. Proc. Natl Acad. Sci. USA. 2007;104:4907–4912. doi: 10.1073/pnas.0608756104. [DOI] [PMC free article] [PubMed] [Google Scholar]
- 7.Klossa E, Courtemanchea N, Barrick D. Repeat-protein folding: New insights into origins of cooperativity, stability, and topology. Arch. Biochem. Biophys. 2008;469:83–99. doi: 10.1016/j.abb.2007.08.034. [DOI] [PMC free article] [PubMed] [Google Scholar]
- 8.Mello CC, Barrick D. An experimentally determined protein folding energy landscape. Proc. Natl Acad. Sci. USA. 2004;101:14102–14107. doi: 10.1073/pnas.0403386101. [DOI] [PMC free article] [PubMed] [Google Scholar]
- 9.Kajander T, Cortajarena AL, Main ER, Mochrie SG, Regan L. A new folding paradigm for repeat proteins. J. Am. Chem. Soc. 2005;127:10188–10190. doi: 10.1021/ja0524494. [DOI] [PubMed] [Google Scholar]
- 10.Werbeck ND, Itzhaki LS. Probing a moving target with a plastic unfolding intermediate of an ankyrin-repeat protein. Proc. Natl Acad. Sci. USA. 2007;104:7863–7868. doi: 10.1073/pnas.0610315104. [DOI] [PMC free article] [PubMed] [Google Scholar]
- 11.Ferreiro DU, Komives EA. The plastic landscape of repeat proteins. Proc. Natl Acad. Sci. USA. 2007;104:7735–7736. doi: 10.1073/pnas.0702682104. [DOI] [PMC free article] [PubMed] [Google Scholar]
- 12.Lowe AR, Itzhaki LS. Rational redesign of the folding pathway of a modular protein. Proc. Natl Acad. Sci. USA. 2007;104:2679–2684. doi: 10.1073/pnas.0604653104. [DOI] [PMC free article] [PubMed] [Google Scholar]
- 13.D'Andrea L, Regan L. TPR proteins: the versatile helix. Trends Biochem. Sci. 2003;28:655–662. doi: 10.1016/j.tibs.2003.10.007. [DOI] [PubMed] [Google Scholar]
- 14.Blatch GL, Lassle M. The tetratricopeptide repeat: a structural motif mediating protein-protein interactions. BioEssays. 1999;21:932–939. doi: 10.1002/(SICI)1521-1878(199911)21:11<932::AID-BIES5>3.0.CO;2-N. [DOI] [PubMed] [Google Scholar]
- 15.Main ERG, Xiong Y, Cocco MJ, D'Andrea L, Regan L. Design of stable alpha-helical arrays from an idealized TPR motif. Structure. 2003;11:497–508. doi: 10.1016/s0969-2126(03)00076-5. [DOI] [PubMed] [Google Scholar]
- 16.Kajander T, Cortajarena AL, Mochrie SG, Regan L. Structure and stability of a consensus TPR superhelix. Acta Crystallogr. D. 2007;63:800–811. doi: 10.1107/S0907444907024353. [DOI] [PubMed] [Google Scholar]
- 17.Cheng CY, Jarymowycz VA, Cortajarena AL, Regan L, Stone MJ. Repeat motions and backbone flexibility in designed proteins with different numbers of identical consensus tetratricopeptide repeats. Biochemistry. 2006;45:12175–12183. doi: 10.1021/bi060819a. [DOI] [PubMed] [Google Scholar]
- 18.Englander SW. Protein folding Intermediates and pathways studied by hydrogen exchange. Annu. Rev. Biophys. Biomol. Struct. 2000;29:213–238. doi: 10.1146/annurev.biophys.29.1.213. [DOI] [PubMed] [Google Scholar]
- 19.Bai Y, Englander JJ, Mayne L, Milne JS, Englander SW. Thermodynamic parameters from hydrogen exchange measurements. Methods Enzymol. 1995;259:344–356. doi: 10.1016/0076-6879(95)59051-x. [DOI] [PubMed] [Google Scholar]
- 20.Raschke T, Marqusee S. Hydrogen exchange studies of protein structure. Curr. Opin. Struct. Biol. 1998;9:80–86. doi: 10.1016/s0958-1669(98)80088-8. [DOI] [PubMed] [Google Scholar]
- 21.Krishna M, Hoang L, Lin Y, Englander S. Hydrogen exchange methods to study protein folding. Methods. 2004;34:51–64. doi: 10.1016/j.ymeth.2004.03.005. [DOI] [PubMed] [Google Scholar]
- 22.Chamberlain AK, Handel TM, Marqusee S. Detection of rare partially folded molecules in equilibrium with the native conformation of RNaseH. Nature Struct. Biol. 1996;3:782–787. doi: 10.1038/nsb0996-782. [DOI] [PubMed] [Google Scholar]
- 23.Rohl CA, Baldwin RL. Exchange kinetics of individual amide protons in 15N-labeled helical peptides measured by isotope-edited NMR. Biochemistry. 1994;33:7760–7767. doi: 10.1021/bi00191a003. [DOI] [PubMed] [Google Scholar]
- 24.Huyghues-Despointes BM, Scholtz JM, Baldwin RL. Effect of a single aspartic on helix stability at different positions in a neutral alanine-based peptide. Protein Sci. 1993;2:1604–1611. doi: 10.1002/pro.5560021006. [DOI] [PMC free article] [PubMed] [Google Scholar]
- 25.Zimm BH, Bragg JK. Theory of the phase transition between helix and random coil in polypep-tide chains. J. Chem. Phys. 1959;31:526–535. [Google Scholar]
- 26.Lewis PN, Go N, Go M, Kotelchuck D, Scheraga HA. Helix probability profiles of denatured proteins and their correlation with native structures. Proc. Natl Acad. Sci. USA. 1970;65:810–815. doi: 10.1073/pnas.65.4.810. [DOI] [PMC free article] [PubMed] [Google Scholar]
- 27.Scholtz JM, Qian H, York EJ, Stewart JM, Baldwin RL. Parameters of helix-coil transition theory for alanine-based peptides of varying chain lengths in water. Biopolymers. 1991;31:1463–1470. doi: 10.1002/bip.360311304. [DOI] [PubMed] [Google Scholar]
- 28.Lifson S, Roig A. On the theory of helix-coil transition in polypeptides. J. Chem. Phys. 1961;34:1963–1974. [Google Scholar]
- 29.Li R, Woodward C. The hydrogen exchange core and protein folding. Protein Sci. 1999;8:1571–1590. doi: 10.1110/ps.8.8.1571. [DOI] [PMC free article] [PubMed] [Google Scholar]
- 30.Bai Y, Sosnick TR, Mayne L, Englander SW. Protein folding intermediates:Native-state hydrogen exchange. Science. 1995;269:192–197. doi: 10.1126/science.7618079. [DOI] [PMC free article] [PubMed] [Google Scholar]
- 31.Viguera AR, Serrano L. Hydrogen-exchange stability analysis of Bergerac-Src homology 3 variants allows the characterization of a folding intermediate in equilibrium. Proc. Natl Acad. Sci. USA. 2003;100:5730–5735. doi: 10.1073/pnas.0837456100. [DOI] [PMC free article] [PubMed] [Google Scholar]
- 32.Parker MJ, Marqusee S. A kinetic folding intermediate probed by native state hydrogen exchange. J. Mol. Biol. 2001;305:593–602. doi: 10.1006/jmbi.2000.4314. [DOI] [PubMed] [Google Scholar]
- 33.Cellitti J, Bernstein R, Marqusee S. Exploring subdomain cooperativity in T4 lysozyme II: uncovering the C-terminal subdomain as a hidden intermediate in the kinetic folding pathway. Protein Sci. 2007;16:852–862. doi: 10.1110/ps.062632807. [DOI] [PMC free article] [PubMed] [Google Scholar]
- 34.Feng H, Vu ND, Bai Y. Detection of a hidden folding intermediate of the third domain of PDZ. J. Mol. Biol. 2005;346:345–353. doi: 10.1016/j.jmb.2004.11.040. [DOI] [PubMed] [Google Scholar]
- 35.Croy CH, Bergqvist S, Huxford T, Ghosh G, Komives EA. Biophysical characterization of the free IκBα ankyrin repeat domain in solution. Protein Sci. 2004;13:1767–1777. doi: 10.1110/ps.04731004. [DOI] [PMC free article] [PubMed] [Google Scholar]
- 36.Makhatadze GI, Clore GM, Gronenborn AM. Solvent isotope effect of protein stability. Nature Struct. Biol. 1995;2:852–855. doi: 10.1038/nsb1095-852. [DOI] [PubMed] [Google Scholar]
- 37.Cioni P, Strambini GB. Effect of heavy water on protein flexibility. Biophys. J. 2002;82:3246–3253. doi: 10.1016/S0006-3495(02)75666-X. [DOI] [PMC free article] [PubMed] [Google Scholar]
- 38.Huyghues-Despointe BMP, Scholtz JM, Pace CN. Protein conformational stabilities can be determined from hydrogenexchange rates. Nature Struct. Biol. 1999;6:910–912. doi: 10.1038/13273. [DOI] [PubMed] [Google Scholar]
- 39.Rohl CA, Baldwin RL. Comparison of NH exchange and circular dichroism as techniques for measuring the parameters of the helix-coil transition in peptides. Biochemistry. 1997;36:8435–8442. doi: 10.1021/bi9706677. [DOI] [PubMed] [Google Scholar]
- 40.Wildes D, Anderson LM, Sabogal A, Marqusee S. Native state energetics of the Src SH2 domain: evidence for a partially structured state in the denatured ensemble. Protein Sci. 2006;15:1769–1779. doi: 10.1110/ps.062136006. [DOI] [PMC free article] [PubMed] [Google Scholar]
- 41.Myers JK, Pace CN, Scholtz JM. Denaturant m values and heat capacity changes: relation to changes in accessible surface areas of protein unfolding. Protein Sci. 1995;4:2138–2148. doi: 10.1002/pro.5560041020. [DOI] [PMC free article] [PubMed] [Google Scholar]
- 42.Maity H, Maity M, Krishna MM, Mayne L, Englander WS. Protein folding: the stepwise assembly of foldon units. Proc. Natl Acad. Sci. USA. 2005;102:4741–4746. doi: 10.1073/pnas.0501043102. [DOI] [PMC free article] [PubMed] [Google Scholar]
- 43.Delaglio FGS, Vuister GW, Zhu G, Pfeifer JBA. NMRPipe: a multidimensional spectral processing system based on UNIX pipes. J. Biomol. NMR. 1995;6:277–293. doi: 10.1007/BF00197809. [DOI] [PubMed] [Google Scholar]