Abstract
In this paper, microfluidic devices containing microwells that enabled cell docking were investigated. We theoretically assessed the effect of geometry on recirculation areas and wall shear stress patterns within microwells and studied the relationship between the computational predictions and experimental cell docking. We used microchannels with 150 μm diameter microwells that had either 20 or 80 μm thickness. Flow within 80 μm deep microwells was subject to extensive recirculation areas and low shear stresses (<0.5 mPa) near the well base; whilst these were only presented within a 10 μm peripheral ring in 20 μm thick microwells. We also experimentally demonstrated that cell docking was significantly higher (p<0.01) in 80 μm thick microwells as compared to 20 μm thick microwells. Finally, a computational tool which correlated physical and geometrical parameters of microwells with their fluid dynamic environment was developed and was also experimentally confirmed.
Keywords: Microfluidic device, Computational fluid dynamic, Cell docking, Shear stress
1 Introduction
Microfluidic devices can be useful for controlling the cellular microenvironment in drug screening and cell biology studies (Whitesides et al. 2001; Weibel and Whitesides 2006). These microfluidic systems enable high-throughput experimentation while minimizing costly reagent consumption and reducing sample processing time (Whitesides 2006; Khademhosseini et al. 2006a, b; Sia and Whitesides 2003). Cells could be potentially delivered and docked in microfluidic channels, resulting in better controlled cell patterning and cellular interactions. Several approaches such as encapsulation within photocrosslinkable polymers, adhesion to patterned proteins and protein coatings have been used to obtain cell docking within microfluidic channels (Koh et al. 2002; Khademhosseini et al. 2004; Fidkowski et al. 2005). In addition, microstructures that create low shear stress regions have been used to immobilize cells within fluidic channels (Di Carlo and Lee 2006; Wang et al. 2007; Manbachi et al. 2008; Park et al. 2005; Daxini et al. 2006; Khabiry et al. 2009; Khademhosseini et al. 2005, 2006a, b; Karp et al. 2007). Microchannel surface can be modified with cup-shaped microstructures that enable individual cell capture (Di Carlo and Lee 2006) or with micropatterns for multiple cell entrapments by using sieves (Wang et al. 2007), microgrooves (Manbachi et al. 2008; Park et al. 2005; Daxini et al. 2006; Khabiry et al. 2009), and microwells (Khademhosseini et al. 2005, 2006a, b; Karp et al. 2007). In particular, cell docking in microwells has been used to build multiphenotype cell arrays for drug discovery experiments (Khademhosseini et al. 2005), to control embryonic stem cell undifferentiated expansion when co-cultured with embryonic fibroblasts (Khademhosseini et al. 2006a, b) and to form homogenous embryonic stem cell aggregates to enhance their differentiation for therapeutic applications (Karp et al. 2007).
Ideally, the cell density within microstructure should be controlled not by means of a “trial and error”, but through the optimized design of the microfluidic device, which requires the knowledge of local fluid dynamics (i.e. re-circulation areas, and wall shear stress distribution) within the microchannel system. When microfluidic devices incorporate cell docking sites, the fluid dynamic field cannot be analytically evaluated through Poiseuille models (Gaver and Kute 1998) and requires computational approach. The role of local fluid dynamics on cell positioning was computationally and experimentally investigated in our previous study on microgrooved channels (Manbachi et al. 2008). However computational models should also quantitatively predict cell density within each docking site.
In this paper, we developed an integrated computational and experimental platform for design optimization of microchannel systems containing microwells. The aims of this study are: (i) to computationally assess the effect of microwell geometry on the recirculation areas and wall shear stress patterns at the base of the microwells; (ii) to correlate the computationally predicted shear stress with the experimental cell number per well in different geometrical configurations; and (iii) to develop a computational tool which can aid efficient microdevice optimization and experimental approach. We also studied the quantitative evaluation of the shear stress profile and the presence of recirculation areas on cell docking within the microwells. This study also offers a practical and original instrument to correlate physical and geometrical parameters (i.e. microwell diameter, depth and inlet velocities) with the fluid dynamic environment within microwells, enabling the prediction of cell docking.
2 Materials and methods
2.1 Fabrication of the microfluidic device
The microfluidic device was fabricated by using previous published soft lithography methods (Chung et al. 2005; Khademhosseini et al. 2005). Master molds patterned with 80 μm thickness were made by patterning a negative photoresist (Su-8 2050, Microchem, MA) on a silicon wafer. A negative replica of microchannels in poly(dimethylsiloxane) (PDMS) (Sylgard 184 Silicon elastomer) was fabricated by replica molding. Briefly, PDMS molds were generated by mixing silicone elastomer and curing agent (10:1 ratio). The PDMS prepolymer was poured on the patterned silicon master and cured at 70°C overnight. PDMS molds were then peeled off from the silicon wafer. Cell inlets and outlets were punched by sharp punchers for medium perfusion and cell seeding. Figure 1 shows the schematic design of a microfluidic device. The microfluidic device consisted of two PDMS layers: a top fluidic channel and the bottom microwells (Fig. 1). The top fluidic channel was 80 μm in height, 900 μm in width and 7.5 mm in length. Two different bottom microwell substrates showed cylindrical microwells of 20 or 80 μm in depth and 150 μm in diameter. In each layer, 20 microwells were placed 200 μm far from each other. Top and bottom PDMS layers were aligned and bonded after each surface was treated with oxygen plasma (5 min at 30 W, Harrick Scientific, NY).
Fig. 1.
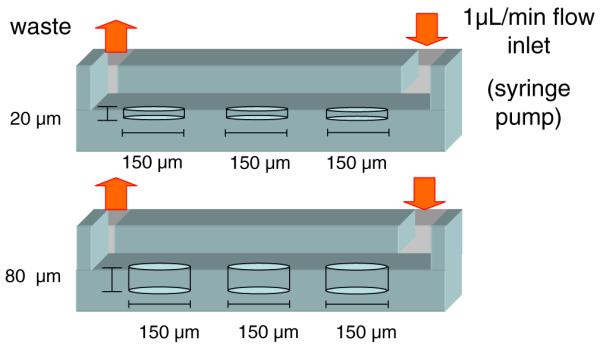
Schematic of the experimental system. Each device consists of two PDMS layers: a top fluidic channel and a bottom microwell surface. Microwells are 150 μm in diameter and 20 or 80 μm in depth. The cell suspension is pumped through the channels at a flow rate of 1 μL/min
2.2 Cell culture and seeding
NIH 3T3 mouse fibroblasts were used to experimentally study cell docking within the microwell channels. Cells were cultured in Dulbecco’s Modified Eagle’s Medium (DMEM) containing 10% Fetal Bovine Serum (FBS). The tissue culture medium and serum were purchased from Gibco Invitrogen Corporation, USA. After trypsinization, cells were seeded into the microfluidic device with culture medium. The cell suspension was seeded through the inlet port at a cell density of 5×10⁶ cells mL−1, which allowed for a successive uniform cell distribution within the microchannel during perfusion. Thereafter medium was infused by using a syringe pump (PHD 2000 Infusion, Harvard Inc, USA) at an average flow rate of 1 μL min−1, which corresponded to a calculated inlet velocity of 2.3× 10⁻⁴ m s−1. Cell adhesion at the inlet port was minimized by starting the flow within 10 min after the seeding.
2.3 Image analysis
Phase contrast images were taken by using an inverted microscope (Nikon TE 2000-U, Nikon Inc., USA). The number of cells distributed in each microwell was calculated from high magnification images. The experiments were performed in triplicate for each flow condition. Statistical analyses were carried out by using the student t-test with p<0.05 considered significant.
2.4 Computational model
Computational fluid dynamics was used to predict the wall shear stress and recirculation areas as a function of microwell geometry and flow rate using COMSOL Multiphysics 3.4 finite-element code (COMSOL AB, Stockholm, Sweden). Each model represented a microchannel, with a section of 900×80 μm. Each model had two cylindrical microwells, positioned 200 μm far from each other and from inlet and outlet boundaries. 20 different models were built corresponding to different microwell depths (d=20, 40, 60 and 80 μm) and diameter (D=50, 100, 150, 200 μm). The culture medium was modeled as an incompressible, homogeneous, Newtonian fluid with density (ρ=1,000 kg m−3) and viscosity (μ=1×10⁻³ Pa s), as in previous studies (Manbachi et al. 2008). The steady state Navier-Stokes equations for incompressible fluids were solved in COMSOL:
where v and p are the velocity vector and pressure. No-slip boundary conditions were applied to the microchannel walls, under the hypothesis of rigid and impermeable walls. A flat velocity profile was applied to the channel inlet, while null total stress was applied to the outlet. Inlet velocities of 0.23, 2.3 and 23×10−4 m s−1 were applied to simulate a flow rate ranging from 0.1 to 1 μL min−1 (Reynolds number: 3.4×10⁻³–3.4×10⁻¹). The meshes presented a number of tetrahedrons up to 225,000, depending on microwell depth and diameter, with a corresponding number of degrees of freedom up to 106. The average element edge was 15 μm, with a minimum element size of 1.5 μm within the microwells to resolve more accurately the shear stress distribution at the wall. The mesh was progressively refined through mesh sensitivity analyses: at each simulation the elements showing high velocity gradients were refined until reaching convergence of sensitive measures of the predicted quantities (error below 5% on shear stress values at the walls). As a result, tetrahedrons, 15 μm on a side, were used in the center of the microchannel, where the velocity gradient was lower, and small tetrahedrons were used close to the walls, where the velocity gradient was higher. Wall shear stresses (τ) were extracted from the simulations for each model and were considered an estimation of the shear stress. Microwell base areas with negative wall shear stress x-component (τx), corresponding to local velocities near the base areas directed counter flow, were computed to quantify micro-recirculation areas.
3 Results
To experimentally visualize cell docking within microwells, we developed PDMS-based microfluidic devices consisting of a fluidic channel and a microwell substrate (Fig. 1). Microdevices including two different well depths (i.e. 20 and 80 μm) were generated and cells were seeded in the microchannels.
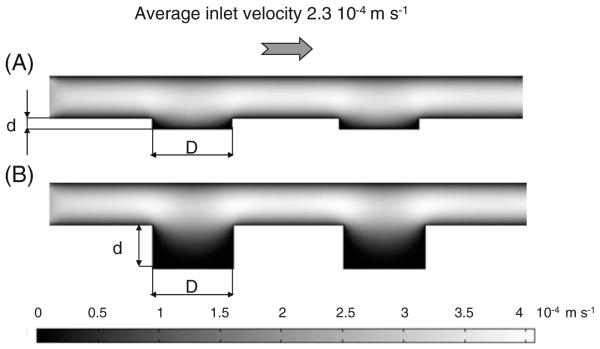
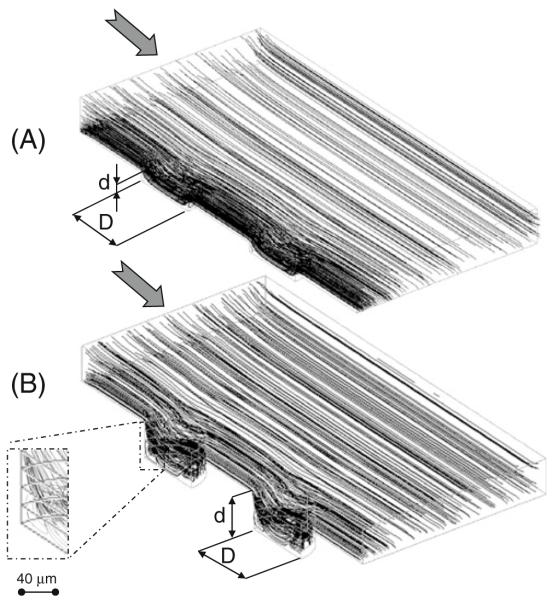
3D simulations were used to predict the effects of a controlled variation of microwell geometry on the fluid-dynamic environment inside the microwells (Figs. 2 and 3). Figure 2 represents velocity contours of the laminar flow within the microdevices for an inlet velocity of 2.3× 10⁻⁴ m s−1. Figure 3 represents streamlines of the laminar flow for an inlet velocity ranging from 0.23 to 23× 10−4 m s−1. Indeed, because of low Reynolds numbers (Re<<1 in all the conditions), streamlines are the same for the considered flows and the other fluid dynamic variables (velocity values and shear stresses) of the CFD study which are linearly related to the imposed inlet velocity. As expected, higher flow penetration was generated in 20 μm deep microwells (Figs. 2(a) and 3(a)) as compared to deeper microwells (80 μm in depth, Figs. 2(b) and 3(b)). In fact, the streamline analysis of velocity profiles predicted the formation of major microcirculation areas in 80 μm deep microwell channels, approximately within a 40 μm peripheral ring of the well bottom (Fig. 3(b)). In these regions, the direction of the local velocity near the base of these wells was opposite to the mainstream fluid flow. In 20 μm deep microwells, small microcirculation areas were presented only in a 10 μm well peripheral ring, whilst the local velocity near the remaining surface of the well had the same direction as the mainstream flow.
Fig. 2.
Velocity contours for channels containing microwells with 150 μm in diameter and 20 μm (a) or 80 μm (b) in depth
Fig. 3.
Streamline patterns for channels containing microwells with 150 μm in diameter and and 20 μm (a) or 80 μm (b) in depth. Deeper microwells show major recirculation areas (see detail)
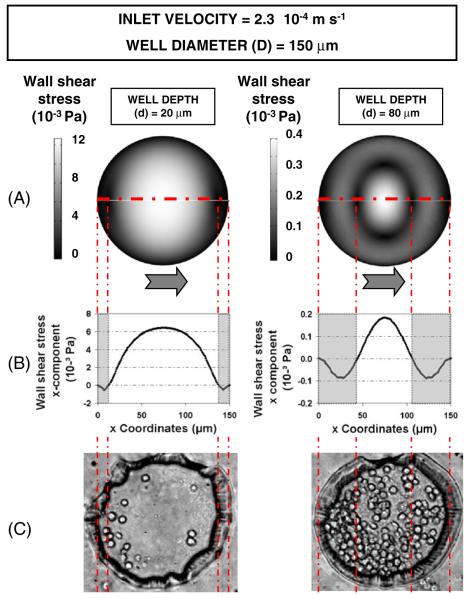
In addition to velocity profiles, we also calculated the resulting shear stresses within the microwells. Figure 4(a) represents wall shear stress contours at the base of the wells, showing average shear stresses τ of 0.2 mPa and 3.4 mPa in microwells 80 and 20 μm in depth respectively. As expected, these values were far lower than the wall shear stresses experienced outside the wells (~20 mPa). In Fig. 4(b) we considered the x-component of the wall shear stresses along the dash-dotted line (τx), which lies in the symmetry plane of the model. It shows that the inversion of the local velocity near the well periphery results in the inversion of the shear stress profile from positive to negative values. In the same areas, recirculation of the flow occurs, as shown in Fig. 2, and cells were most likely to be docked (Fig. 4(c)).
Fig. 4.
Computationally predicted wall shear stresses, recirculation areas, and experimental cell docking on the base of microwells 150 μm in diameter and 20 (left panel) and 80 μm (right panel) in depth. The inlet flow velocity is 2.3×10⁻⁴ m s−1. Grey arrows represent flow direction. (a) Wall shear stress contours at the microwell base. (b) Wall shear stress profile along the dashed line. Grey zones represent the recirculation areas. (c) Phase contrast images of fibroblasts docked within the microwells
Table 1 shows the results in terms of average of the x-component of the wall shear stresses along the dotted line depicted in Fig. 4, and the recirculation area evaluated for different well diameters (50, 100, 150, and 200 μm) combined with different well diameter/depth ratios (1.88, 2.50, 3.75, 5.00, 6.25 and 7.50). Results refer to an inlet velocity of 2.3×10⁻⁴ m s−1. The results of the simulations show that the increase of well diameter, for a given well diameter/depth ratio, leads to a decrease of the percentage of recirculation area, which well correlates to an increase in the wall shear stress. It must be highlighted that the recirculation area at the base of microwells with specific combinations of small diameters (50 and 100 μm) and high depths (i.e. low diameter/depth ratios as 1.88 and 2.50) resulted in being 100%. As a result in these conditions, the shear stresses near the whole base are directed counter flow with respect to the mainstream.
Table 1.
Average of the x-component of the wall shear stresses along the dashed line depicted in Fig. 4 and recirculation area, evaluated for different well diameters (50, 100, 150 and 200 μm) combined with different well diameter/depth ratios (1.88, 2.50, 3.75, 5.00, 6.25 and 7.50)
| Well diameter (μm) |
Well depth (μm) |
Well diameter/depth ratio (μm) |
Average wall shear stress (x-component, mPa) |
% recirculation area |
|---|---|---|---|---|
| 50 | 27 | 1.88 | −0.44 | 100% |
| 100 | 53 | 1.88 | −0.19 | 100% |
| 150 | 80 | 1.88 | 0.02 | 77% |
| 200 | 107 | 1.88 | 0.16 | 39% |
| 50 | 20 | 2.50 | −0.33 | 100% |
| 100 | 40 | 2.50 | 0.08 | 73% |
| 150 | 60 | 2.50 | 0.39 | 37% |
| 200 | 80 | 2.50 | 0.58 | 15% |
| 50 | 13 | 3.75 | 0.42 | 57% |
| 100 | 27 | 3.75 | 0.98 | 26% |
| 150 | 40 | 3.75 | 1.40 | 14% |
| 200 | 53 | 3.75 | 1.58 | 10% |
| 50 | 10 | 5.00 | 1.36 | 29% |
| 100 | 20 | 5.00 | 1.89 | 16% |
| 150 | 30 | 5.00 | 2.50 | 11% |
| 200 | 40 | 5.00 | 2.53 | 8% |
| 50 | 8 | 6.25 | 2.19 | 19% |
| 100 | 16 | 6.25 | 2.76 | 12% |
| 150 | 24 | 6.25 | 3.09 | 9% |
| 200 | 32 | 6.25 | 3.18 | 8% |
| 50 | 7 | 7.50 | 2.87 | 12% |
| 100 | 13 | 7.50 | 3.43 | 9% |
| 150 | 20 | 7.50 | 3.71 | 8% |
| 200 | 27 | 7.50 | 3.78 | 7% |
Results refer to an inlet velocity of 2.3×10⁻⁴ m s−1
Figure 5(a) and (b) show the cell distribution in microwells with 150 μm in diameter as well as 20 μm and 80 μm in depth. A significantly higher number (p<0.01) of the cells was docked in each 80 μm microwell (64±17 cells), as compared to each 20 μm microwell (21±7 cells) (Fig. 5(c)).
Fig. 5.
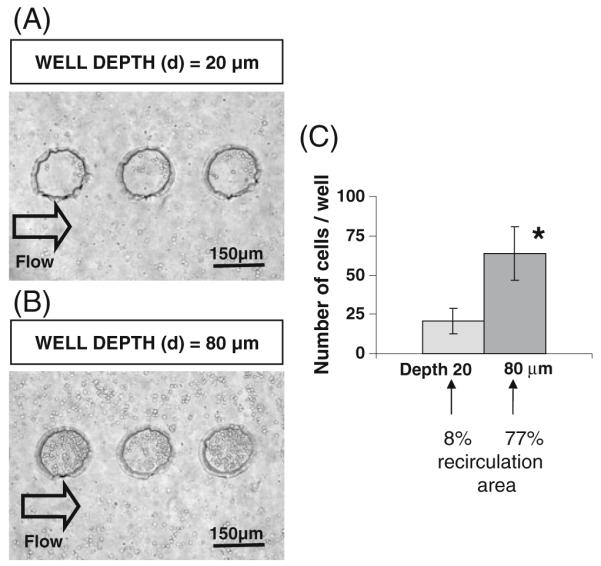
Fibroblast cells docked within microwells inside microfluidic devices. (a) Phase contrast image of cells in microwells with 150 μm in diameter and 20 μm in depth. (b) Phase contrast image of cells in microwells with 150 μm in diameter and 80 μm in depth. (c) Quantitative analysis of cell numbers docked inside microwells. Cell docking was significantly higher (p<0.01) in 80 μm thick microwells as compared to 20 μm thick microwells
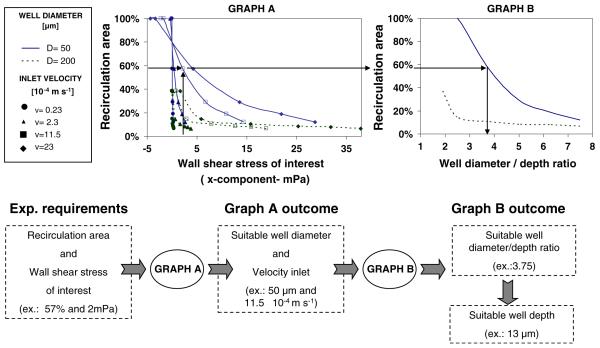
Figure 6 represents the developed computational tool (Graphs A and B) for design optimization of microwells and experimental approach. Graph A shows the trend of % recirculation area at the microwell base versus the wall shear stress of interest (i.e. the average of the x-component of the shear stress along the symmetry line of the microwell base, depicted in Fig. 4). In this Graph, the fluid dynamic behavior of several configuration geometries could be included: for the sake of clarity, the reported data refers to microwells 50 and 200 μm in diameter for different depths and different inlet velocities. Graph B shows the trend of the percentage of recirculation area versus the diameter/depth ratio for the same geometry configurations. These graphs refer to microchannels 80 μm in height, 900 μm in width.
Fig. 6.
The proposed computational tool for design optimization of microfluidic devices and experimental planning. Graph A shows the trend of % recirculation area at the microwell base versus the wall shear stress of interest (i.e. the average of the x-component of the shear stress along the symmetry line of the microwell base, depicted in Fig. 4). Graph B shows the trend of % recirculation area versus the diameter/depth ratio for the same geometry configurations. These graphs refer to microchannels with 80 μm in height, 900 μm in width. The lower panel shows the schematic of the possible procedure in which the presented tool aids in experimental planning
When designing a microwell system (Fig. 6, lower panel), researchers should decide a specific combination of shear stress and percentage of recirculation area (i.e. 57% and 2 mPa). Entering Graph A with these values, they can find suitable combinations of microwell diameters and inlet velocities (i.e. 50 μm and 11.5×10⁻⁴ m s−1). Entering Graph B with the chosen level of the percentage of recirculation area, they can identify the required diameter/well ratio (i.e. 3.75). If they select 50 μm diameter wells, the resulting well depth will be 13 μm.
4 Discussion
This study provides a computational and experimental platform for the study of fluid flow properties on cell docking within microfluidic channels containing microwells. Computational fluid dynamic modeling was used to predict the effect of local fluid dynamics (shear stress distribution and recirculation areas) on cell docking within a microfluidic device. In particular, this work shows agreement between experimental cell docking and computationally predicted flow recirculation areas. For instance, 80 μm deep wells resulted in the formation of major microcirculation areas, which induced a counter flow shear stress in most of the well base, which helped cell docking. In 20 μm deep wells, there was higher penetration of the mainstream flow and small microcirculation areas were presented only near the well periphery, where a few cells were attached (Fig. 4).
To date, only a few computational studies have been published on cell docking within microstructures. One interesting approach is to simulate cell loading process, assuming cells to be solid spheres, which are dragged by the fluid flow but do not interfere with it (one-way coupled Lagrangian approach). This methodology allowed for optimizing the geometry of cell-trapping sieves in a microfluidic device (Wang et al. 2007). However, it was reported that the simulations were particularly time consuming. Moreover, mostly likely it was difficult to realistically simulate the interaction between cells and the microchannel surface, which may have induced the reported difference in theoretical and experimental cell distribution. An alternative approach is to avoid cell modelling and to evaluate the fluid dynamic field induced by cell-free culture medium perfusion. In this case, most of recent studies (Daxini et al. 2006; Park et al. 2005; Korin et al. 2009; Manbachi et al. 2008; Khabiry et al. 2009; Green et al. 2009) considered the wall shear stresses computed at the microdevice surfaces as an index of the shear stresses applied to cells when docked in this region.
In some of these studies (Daxini et al. 2006; Park et al. 2005; Korin et al. 2009), computationally predicted wall shear stresses in microgrooves within microchannels have been correlated with experimental cell retention. Korin and colleagues (2009) studied fluid flow and cell retention in microwelled channels. However, the computational models refer only to 100×100 μm squared microwells. Experimentally in their work, as well as in the previously mentioned ones, after cell seeding within the microdevices, cells were statically incubated to allow for proper cell adhesion. Thereafter cells were exposed to different fluid flow velocities and different shear stresses. This methodology enabled the evaluation of the effect of the shear stress on cell detachment. We employed a different approach whereby cells were not allowed to attach prior to exposure to fluid-induced shear stress. As compared to the previous works, our method acts on the cell distribution before cell attachment, enabling to analyze and predict the number of cells within each microstructure. In our opinion, this approach offers a higher degree of control over cell patterning and distribution in microdevices with microtopographical features.
As shown in our previous work (Manbachi et al. 2008), recirculation areas seem to correlate with cell localization in microdevices which provide shear stress protected regions. In the present work, recirculation areas are more related with the quantity of docked cells than with their topographic distribution, probably due to the different adopted geometry.
Cell bioreactors in a microchannel have already been extensively investigated both experimentally and theoretically to properly design and optimize microfluidic systems (Mehta and Linderman 2006); however most works focus on planar microchannel systems. Based on the presented experimental and computational data provided, in this paper we propose a novel computational tool to correlate physical and geometrical parameters (i.e. microwell diameter, depth, and inlet velocity) of a microwell system with the fluid dynamic environment within microwells, enabling cell docking prediction. Our results suggest that high recirculation areas and low shear stresses increase cell docking within the microwells. In our study a preliminary validation of this hypothesis has been carried out through the comparison between experimental cell docking and computational fluid dynamic parameters. Our future efforts will be addressed on obtaining experimental data for all the computationally investigated configurations. This will potentially increase the significance of our instrument, which may be easily used by researchers for the design of microfluidic devices and experimental planning.
Acknowledgments
M.C. and M.M. were supported by the Progetto Roberto Rocca Collaboration. The Khademhosseini group is funded by the US Army Engineer Research and Development Center, the Institute for Soldier Nanotechnology, the National Science Foundation and the National Institute of Health grants (HL092836, EB009196 and DE019024). B. G. Chung was partially supported by the National Research Foundation of Korea (Grant Number R11-2008-044-01001-0) and Korea Industrial Technology Foundation (KOTEF) through the Human Resource Training Project for Strategic Technology. The authors thank Professor Marjo Yliperttulaa and Professor Edward Hæggström for helpful discussion.
Footnotes
Margherita Cioffi and Matteo Moretti contributed equally.
Contributor Information
Margherita Cioffi, Laboratory of Biological Structure Mechanics, Department of Structural Engineering, Politecnico di Milano, Milan, Italy; IRCCS Istituto Ortopedico Galeazzi, Milan, Italy.
Matteo Moretti, IRCCS Istituto Ortopedico Galeazzi, Milan, Italy.
Amir Manbachi, Center for Biomedical Engineering, Brigham and Women’s Hospital, Harvard Medical School, Cambridge, MA 02139, USA; Institute of Biomaterials and Biomedical Engineering (IBBME), University of Toronto, Toronto, ON, Canada.
Bong Geun Chung, Center for Biomedical Engineering, Brigham and Women’s Hospital, Harvard Medical School, Cambridge, MA 02139, USA; Department of Bionano Engineering, Hanyang University, Ansan 426-791, Korea; Harvard-MIT Division of Health Sciences and Technology, Massachusetts Institute of Technology, Cambridge, MA 02139, USA.
Ali Khademhosseini, Center for Biomedical Engineering, Brigham and Women’s Hospital, Harvard Medical School, Cambridge, MA 02139, USA; Harvard-MIT Division of Health Sciences and Technology, Massachusetts Institute of Technology, Cambridge, MA 02139, USA.
Gabriele Dubini, Laboratory of Biological Structure Mechanics, Department of Structural Engineering, Politecnico di Milano, Milan, Italy.
References
- Chung BG, Flanagan LA, Rhee SW, Schwartz PH, Lee AP, Monuki ES, Jeon NL. Lab Chip. 2005;5:401. doi: 10.1039/b417651k. [DOI] [PubMed] [Google Scholar]
- Daxini SC, Nichol JW, Sieminski AL, Smith G, Gooch KJ, Shastri VP. Biorheology. 2006;43(1):45. [PubMed] [Google Scholar]
- Di Carlo D, Lee LP. Anal. Chem. 2006;78:7918. doi: 10.1021/ac069490p. [DOI] [PubMed] [Google Scholar]
- Fidkowski C, Kaazempur-Mofrad MR, Borenstein J, Vacanti JP, Langer R, Wang Y. Tissue Eng. 2005;11:302. doi: 10.1089/ten.2005.11.302. [DOI] [PubMed] [Google Scholar]
- Gaver DP, 3rd, Kute SM. Biophys. J. 1998;75:721. doi: 10.1016/S0006-3495(98)77562-9. [DOI] [PMC free article] [PubMed] [Google Scholar]
- Green JV, Kniazeva T, Abedi M, Sokhey DS, Taslim ME, Murthy SK. Lab Chip. 2009;9(5):677. doi: 10.1039/b813516a. [DOI] [PubMed] [Google Scholar]
- Karp JM, Yeh J, Eng G, et al. Lab Chip. 2007;7(6):786. doi: 10.1039/b705085m. [DOI] [PubMed] [Google Scholar]
- Khabiry M, Chung BG, Hancock MJ, Soundararajan HC, Du Y, Cropek D, Lee WG, Khademhosseini A. Small. 2009;5(10):1186–1194. doi: 10.1002/smll.200801644. [DOI] [PMC free article] [PubMed] [Google Scholar]
- Khademhosseini A, Suh KY, Jon S, Chen G, Eng G, Yeh J, Langer R. Anal. Chem. 2004;76:3675. doi: 10.1021/ac035415s. [DOI] [PubMed] [Google Scholar]
- Khademhosseini A, Yeh J, Eng G, et al. Lab Chip. 2005;5(12):1380. doi: 10.1039/b508096g. [DOI] [PubMed] [Google Scholar]
- Khademhosseini A, Ferreira L, Blumling J, 3rd, et al. Biomaterials. 2006a;27(36):5968. doi: 10.1016/j.biomaterials.2006.06.035. [DOI] [PubMed] [Google Scholar]
- Khademhosseini A, Langer R, Borenstein J, et al. Proc. Natl. Acad. Sci. U. S. A. 2006b;103(8):2480. doi: 10.1073/pnas.0507681102. [DOI] [PMC free article] [PubMed] [Google Scholar]
- Koh WG, Revzin A, Pishko MV. Langmuir. 2002;18:2459. doi: 10.1021/la0115740. [DOI] [PubMed] [Google Scholar]
- Korin N, Bransky A, Khoury M, Dinnar U, Levenberg S. Biotechnol. Bioeng. 2009;102(4):1222. doi: 10.1002/bit.22153. [DOI] [PubMed] [Google Scholar]
- Manbachi A, Shrivastava S, Cioffi M, Chung BG, Moretti M, Demirci U, Yliperttula M, Khademhosseini A. Lab Chip. 2008;8(5):747. doi: 10.1039/b718212k. [DOI] [PMC free article] [PubMed] [Google Scholar]
- Mehta K, Linderman JJ. Biotechnol. Bioeng. 2006;94(3):596. doi: 10.1002/bit.20857. [DOI] [PubMed] [Google Scholar]
- Park J, Berthiaume F, Toner M, Yarmush ML, Tilles AW. Biotechnol. Bioeng. 2005;90(5):632. doi: 10.1002/bit.20463. [DOI] [PubMed] [Google Scholar]
- Sia SK, Whitesides GM. Electrophoresis. 2003;24(21):3563. doi: 10.1002/elps.200305584. [DOI] [PubMed] [Google Scholar]
- Wang Z, Kim MC, Marquez M, Thorsen T. Lab Chip. 2007;7(6):740. doi: 10.1039/b618734j. [DOI] [PubMed] [Google Scholar]
- Weibel DB, Whitesides GM. Curr. Opin. Chem. Biol. 2006;10(6):584. doi: 10.1016/j.cbpa.2006.10.016. [DOI] [PubMed] [Google Scholar]
- Whitesides GM. Nature. 2006;442(7101):368. doi: 10.1038/nature05058. [DOI] [PubMed] [Google Scholar]
- Whitesides GM, Ostuni E, Takayama S, et al. Annu. Rev. Biomed. Eng. 2001;3:335. doi: 10.1146/annurev.bioeng.3.1.335. [DOI] [PubMed] [Google Scholar]


