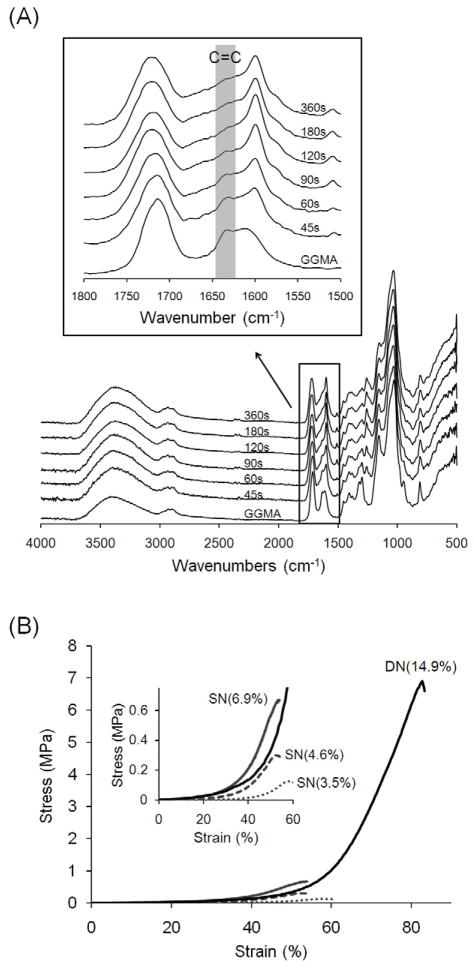
Fig. 3.
(A) FTIR spectra of GGMA and dried GGMA hydrogels crosslinked for varying time. The shoulder peak appearing around 1640cm−1 corresponds to the unreacted C=C bonds. (B) Stress-strain curves of GGMA/GelMA SN and DN hydrogels with the same mass ratio (GelMA/GGMA = 8.2). Every crosslinking time was 120 seconds, and GelMA (DM: 32.3%) was used. The number in parenthesis refers to the polymer content of the hydrogels.

