

Abstract
ATP-gated ionotropic P2X2 receptors are widely expressed in neurons. Although the electrophysiological properties of P2X2 receptors have been extensively studied, little is known about the plasma membrane lateral mobility of P2X2 receptors or whether receptor mobility is regulated by ATP. Here we used single-molecule imaging with simultaneous whole-cell voltage-clamp recordings to track quantum dot-labeled P2X2 receptors in the dendrites of rat hippocampal neurons to explore P2X2 receptor mobility and its regulation. We find that plasma membrane P2X2 receptor lateral mobility in dendrites is heterogeneous but mostly Brownian in nature, consisting of mobile and slowly mobile receptor pools. Moreover, lateral mobility is P2X2 subunit and cell specific, is increased in an activation-dependent manner, and is regulated by cytosolic VILIP1, a calcium binding protein. Our data provide the first direct measures of P2X receptor mobility and show that P2X2 receptors are mobile ATP sensors, sampling more of the dendritic plasma membrane in response to ATP.
Introduction
Ionotropic P2X, glutamate, and cys-loop receptors comprise the three major classes of neurotransmitter-gated ion channels in mammals (Surprenant et al., 1995; Green et al., 1998; Khakh, 2001). As a family, ATP-gated P2X receptors are widely expressed in the brain in which they modulate and, in some cases, mediate fast synaptic transmission and facilitate synaptic plasticity (Surprenant and North, 2009). In addition, P2X receptors regulate other types of neuronal neurotransmitter-gated channels, particularly GABAA and nicotinic receptors (Nakazawa, 1994; Barajas-López et al., 1998; Searl et al., 1998; Zhou and Galligan, 1998; Khakh et al., 2000; Boué-Grabot et al., 2004a,b; Khakh et al., 2005; Decker and Galligan, 2009, 2010; Jo et al., 2011; Shrivastava et al., 2011). However, the properties and regulation of neuronal P2X receptors have not yet been fully explored.
P2X2 receptors are one subtype of the seven known homomeric P2X receptors, and, together with P2X4 and P2X6 receptor subunits, they represent the predominant P2X receptor subtypes expressed in brain neurons (Kidd et al., 1995; Collo et al., 1996; Kanjhan et al., 1999; North, 2002; Burnstock and Kennedy, 2011). In the periphery, P2X2 receptors mediate fast synaptic transmission in the myenteric plexus (Galligan and Bertrand, 1994; Khakh et al., 2000; Ren et al., 2003; Ren and Galligan, 2005) and possibly in celiac neurons (Evans et al., 1992), raising the possibility that they may serve similar roles in the brain. However, electron microscopy studies show that P2X2 receptors localize to the periphery of glutamatergic synapses on CA1 pyramidal neurons (Rubio and Soto, 2001; Masin et al., 2006), and a clear fast ATP synaptic current mediated by P2X2 receptors has not yet been reported. P2X2 receptors are also expressed on the axons and nerve terminals of neurons (Vulchanova et al., 1996) in which their activation facilitates excitatory neurotransmitter release (Khakh et al., 2003; Vavra et al., 2011). In addition, P2X2 subunits contain a motif that is required for axodendritic expression (Chaumont et al., 2004). Thus, these past studies suggest that dendrites and axons are important sites for P2X2 receptor function despite the fact they have not been found to be active in synapses.
Regulation of receptor lateral mobility in the plasma membrane is a recently discovered cell-surface trafficking mechanism with roles in calcium-dependent regulation of synaptic strength (Triller and Choquet, 2008). Recent quantum dot (Qd)-based single-molecule imaging and single-particle tracking (SPT) studies have shed light on the regulation of several neurotransmitter receptors (Triller and Choquet, 2008), including FLAG-tagged P2X2 receptors in spinal cord neurons (Shrivastava et al., 2011). Thus, neurotransmitter receptors are known to display different types of lateral mobility in the plasma membrane with proposed and demonstrated signaling roles (Triller and Choquet, 2008). P2X2 receptors are known to not undergo endocytosis on the tens of seconds timescale (Bobanovic et al., 2002; Chaumont et al., 2004), but despite their widespread neuronal expression, little is known about the lateral mobility of plasma membrane P2X2 receptors in neuronal dendrites or whether this process is regulated. Indeed, little is known about the lateral mobility of most P2X receptors. In the present study, we sought to address these issues.
Materials and Methods
Molecular biology.
P2X2FLAG–yellow fluorescent protein (YFP) was generated by merging a published P2X2 receptor carrying a FLAG tag between Asp78 and Lys79 (P2X2FLAG) (Chaumont et al., 2004) that was previously made in the laboratory by Dr. S. Chaumont (University of California, Los Angeles, CA) with a previously published P2X2–YFP receptor (Fisher et al., 2004). A 1226 bp portion of P2X2–YFP containing the YFP protein was removed from the P2X2–YFP plasmid using ClaI and XbaI restriction sites and cloned into P2X2FLAG, which was opened at the same sites. A stop codon in the vector sequence of P2X2FLAG was used to terminate the fusion protein. The result was a FLAG-tagged P2X2 protein with a C-terminal YFP protein and an additional 90 bp of vector DNA at the end of the YFP protein for a total DNA length of 2259 bp for P2X2FLAG–YFP. P2X4HA–YFP was similarly made by Dr. E. Toulmé (University of California, Los Angeles, CA) by overlapping PCR following past detailed characterization work by others using a different epitope tag (Bobanovic et al., 2002). cDNAs were propagated in DH5α Escherichia coli, and plasmids were purified using standard techniques. All constructs were verified by sequencing. P2X2–YFP receptors were available from our past work and C-terminal YFP/green fluorescent protein (GFP)/cyan fluorescent protein (CFP) tags have been extensively characterized in P2X2 receptors (Khakh et al., 2001a; Bobanovic et al., 2002; Fisher et al., 2004; Young et al., 2008). VILIP1–CFP was available from previous work (Chaumont et al., 2008).
HEK-293 cell culture and transfection.
HEK-293 cells (ATCC) were maintained in 75 cm2 cell culture flasks in DMEM/F-12 media with Glutamax (Invitrogen) supplemented with 10% fetal bovine serum and 1% penicillin/streptomycin. Cells were prepared for transfection by plating onto six-well plates at the time of splitting, 3–4 d before transfection. They were transfected at ∼60% confluence. For transient expression in HEK-293, we used ∼0.5 μg of plasmid and the Effectene transfection reagent (Qiagen). When appropriate, 100 ng of YFP was used as a marker of transfected cells. The instructions of the manufacturer (Qiagen) were followed. Cells were gently dispersed and plated on poly-d-lysine-coated glass coverslips (12 mm diameter).
Hippocampal neuron culture and transfection.
Detailed methods for preparation of hippocampal neurons have been described previously (Shigetomi and Khakh, 2009). Briefly, two rat pups of either sex at postnatal day 1 were used for hippocampal cultures. Rat heads were removed, and hippocampi were dissected in Petri dishes filled with ice-cold dissection medium. The dissected hippocampi (in medium, on ice) were cut into four to five pieces, transferred to a 15 ml tube with 10 U/ml papain PAP2 powder (PAPAIN-022; Worthington Biochemical), and incubated for 11–12 min at 37°C. When the pieces of tissue had settled, digestion solution was removed and 5 ml of warm culture medium was added. This step was repeated, and the pieces were triturated five to six times in a 2 ml volume of warm culture medium with paired flame-polished pipettes of progressively smaller bores. A hemacytometer was used to quantify yield (typically 2.5 million/ml), and ∼400,000 neurons were used for plating onto each coverslip. The coverslips were precoated with poly-d-lysine (50 μg/ml; Sigma) and then overnight with 400 μl of 20 μg/ml laminin (Sigma). Three hours after plating, the cells were fed with 2 ml of prewarmed culture medium and fed again 1 d after plating by substituting 1 ml of fresh prewarmed medium for 1 ml of existing medium. Cells were then fed every 4–5 d and used for experiments between 6 and 10 d in vitro. The culture medium comprised MEM with no phenol red (Invitrogen), glucose (20 mm), penicillin/streptomycin (1%; Invitrogen), Na pyruvate (2 mm; Sigma), HEPES (25 mm; Sigma), N2 supplement (1:100 dilution; Invitrogen), and heat-inactivated horse serum (10%; Invitrogen). Cells were transfected with 0.5–2.0 μg of the appropriate cDNA per well of a six-well plate using Lipofectamine 2000 (Invitrogen) transfection reagent as per the instructions of the manufacturer. Transfection efficiency was typically ∼1%, and experiments were performed 2–3 d after transfection.
Whole-cell voltage-clamp electrophysiology.
HEK-293 cell extracellular recording solution contained the following (in mm): 147 NaCl, 2 KCl, 1 MgCl2, 1 CaCl2, 10 HEPES, and 10 glucose, pH 7.4. The pipette solution contained the following (in mm): 154 KCl (or CsCl or NaCl), 11 EGTA, and 10 HEPES. Hippocampal neuron extracellular recording solution was composed of the following (in mm): 110 NaCl, 5.4 KCl, 1.8 CaCl2, 0.8 MgCl2, 10 HEPES, and 10 d-glucose (250 mOsm). The pipette solution was composed of the following (in mm): 100 potassium gluconate, 1.1 EGTA, 10 HEPES, 3 ATP (Mg2+ salt), 3 creatine phosphate, 0.3 GTP, 0.1 CaCl2, and 5 MgCl2 (220 mOsm). Whole-cell voltage-clamp recordings were made with 3–5 MΩ borosilicate glass electrodes (World Precision Instruments), with an Axopatch 200B or 700A amplifier controlled by a computer running pClamp 8.1 software via a Digidata 1322A interface (Molecular Devices). Data were filtered at 2 kHz and digitized at >5 kHz. The chamber housing the glass coverslip was perfused with extracellular buffer at a rate of 2–3 ml/min. The cells were continually perfused: drugs were applied using a fast solution switcher (VC-77SP Fast-Step Perfusion System; Warner Instruments).
Intracellular calcium ion imaging.
Neurons were loaded with 2.5 μm fura-2AM (Invitrogen) in the presence of pluronic acid (0.05%) in the extracellular buffer for 15 min and then transferred to a dye-free buffer for 15 min before experimentation to allow cleavage of the AM ester group. For the “zero” extracellular Ca2+ experiments, before the experimentation, cells were incubated for 2 min in a bath solution containing no added calcium and supplemented with 5 mm EGTA. The cells were viewed with a 40× oil-immersion objective lens with a numerical aperture (NA) of 0.8 (Olympus). The filters for fura-2-based imaging were from Glen Spectra.
Labeling and imaging of neurons.
Hippocampal neurons or HEK-293 cells transfected with P2X2FLAG–YFP were probed with a biotinylated anti-FLAG antibody (anti-FLAG BioM2; Sigma) at a dilution of 1:1000 (anti-FLAG) for 1 h at room temperature, followed by streptavidin Alexa Fluor 555 (Invitrogen) for 30 min at room temperature. We used Qds to study P2X2 receptor mobility. Neurons were used 24–72 h after transfection with P2X2FLAG–YFP plasmids. Epifluorescence was captured using an Olympus IX71 microscope with a 60×, 1.45 NA Olympus objective lens and an EMCCD camera used with an EM gain of 131 and binning of 2 (Ixon DV885JCS-VP; Andor). Excitation was provided by a Polychrome V monochromater (T.I.L.L. Photonics). Appropriate filters (Chroma Technology) were chosen for YFP and Qds emitting 655 nm light. Imaging media used for all experiments was the same as the electrophysiology recording media. The cells were continually perfused: ATP (Sigma) was applied using a fast solution switcher (VC-77SP Fast-Step Perfusion System; Warner Instruments). Ca2+-free solutions were applied 2 min before and during the ATP application. Labeling of P2X4HA–YFP and P2X2FLAG–YFP receptors with Qds was performed using mouse biotinylated anti-HA antibodies (Santa Cruz Biotechnology) and mouse biotinylated anti-FLAG antibodies (Invitrogen), respectively, followed by streptavidin-conjugated Qd 655 (Invitrogen). Labeling was performed at room temperature in 1 ml solution. Incubation of primary antibody (1 μg/ml) was for 15 min, and Qd incubation (final concentration, 5 pm) was for 1 min (in recording media).
P2X2FLAG–YFP receptors in relation to excitatory synapses.
For these experiments, neurons were cotransfected with 1 μg of P2X2FLAG–YFP and 0.5 μg of Homer–Discosoma red (DsRed) (obtained from Daniel Choquet, CNRS, Bordeaux, France) as a marker of excitatory synapses (Petrini et al., 2009). To image total P2X2FLAG–YFP receptors in relation to synapses, neurons cotransfected with P2X2FLAG–YFP and Homer–DsRed were imaged with confocal microscopy. To image surface P2X2FLAG–YFP in relation to Homer–DsRed, cells cotransfected with P2X2FLAG and Homer–DsRed were labeled for 15 min with biotinylated anti-FLAG antibody (1:1000) followed by 30 min with streptavidin–Alexa Fluor 488 (1:500). The cells were then imaged with confocal microscopy. In experiments assessing P2X2FLAG–YFP receptor mobility in relation to Homer–DsRed, the receptors were labeled with Qds as described above. Qd mobility was imaged over 30 s and used for trajectory analysis as described in the data analysis section.
Fluorescence recovery after photobleaching.
Fluorescence recovery after photobleaching (FRAP) and confocal microscopy were performed using an Olympus BX61WI and FV300 Fluoview laser scanning confocal microscope using a 488 nm argon laser, a 40× objective lens with an NA of 0.8, and Fluoview software. Bleaching was achieved in a 2 μm2 area with maximal laser power for ∼1 s, followed by examination of recovery over 30 s at three frames per second (with the laser power at 0.1% of maximum).
Single-particle tracking and data analysis.
For analysis of Qd-labeled receptor mobility, images were acquired at 50 ms exposures every 100 ms for a duration up to 70 s. Trajectories of receptor mobility were generated using single-particle tracking methods implemented into a standalone analysis package (AsteriX), as described recently (Pinaud et al., 2009; Michalet, 2010). The software allows for fitting of individual point spread functions (PSFs) with a two-dimensional Gaussian profile within selected regions of interest (ROIs). An automatic fitting process repeats this frame after frame, centering on the ROI of the previously fitted PSF position. The quality of the fit can be checked manually on a frame-by-frame basis. Single Qds were identified by their fluorescence blinking. Because of random blinking events, the trajectory of an individual receptor could not always be tracked continuously. During Qd blinking periods, no fit was attempted. The center of each fitted position was then connected by straight lines to represent the Qd trajectory. For each fitted PSF, the integrated intensity within a selectable numbers of pixels centered on the PSF (usually 3 × 3 pixels) was represented as an intensity time trace, allowing the visualization of “on” and “off” emission periods (see Fig. 4B). Tracking was aborted when two Qd-labeled receptors crossed paths. Analysis of Qd diffusion was performed using two different approaches: (1) the diffusion coefficient (D) for trajectories was estimated using the mean square displacement curve (MSD), and (2) the apparent instantaneous diffusion coefficient (Dapp) was estimated over time. Thus, D was estimated from analysis of the MSD curve over the first 10% of the plot that covered track segments of 300 frames in length (i.e., 30 frames were used for MSD analysis). Dapp was estimated from smaller MSD plots calculated over contiguous trajectory stretches of 50 frames (i.e., 5 s). This allowed us to obtain a running measure of Dapp over time before and during fast ATP applications and simultaneous whole-cell patch-clamp recordings. As described in Results, ∼88% of P2X2 receptors displayed linear MSD plots that were fit with the following relation:
 |
where the slope is 4D and the localization error is e (see Fig. 5). We observed that ∼4% of P2X2 receptors displayed flat MSD plots indicative of corralled diffusion that were fit with the following:
where R is the corral size, and A1 and A2 are theoretical constants for a lattice of square corralling regions (Saxton, 1993). Another ∼5% of P2X2 receptors displayed convex parabolic MSD plots and were therefore fit with the following equation:
 |
where e is the localization error, and V is the velocity. These equations and analytical methods are not new and have been extensively described in the past and are routinely used in SPT experiments (Saxton and Jacobson, 1997; Triller and Choquet, 2008; Michalet, 2010; Pinaud et al., 2010).
Figure 4.
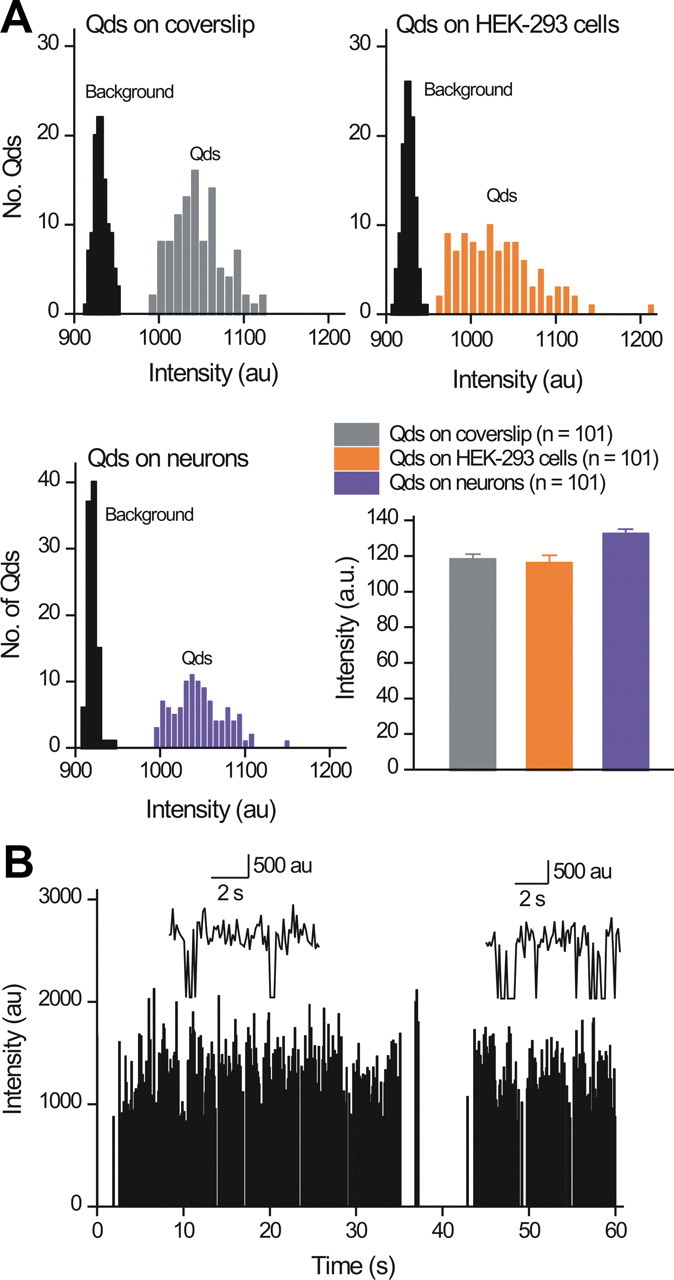
Imaging single plasma membrane P2X2FLAG–YFP receptors labeled with Qds. A, The graphs show the intensity of single Qds in relation to background noise when the diluted Qds were imaged in buffer alone or when they were imaged bound to P2X2FLAG–YFP receptors in HEK-293 cells and neurons. The equal intensity of single Qds in all three settings demonstrates that we could readily detect Qds above background fluorescence and provides strong evidence for single molecules. B, The graph shows the intensity of a Qd-labeled P2X2FLAG–YFP receptor in a neuron plotted over time, revealing two overall states that correspond to when the Qd is fluorescent and when it is not. This blinking behavior and the transitions between on and off states is indicative of single molecules, and two expanded events are shown as insets.
Figure 5.

Lateral mobility of single P2X2FLAG–YFP receptors in the plasma membrane of neuronal dendrites. A, Representative trajectories (shown as insets) extracted from single Qd movies (300 frames) along with their associated graphs of MSD against time interval. P2X2FLAG–YFP receptors displayed three types of MSD plots: linear MSD plots as illustrated in the left, corralled MSD plots as illustrated in middle, or directed trajectories as shown in the right. All three are described in detail in Results. B, Pie chart showing the proportions of the different types of P2X2FLAG–YFP receptor trajectories. C, Summary bar graphs for the average P2X2FLAG–YFP receptor trajectory areas and diffusion coefficients in neuronal dendrites. * indicates p < 0.05.
We analyzed colocalization across cells between Homer–DsRed and P2X2FLAG–YFP (n values provided in the text) by measuring the Pearson's correlation coefficient. In analyzing and interpreting the data, we followed published guidelines on colocalization analysis (Zinchuk and Zinchuk, 2008). Briefly, we interpreted Pearson's coefficient (which can range from −1 to 1) in the following way: −1 represents perfect negative correlation, 0 represent no correlation, and 1 represents perfect positive correlation, i.e., colocalization. Pearson's correlation coefficients of greater than ∼0.5 are interpreted as indicative of reliable colocalization between two spectrally separated fluorophores (Zinchuk and Zinchuk, 2008).
Software and statistical analysis.
SPT was performed with AsteriX (Pinaud et al., 2009; Michalet, 2010). Other imaging data and all electrophysiology data analysis was performed with Clampfit 10.1 (Molecular Devices), Origin 7.5 or 8.1 Pro (OriginLab), GraphPad Instat 3.0 (GraphPad Software), or NIH ImageJ. Data are as mean ± SEM from at least five experiments.
Results
In this study, we used postnatal rat hippocampal neurons because they represent an established cell culture model to study receptors in a native-like environment that reflects the endogenous expression of P2X2 receptors in adult hippocampal neurons (see Introduction). In addition, Qd-based single-molecule imaging can currently only be performed in cultured cells because of their favorable properties (Triller and Choquet, 2008) and so use of a cell culture model was necessary for the experiments reported herein.
Previously, use of P2X2 receptors carrying GFP tags on the C-terminus suggested activation-dependent receptor redistribution in hippocampal neurons (Khakh et al., 2001a). However, these past studies did not provide direct data on mobility. We thus started our evaluations in this study by generating YFP and FLAG-tagged P2X2 receptors (P2X2FLAG–YFP) to study macroscopic and single-receptor mobility in hippocampal neurons, as described below.
Engineered P2X2FLAG–YFP receptors for single-molecule imaging
Qds are fluorescent nanometer-sized semiconductor crystals with narrow emission spectra (Michalet et al., 2005). They are excellent fluorescent probes for single-molecule imaging because they are brighter than organic fluorophores and undergo less bleaching (Michalet et al., 2005; Triller and Choquet, 2008; Pinaud et al., 2010). This allows for individual Qd-labeled receptors to be observed for several minutes, permitting study of individual protein trajectories in cellular structures such as neuronal dendrites (Triller and Choquet, 2008). Single-molecule imaging with Qds can be performed using antibodies raised against extracellular epitopes (Triller and Choquet, 2008; Pinaud et al., 2010). However, despite 15 years of work, there are no antibodies available against the extracellular domain of P2X2 receptors. We thus engineered P2X2 receptors to carry FLAG epitope tags (P2X2FLAG) in the extracellular domain between Asp78 and Lys79 and transfected them into HEK-293 cells and hippocampal neurons. We chose the Lys79 site because FLAG tag insertion at this site has been extensively characterized, is known to be innocuous for receptor function, is useful for labeling using antibodies (Stoop et al., 1999; Bobanovic et al., 2002; Chaumont et al., 2004), and is surface exposed (Fig. 1A) as evinced by the zebrafish P2X4.1 structure (Kawate et al., 2009). Moreover, because past work has shown that P2X2 receptors carrying C-terminal fluorescent protein tags function like wild-type (WT) P2X2 (Khakh et al., 2001a; Bobanovic et al., 2002; Fisher et al., 2004; Khakh et al., 2005; Young et al., 2008), we combined P2X2FLAG with C-terminal YFP tags to generate P2X2FLAG–YFP, with the goal of imaging cell-surface receptors using the extracellular FLAG tag, and total receptors by virtue of YFP fluorescence.
Figure 1.
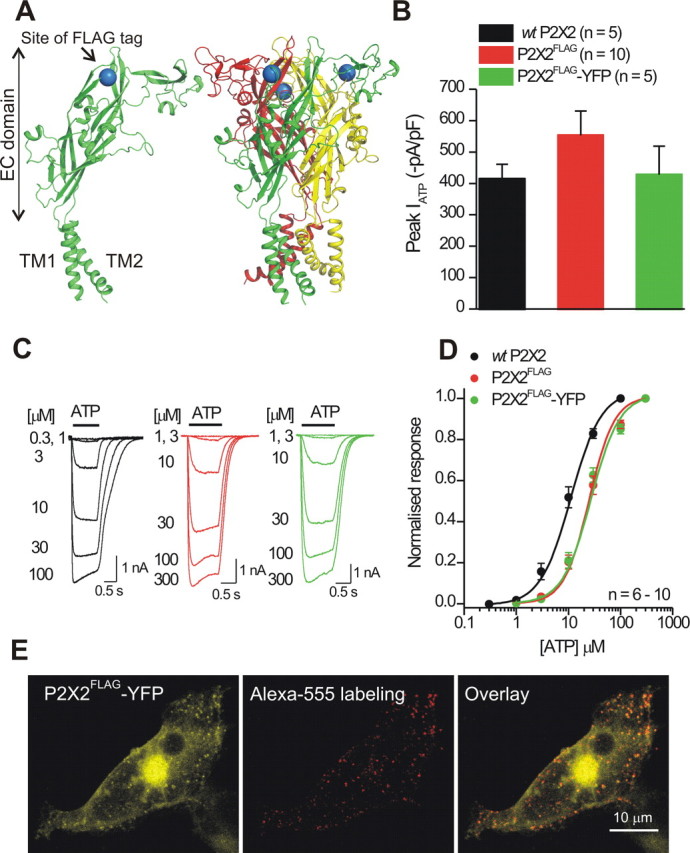
The FLAG tag at K79 in P2X2 receptors is surface exposed and can be labeled without altering receptor function. A, The models show a single P2X2 subunit (left) and a trimeric P2X2 receptor (right) with the FLAG tag insertion site shown schematically as a blue sphere (at K79) in the extracellular (EC) domain. The diagrams are based on the recently published zebrafish P2X4.1 crystal structure. B, Peak ATP-evoked current densities were not significantly different for the FLAG-tagged and FLAG plus YFP-tagged P2X2 receptors relative to WT P2X2. C, Representative traces for ATP-evoked currents at the indicated ATP concentrations for WT P2X2, P2X2FLAG, and P2X2FLAG–YFP receptors. D, Normalized ATP concentration–effect curves for WT P2X2, P2X2FLAG, and P2X2FLAG–YFP receptors (n = 6–10). E, Representative confocal stacks of a HEK-293 cell expressing P2X2FLAG–YFP receptors and labeled with anti-FLAG antibodies conjugated to Alexa Fluor 555, which labeled only the surface P2X2 receptors (representative of 3 such experiments).
In accord with past studies, we found that ATP-evoked current waveforms and peak current densities were not significantly different for wild type (WT) P2X2, P2X2FLAG, and P2X2FLAG–YFP receptors (Fig. 1B,C; n = 8–10). However, we found that FLAG tag insertion did shift the ATP sensitivity significantly by ∼2.6-fold (Fig. 1D; Tukey's ANOVA test), although the resultant EC50 at ∼24 μm was still in accord with reports for WT P2X2 in the literature (Khakh et al., 2001b). Thus, for a specific set of experiments, the ATP EC50 values were 9 ± 2 (n = 6), 12 ± 1 (n = 10), 28 ± 4 (n = 10), and 24 ± 3 μm (n = 10) for WT P2X2, P2X2–YFP, P2X2FLAG, and P2X2FLAG–YFP receptors, respectively (the corresponding Hill coefficients were 1.5 ± 0.2, 1.5 ± 0.1, 1.4 ± 0.1, and 1.3 ± 0.2). Cell-surface FLAG-tagged P2X2 receptors could also be labeled with biotinylated anti-FLAG antibodies and Alexa Fluor 555-conjugated secondary antibodies (Fig. 1E), demonstrating that the FLAG epitope was accessible (Chaumont et al., 2004).
Macroscopic mobility measured with FRAP
In FRAP experiments, one bleaches YFP-tagged receptors in a small area of interest and then measures recovery of fluorescence because receptors from surrounding areas replace the bleached receptors. In the most straightforward interpretation, complete recovery after photobleaching usually indicates that the mobile fraction (MF) of receptors is large. Conversely, incomplete recovery indicates the existence of an immobile pool of receptors. Both mobile and immobile pools are often observed for membrane proteins (Lippincott-Schwartz et al., 2001).
We measured FRAP for P2X2FLAG–YFP in neurons for ROIs in the somata and dendrites of hippocampal neurons (Fig. 2A,B). We found that the MF of P2X2FLAG–YFP receptors was ∼24 and 28% for somata and dendrites, i.e., significantly but only subtly larger in the dendrites (Fig. 2E; p < 0.05). Consequently, the immobile fraction (IMF) was large in dendrites and somata. Moreover, the time course of FRAP was significantly faster for dendrites than for somata (Fig. 2C–E). We also found that application of ATP (100 μm) decreased the time constant for FRAP significantly for P2X2FLAG–YFP receptors in the somata and dendrites, implying that ATP increased receptor mobility (Fig. 2C–E). Overall, the FRAP experiments suggested that the mobile and immobile pools may represent distinct types of plasma membrane lateral diffusion and/or an intracellular pool(s), as well as the possibility that the mobility of the plasma membrane P2X2 receptor pool may be regulated by ATP. FRAP cannot discriminate between these possibilities or provide data on plasma membrane receptors independently of intracellular receptors, which exist in abundance for P2X2 receptors (Khakh et al., 2001a). These considerations lead us to explore Qd-based single-molecule imaging, which is one of the few available methods that provide accurate data on diffusion of membrane proteins in living cells with a spatial resolution below the diffraction limit (Triller and Choquet, 2008).
Figure 2.
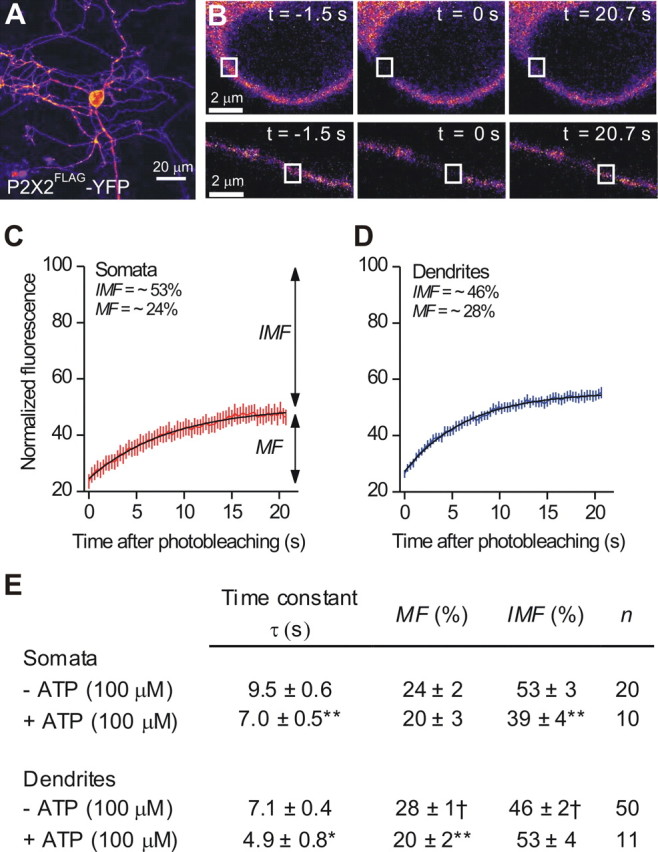
Macroscopic FRAP studies of P2X2FLAG–YFP receptor mobility in hippocampal neuron somata and dendrites. A, An image of a hippocampal neuron expressing P2X2FLAG–YFP receptors. B, The images are of P2X2FLAG–YFP fluorescence and ROIs (white boxes) for a hippocampal neuron cell body (top row) and a dendrite (bottom row) before, immediately after, and ∼21 s after photobleaching. C, Average FRAP curve for P2X2FLAG–YFP receptors from neuronal somata (n = 20). Note that MF and IMF were unequal. D, As in C, but for neuronal dendrites (n = 50). E, The table summarizes FRAP experiments for P2X2FLAG–YFP receptors in neuronal somata and dendrites before and during 100 μm ATP applications. Note that ATP applications significantly decreased FRAP time constants.
Imaging single Qd-labeled P2X2FLAG–YFP receptors
Cell-surface P2X2FLAG receptors in HEK-293 cells could be labeled with biotinylated anti-FLAG antibodies and streptavidin-coated Qds (Fig. 3A). Moreover, the Qd labeled receptors displayed only slightly altered ATP sensitivity compared with the unlabeled receptors (Fig. 3B; Table 1). To ensure that Qd-labeled and unlabeled receptors were equivalently activated, in subsequent experiments, we used 300 μm ATP, which is a near maximally effective concentration (Fig. 3B). We next used P2X2–YFP and P2X2FLAG–YFP receptors and assessed their macroscopic mobility using FRAP before and after Qd labeling. We found that Qd labeling did not alter FRAP in terms of kinetics or MF and IMF fractions (Fig. 3C; Table 1). These data show that the FLAG tag at Lys79 of P2X2 is accessible to Qds (Fig. 3A) and that neither the tag nor the Qds markedly alter receptor function (Fig. 3B,C). Moreover, P2X2FLAG receptors could be easily labeled with Qds emitting at 655 nm when expressed in hippocampal neurons resulting in the spotty fluorescence indicative of single molecules (Fig. 3D). In Figure 3D, the arrows point to single Qd-labeled P2X2FLAG–YFP receptors imaged concomitantly with the total cell surface and intracellular receptor populations as seen with YFP fluorescence.
Figure 3.

P2X2FLAG–YFP receptors can be labeled with Qds without markedly altering receptor function or macroscopic mobility. A, Labeling of P2X2FLAG–YFP receptors in HEK-293 cells. The panels show images of an HEK-293 cell expressing P2X2FLAG–YFP receptors. The YFP image (left) reveals overall P2X2FLAG–YFP expression in the cell, whereas the Qd image shows several spots of fluorescence (indicated by arrows). This is more readily seen in the merged image on the right. The boxed region for this image has also been enlarged. B, Concentration–effect curves for P2X2FLAG–YFP receptors expressed in HEK-293 cells under the indicated conditions. C, FRAP curves for P2X2FLAG–YFP receptors with (n = 20) and without (n = 21) Qd labeling. FRAP was performed and analyzed in 2 μm2 areas (see Table 1). D, As in A but for labeling of P2X2FLAG–YFP receptors in hippocampal neurons (the soma is overexposed to see the finer dendrites).
Table 1.
Properties of P2X2FLAG–YFP receptors with and without Qd labeling
| P2X2FLAG–YFP | P2X2FLAG–YFP + antibodies | P2X2FLAG–YFP + antibodies + Qds | Tukey's ANOVA | |
|---|---|---|---|---|
| Electrophysiology | ||||
| EC50 (μm) | 24 ± 3 | 52 ± 9 | 70 ± 22 | p > 0.05 |
| nH | 1.3 ± 0.1 | 1.2 ± 0.1 | 1.0 ± 0.2 | p > 0.05 |
| IATP peak current (−pA/pF) | 426 ± 52 | 322 ± 36 | 285 ± 46 | p > 0.05 |
| n | 10 | 5 | 7 | |
| FRAP | ||||
| Time constant (s) | 14 ± 1 | 13 ± 1 | 16 ± 2 | p > 0.05 |
| MF (%) | 19 ± 1 | 19 ± 1 | 19 ± 1 | p > 0.05 |
| IMF (%) | 42 ± 1 | 39 ± 1 | 45 ± 2 | p > 0.05 |
| n | 21 | 20 | 19 |
After pilot experiments with neurons and HEK-293 cells expressing P2X2FLAG–YFP, we found that the receptors were best labeled with 5 pm amounts of Qds (Fig. 4A). No such labeling was observed in HEK-293 cells or neurons expressing P2X2–YFP without a FLAG tag or when the primary antibody was omitted (data not shown). Using these procedures, we could image approximately five P2X2FLAG–YFP receptors per HEK-293 cell and ∼12 labeled receptors per hippocampal neuron. In relation to the dozen or so receptors labeled per neuron, parallel patch-clamp analysis of 300 μm ATP-evoked responses revealed substantial currents (−57 ± 18 pA/pF; n = 17). As shown previously (Khakh et al., 2001a), untransfected hippocampal neurons displayed no ATP-evoked currents (n = 6). Based on the known single-channel properties of P2X2 receptors (Ding and Sachs, 1999), this suggests that <1% of the surface receptors had been labeled with Qds, satisfying a key prerequisite for single-molecule imaging, namely the ability to track single molecules. The Qd-labeled P2X2FLAG–YFP receptors on neurons and HEK-293 cells displayed “blinking” (Fig. 4B), and their intensity in neurons and HEK-293 cells was identical to single Qds attached to glass coverslips (Fig. 4A), allowing us to easily identify and image single Qd-labeled P2X2FLAG–YFP receptors (Figs. 3, 4).
Distinct types of P2X2 receptor lateral mobility in neuronal dendrites
We used SPT and MSD analysis to measure diffusion coefficients (D) for Qd-labeled P2X2FLAG–YFP receptors in neuronal dendrites. The experiments reported in this study were for dendrites that were >100 μm long, 1.3 ± 0.1 μm thick, and with the Qd-labeled receptors typically located 44.1 ± 3.3 μm from the soma, although we studied all receptors along processes independently of their location (distance measurements are for 100 receptors from 16 cells but representative of >1000 receptors studied over 1.5 years).
A plot of MSD against time interval t typically takes three forms (Saxton and Jacobson, 1997; Triller and Choquet, 2008). First, the MSD versus t plot may be linear, defining pure Brownian motion. Second, the plot may tend asymptotically to a constant value indicating corralled/restricted diffusion. Third, the plot may be convex parabolic, indicating directed motion (Saxton and Jacobson, 1997). From a specific set of experiments we found that 88% of P2X2FLAG–YFP receptors in neurons displayed linear MSD plots, whereas ∼4% displayed flat MSD plots indicative of corralled diffusion (Fig. 5A,B), with a corral size of 0.305 ± 0.04 μm (n = 33 trajectories). An additional 5% displayed directed trajectories with a velocity of 0.033 ± 0.046 μm/s, and 3% displayed trajectories we could not assign to any category. Figure 5C reports values for the trajectory areas and D for these three classes. In the sections that follow, we focused on the majority of trajectories that were linear to determine whether ATP regulated lateral mobility. We did not analyze the trajectories that were corralled or directed any further because their occurrence was too low to reliably investigate.
The example linear MSD plot in Figure 5A represents a trajectory that covered an area of 1.08 μm2 in 30 s with D = 0.017 μm2/s. We repeated this analysis for all linear MSD plots (n = 658) for single P2X2FLAG–YFP receptors and found a bimodal semi-log-scale histogram representing two classes of D in neuronal dendrites (Fig. 6A,B). Henceforth, we termed receptors as “slowly mobile” if D differed by >2 SDs from the center of the largest peak representing the fastest pool, which we termed the “mobile pool” (Fig. 6B). The mean value of D for mobile receptors was 0.027 ± 0.0026 μm2/s (n = 460; Table 4), representing 70% of all receptors displaying linear MSD plots. The slowly mobile P2X2FLAG–YFP receptors displayed a D value that was ∼96 times lower than the mobile pool (0.00028 ± 0.00002 μm2/s; n = 198), representing 30% of all receptors displaying linear MSD plots (Fig. 6B). Both mobile and slowly mobile receptors were found in the same neurons, indicating that the difference in mobility was not attributable to differences in labeling procedures or differences in culture conditions between experiments.
Figure 6.
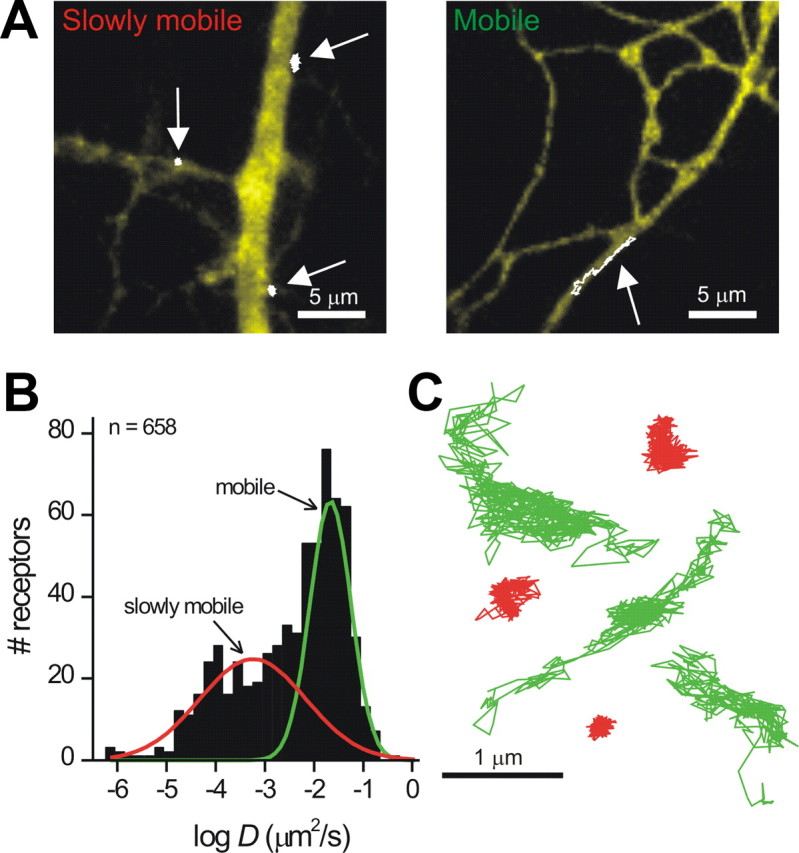
Mobile and slowly mobile pools of P2X2FLAG–YFP receptors in neuronal dendrites. A, Representative images of hippocampal neuron dendrites from cells expressing P2X2FLAG–YFP receptors. The total receptor population is visible based on the YFP fluorescence (shown as in yellow). In addition, single P2X2FLAG–YFP receptor trajectories are superimposed in white (see arrows). Three slowly mobile trajectories are shown in the left, and one mobile trajectory is shown on the right. All of these trajectories displayed linear MSD plots as shown in Figure 5A. B, Histogram showing the distribution of values for D for single P2X2FLAG–YFP receptors imaged on neuronal dendrites and classified as linear on the basis of their MSD plots. Two clearly discernible peaks are visible, which were fit by two Gaussians (red and green lines). C, Examples of linear trajectories of the mobile (green) and slowly mobile (red) classes.
Table 4.
Lateral mobility of P2X2FLAG–YFP receptors in neuronal dendrites and HEK-293 cells in relation to P2X4HA–YFP receptors in neurons
| Basal mobility in unpatched cells |
ATP-evoked responses in patched cells |
|||||||||||
|---|---|---|---|---|---|---|---|---|---|---|---|---|
| Mobile |
Slowly mobile |
|||||||||||
| D (μm2/s) | Area (μm2) | Qds | D (×10−4 μm2/s) | Area (μm2) | Qds | Dapp without ATP (μm2/s) | Dapp with ATP (μm2/s) | p* | Qds (n) | IATP (pA/pF) | Cells (n) | |
| P2X2FLAG–YFP in neurons | 0.027 ± 0.0026 | 1.2 ± 0.06 | n = 460 (70%) | 2.8 ± 0.2 | 0.08 ± 0.004 | n = 198 (30%) | 0.012 ± 0.002 | 0.027 ± 0.004 | <0.01 | 169 | −97 ± 7 | 37 |
| P2X2FLAG–YFP in HEK-293 cells | 0.0015 ± 0.0003 | 0.18 ± 0.017 | n = 114 (100%) | ND | ND | 0.011 ± 0.0034 | 0.0076 ± 0.0022 | 0.1 | 31 | −49 ± 9 | 12 | |
| P2X4HA–YFP in neurons | 0.032 ± 0.0033 | 1.3 ± 0.1 | n = 124 (75%) | 2.3 ± 0.41 | 0.12 ± 0.001** | n = 42 (25%) | 0.014 ± 0.0047 | 0.017 ± 0.0057 | 0.4 | 66 | −90 ± 8 | 16 |
The values for D indicated as basal mobility are only shown for the trajectories that were linear, as described in Results. * indicates p values for paired t test between without-ATP and with-ATP conditions for measurements of apparent diffusion coefficient Dapp for the experiments indicated (see Results). Area refers to area of the trajectory measured for 30 s imaging experiments as described in Results. ** indicates that the trajectory area for the slowly mobile P2X4HA–YFP receptors was significantly greater than the corresponding value for P2X2FLAG–YFP receptors (p < 0.01). ND indicates not determined because, in the case of P2X2FLAG–YFP receptors expressed in HEK-293 cells, the distribution of D was unimodal with a single value shown as the mobile pool, which was significantly smaller than the corresponding value for D in neurons.
Figure 6C shows six representative trajectories lasting ∼30 s for mobile and slowly mobile P2X2FLAG–YFP receptors in hippocampal neuron dendrites. The differences in membrane explored is readily apparent from the trajectory areas (Fig. 6C), which were 1.2 ± 0.06 μm2 (n = 460) and 0.08 ± 0.004 μm2 (n = 198) for mobile and slowly mobile receptors, respectively.
Slowly mobile P2X2 receptors do not reflect existence within receptor clusters or lipid rafts
We considered the possibility that individual slowly mobile Qd-labeled P2X2FLAG–YFP receptors may reflect location within larger P2X2 receptor clusters that were unlabeled with Qds. To address this, we exploited the YFP fluorescence of Qd-labeled P2X2FLAG–YFP receptors (Table 1). We found that the mobility of single Qd-labeled P2X2FLAG–YFP receptors was not related to the YFP intensity of the underlying trajectory (Fig. 7A), arguing against any detectable role of receptor clustering in contributing to mobility under our experimental conditions. We also examined slowly mobile Qd-labeled P2X2FLAG–YFP receptors directly and found that the YFP intensity of the underlying trajectory was no different from that of nearest regions (Fig. 7B; p > 0.05, n = 65). Thus, within the limits of the resolution of light microscopy, we found no evidence to suggest that slowly mobile P2X2FLAG–YFP receptors represented clusters. However, it remains formally possible that similar levels of YFP fluorescence may reflect different levels of surface receptors, an issue that will require additional developments in imaging methods to address.
Figure 7.

No relationship between diffusion coefficient and YFP intensity over the trajectory area for Qd-labeled P2X2FLAG–YFP receptors. A, The graph shows the diffusion coefficient D plotted against the YFP intensity measured at the exact same area covered by each Qd trajectory (n = 119). No correlation between the two parameters was apparent. This implies that slowly mobile and mobile P2X2 receptors exist in areas of the membrane with similar total numbers of P2X2 receptors. B, Top shows a P2X2 trajectory (white) with its area indicated as ROI 1. Next to it, another area of equal size is shown as ROI 2. The bottom graph shows the YFP intensity from 65 ROIs, such as 1 and 2 from the example image, demonstrating that ROIs with slowly mobile P2X2FLAG–YFP receptors (i.e., ROI 1) do not have higher levels of YFP fluorescence compared with nearest regions.
Recent work with HEK-293 cells suggests that P2X2 receptors may be localized in lipid rafts, although that study also showed that lipid raft disruption had no effect on P2X2 responses (Allsopp et al., 2010). Nonetheless, we used an established approach to disrupt lipid rafts by incubating hippocampal neurons with 10 mm methyl-β-cyclodextrin (mβCD) for 1 h at room temperature. We found that this procedure significantly changed the proportion of mobile and immobile receptors (68 and 32% in control and 50 and 50% after mβCD) when assessed with a Fisher's exact test and significantly decreased the mobile pool's diffusion coefficient [0.0228 ± 0.0029 μm2/s in control (n = 51 receptors from 15 cells) and 0.0125 ± 0.00164 μm2/s after mβCD (n = 46 receptors from 19 cells)] but did not change the slowly mobile pool's diffusion coefficient [0.00037 ± 0.000062 μm2/s in controls (n = 24 receptors from 11 cells) and 0.00025 ± 0.00004 μm2/s after mβCD (n = 46 receptors from 23 cells)]. Importantly, lipid raft disruption did not decrease the proportion of slowly mobile receptors, and thus we consider it unlikely that the P2X2 receptor slowly mobile pools are caused by lipid rafts that have been reported previously in HEK-293 cells (Allsopp et al., 2010).
Use-dependent regulation of P2X2FLAG–YFP receptor lateral mobility in neuronal dendrites
Recent studies show that receptor activation may alter mobility (Triller and Choquet, 2008), and past work suggests that P2X2 receptors undergo altered distributions when activated (Khakh et al., 2001a; Shrivastava et al., 2011) and that diffusion of P2X2–YFP receptors increased during activation by ATP in HEK-293 cells (Chaumont et al., 2008).
We combined single-molecule imaging with simultaneous whole-cell voltage-clamp recording (Fig. 8) and fast ATP applications to directly determine whether P2X2 receptor mobility was changed by receptor activation. To achieve this, we analyzed P2X2 receptor mobility by plotting the diffusion coefficient from 5 s trajectory tracts on the same timescale as ATP-evoked whole-cell currents (Fig. 8B). Because the trajectory tracts for this analysis were short (to follow over time), we could not reliably distinguish trajectory subclasses as shown in Figure 5 because this requires longer periods of analysis (typically ∼30 s). For this reason, we termed the running measure of D from short tracts as Dapp because this value represents an apparent diffusion coefficient.
Figure 8.
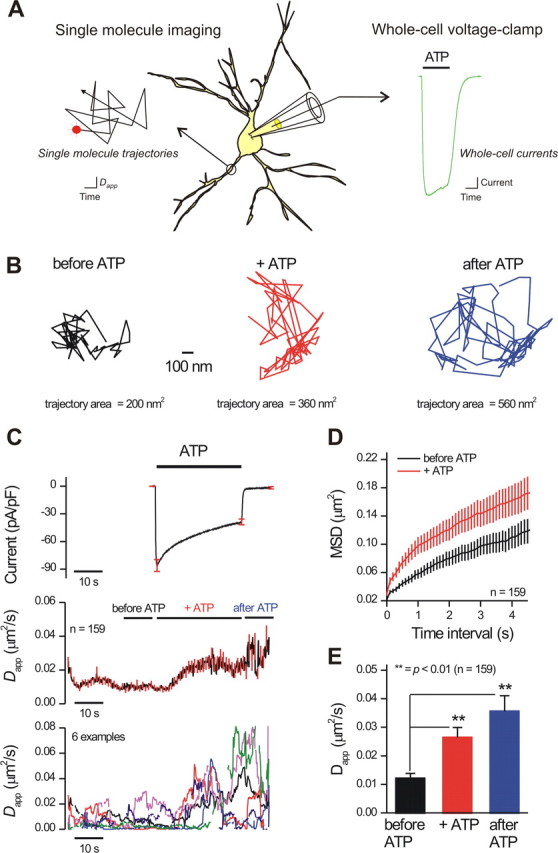
Patch-clamp coordinated single-molecule imaging of P2X2FLAG–YFP receptor mobility during ATP applications. A, The diagram illustrates the experimental procedure. Neurons expressing P2X2FLAG–YFP receptors were labeled with Qds as described in Results and imaged over time with epifluorescence optics. At the same time, whole-cell voltage-clamp electrophysiology was used to measure transmembrane currents before, during, and after ATP applications. ATP was applied using a fast solution switcher that exchanged solutions around neurons within ∼10 ms. We only imaged Qd-labeled P2X2FLAG–YFP receptors on processes because the processes could be imaged in the same z-axis optical plane. The diagrammatic trajectory and ATP-evoked current in A are for illustrative purposes only. B shows representative P2X2FLAG–YFP trajectories before, during, and after applications of 300 μm ATP; the area of the trajectory increased in ATP (see Results for average data). C, The top shows the duration of ATP applications (30 s) as indicated by the solid bar and the resulting ATP-evoked inward currents in neurons (at −60 mV). The black trace is an average of 37 cells, and the red lines represent SEM. The middle graph shows a plot of P2X2FLAG–YFP Dapp over time before, during, and after ATP applications (the red lines represent SEM). There was a significant increase in P2X2FLAG–YFP mobility during ATP application. We standardized measurements of Dapp before, during, and after ATP as shown by the black, red, and blue bars and presented these data in Table 4 and in E. The bottom plot shows six representative examples to provide a feel for the raw data. D shows the first 4 s of average MSD plots for P2X2FLAG–YFP receptor trajectories before and during ATP applications, demonstrating a clear difference in the MSD versus time interval plots when ATP was applied. E, Average data for experiments shown in C for data gathered at the time periods indicated by the solid bars in black, red, and blue. Experiments such as those shown in C–E were performed for 169 Qd-labeled P2X2FLAG–YFP receptors. Of these, 159 trajectories could be fit with a linear function for the MSD plot (D), and 151 could be analyzed to obtain the bar graph (E). **p < 0.01.
For a specific set of experiments with Qd-labeled P2X2FLAG–YFP receptors, 300 μm ATP-evoked currents were −97 ± 7 pA/pF, and the value for Dapp changed from ∼0.012 ± 0.002 to 0.027 ± 0.004 μm2/s (n = 37 cells, 169 receptors; Fig. 8B). This ATP-evoked change in mobility was also apparent from full trajectory analysis and MSD plots (Fig. 8C,D). The 10–90% rise time of the ATP-evoked current was 201 ± 28 ms, whereas the rise time of the change in Dapp was significantly slower at ∼5.2 s (n = 34 cells, 169 receptors). Moreover, there was a ∼5 s latency between the peak of the ATP-evoked current and beginning of the change in Dapp. As expected, the increase in P2X2 receptor mobility significantly increased the area of the membrane that was sampled from 0.46 ± 0.05 to 0.61 ± 0.07 μm2 (n = 169). Interestingly, after removal of ATP (indicated at “after ATP” in Fig. 8), the current returned to baseline levels but the increase in receptor mobility persisted/increased slightly (Fig. 8B,E). Consistent with the slower kinetics for the ATP-evoked increase in mobility relative to the ATP-evoked currents, we found that 5 s applications of ATP evoked smaller but still statistically significant increases in Dapp from 0.008 ± 0.004 to 0.013 ± 0.004 μm2/s (p < 0.05; ATP-evoked currents were −70 ± 11 pA/pF; n = 65 receptors from 15 cells).
We next determined whether mobile and slowly mobile receptors were both affected equivalently by ATP. To do so, we analyzed the receptor trajectories over 30 s before ATP applications using full trajectory analysis as reported in Figure 6, and post hoc tests were used this to evaluate whether both mobile and slowly mobile receptors displayed ATP-evoked changes in mobility. For this specific set of experiments, 79 receptors were mobile and 98 were slowly mobile. However, both showed significant increases in ATP-evoked mobility from 0.0054 ± 0.0014 to 0.012 ± 0.0030 μm2/s and from 0.024 ± 0.0032 to 0.051 ± 0.0062 μm2/s for the slowly mobile and mobile pools, respectively.
The role of calcium in use-dependent regulation of P2X2FLAG–YFP receptor lateral mobility in neuronal dendrites
We exploited “dead” receptors carrying K69A mutations in the P2X2 receptor extracellular domain to generate P2X2FLAG–YFP K69A receptors that are defective in ATP binding but are surface expressed (Ennion et al., 2000; Jiang et al., 2000, 2001, 2003). Patch-clamp coordinated SPT revealed negligible ATP-evoked currents and no ATP-evoked changes in mobility of P2X2FLAG–YFP K69A receptors (Fig. 9), indicating that binding of ATP to P2X2 receptors is required for the ATP-evoked increase in mobility. Moreover, in cells that were not carrying the K69A mutation, both ATP-evoked currents and elevations in mobility were blocked by the P2X receptor antagonist pyridoxal-phosphate-6-azophenyl-2′,4′-disulfonic acid (PPADS; 10 μm; Fig. 9). These control experiments also dismiss nonspecific effects of ATP applications on neurons.
Figure 9.
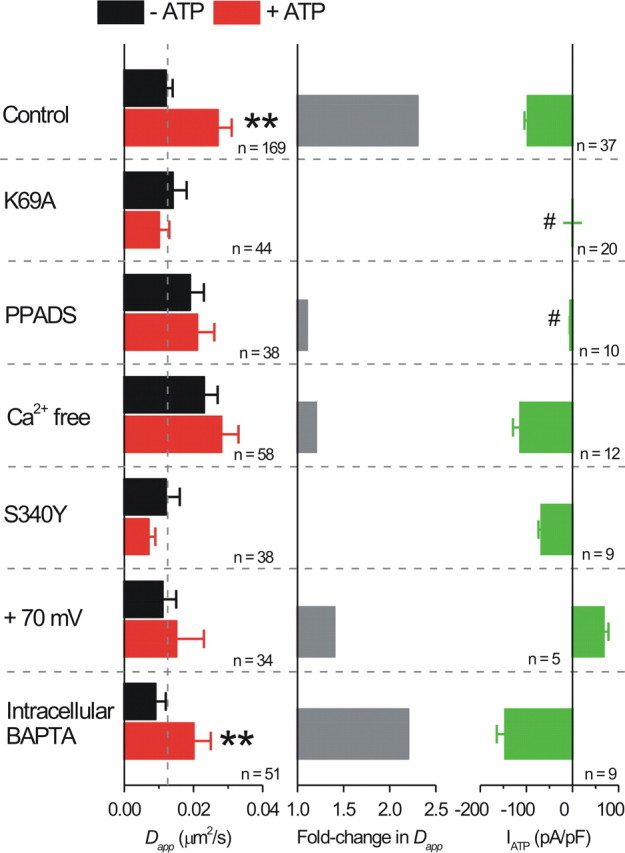
ATP-evoked increases in P2X2FLAG–YFP receptor mobility in neurons are use and calcium dependent. The left bar graph shows P2X2FLAG–YFP receptor Dapp values before and during ATP applications from experiments such as those shown in Figure 8 but for the experimental conditions shown in this figure on the left in bold. The middle bar graph shows the fold increase in Dapp during ATP applications for the indicated conditions, and the bar graph to the right shows the average peak ATP-evoked currents. The n values for the graph on the left are for the number of molecules imaged, whereas the n values on the graph on the right are for the number of cells patched. Statistically significant increases in P2X2FLAG–YFP receptor mobility are shown by **. The # symbols show that the ATP-evoked currents for these experiments were significantly reduced in amplitude (discussed in Results).
We explored mechanisms underlying how P2X2 receptor mobility is regulated by ATP by investigating the role of calcium entry, which is known to affect mobility of other receptors (Triller and Choquet, 2008) and because P2X2 receptors are significantly permeable to calcium (Egan and Khakh, 2004). We thus repeated the experiments shown in Figure 8B with extracellular buffers lacking calcium and found that the ATP-evoked increase in mobility was abolished but that the peak ATP-evoked currents were unaffected (Fig. 9). In these experiments, calcium removal significantly increased the baseline mobility of P2X2 receptors (Fig. 9; p < 0.05), and so we also explored other approaches to test a role of calcium ions in ATP-evoked regulation of receptor mobility. Thus, the ATP-evoked increase in mobility was also abolished when we used P2X2FLAG–YFP receptors carrying S340Y mutations in the pore-lining second transmembrane domain that are known to reduce calcium fluxes to nearly zero (Egan and Khakh, 2004) and when we voltage clamped neurons at +70 mV, i.e., positive to the Ca2+ equilibrium potential, resulting in ATP-evoked outward currents (Fig. 9). All of these data provide strong evidence to suggest that calcium entry via P2X2 receptors is needed to observe the ATP-evoked change in mobility of single Qd-labeled P2X2 receptors. Surprisingly, however, we found that dialysis of neurons with 3 or 10 mm BAPTA via the patch pipette (for ∼10 min) to chelate intracellular calcium (Fig. 9) did not alter the ability of ATP to evoke increased lateral mobility of P2X2FLAG–YFP receptors. There are two possible interpretations of this result. First, calcium entry via P2X2 receptors may act very locally near the channel such that it is insensitive to chelation by BAPTA in the cytosol. Second, BAPTA may be insufficiently loaded into dendrites and thus failed to chelate calcium entry through P2X2 receptors. Consistent with the first possibility, we found that the Ca2+ ionophore ionomycin did not increase the mobility of P2X2FLAG–YFP receptors (before ionomycin, Dapp was 0.026 ± 0.008; during ionomycin, Dapp was 0.022 ± 0.005; n = 35), although it clearly elevated neuronal intracellular Ca2+ levels (Table 2). Nonetheless, we do not have clear data to discriminate between the two aforementioned possibilities, and therefore our findings should be interpreted with both possibilities in mind. Overall, our data provide strong evidence to suggest that P2X2 receptor mobility increases in a use- and calcium-dependent manner (Fig. 9).
Table 2.
Peak change in intracellular calcium concentration of neurons under different conditions used in this study (in relation to Figs. 8 and 9)
| Resting [Ca2+]i (nm) | Peak [Ca2+]i (nm) | n | |
|---|---|---|---|
| Untransfected neurons | 69 ± 18 | 106 ± 24 | 8 |
| 300 μm ATP P2X2FLAG–YFP | 77 ± 10 | 1613 ± 697 | 11 |
| 300 μm ATP P2X2FLAG–YFP Ca2+ free | 69 ± 14 | 178 ± 52 | 13 |
| 5 μm ionomycin P2X2FLAG–YFP | 130 ± 31 | 1650 ± 522 | 12 |
The data were gathered using ratiometric fura-2 imaging as described in Materials and Methods. ATP or ionomycin were applied for 30 s at the indicated concentrations, and the peak change in calcium levels occurred within ∼10 s. The extracellular buffer comprised 1.8 mm Ca2+ for all experiments except those using 5 μm ionomycin. In this case, we used 3.6 mm Ca2+ after pilot experiments to ensure that the ionomycin-evoked calcium elevations were comparable with those mediated by P2X2 receptors (i.e., ∼1.6 μm at peak).
In a separate series of experiments, we estimated the change in calcium concentration triggered by ATP when P2X2FLAG–YFP receptors were activated. Resting cytosolic calcium levels were ∼100 nm within neurons but increased to ∼1.5 μm 10 s after applying 300 μm ATP (n = 11), i.e., when the increase in P2X2 receptor mobility reached its peak. The ATP-evoked change in calcium levels was abolished in buffers that lacked Ca2+ (n = 13). Ionomycin evoked an increase in Ca2+ concentrations to levels that were comparable with those measured as a result of P2X2FLAG–YFP receptor activation (Table 2).
ATP-evoked P2X2FLAG–YFP receptor mobility is regulated by VILIP1 in neuronal dendrites
P2X2 receptors are known to form a partnership with the neuronal calcium sensor VILIP1 in vitro and in vivo (Chaumont et al., 2008). With relevance to the present study, fluorescence resonance energy transfer microscopy shows that VILIP1–CFP and P2X2–YFP receptors form a molecular scale partnership in hippocampal neuron dendrites. Furthermore, past studies with HEK-293 cells suggested that VILIP1 increased the FRAP time course of P2X2–YFP receptors but blocked the ability of ATP to accelerate P2X2 FRAP (Chaumont et al., 2008). Together, these data raise the possibility that VILIP1 may regulate basal and ATP-regulated P2X2 receptor mobility. We explored this possibility with single-molecule imaging in hippocampal neuron dendrites and directly evaluated whether VILIP1 affected the mobility of single Qd-labeled P2X2FLAG–YFP receptors (Table 3). We found that the coexpression of VILIP1–CFP with P2X2FLAG–YFP significantly increased receptor mobility of the mobile pool and also increased the trajectory areas (Table 3). We also found that VILIP1 abolished the ability of ATP to increase the mobility of P2X2FLAG–YFP receptors in response to ATP (300 μm; Table 3). Together, these data support and extend past studies to hippocampal neuron dendrites and indicate that VILIP1 regulates P2X2 receptor mobility.
Table 3.
VILIP1 regulates lateral mobility of P2X2FLAG–YFP receptors in neuronal dendrites
| Basal mobility in unpatched cells |
ATP-evoked responses in unpatched cells |
||||||||||
|---|---|---|---|---|---|---|---|---|---|---|---|
| Mobile |
Slowly mobile |
||||||||||
| D (μm2/s) | Area (μm2) | Qds | D (×10−4 μm2/s) | Area (μm2) | Qds | Dapp without ATP (μm2/s) | Dapp with ATP (μm2/s) | p* | Qds (n) | Cells (n) | |
| P2X2FLAG–YFP in neurons | 0.017 ± 0.003 | 0.8 ± 0.1 | n = 55 (74%) | 3.2 ± 0.8 | 0.1 ± 0.02 | n = 19 (26%) | 0.037 ± 0.005 | 0.049 ± 0.007* | <0.01 | 74 | 18 |
| P2X2FLAG–YFP + VILIP1–CFP | 0.032 ± 0.006** | 1.4 ± 0.3** | n = 37 (63%) | 3.9 ± 0.8 | 0.09 ± 0.01 | n = 22 (37%) | 0.047 ± 0.007 | 0.054 ± 0.009 | >0.05 | 59 | 41 |
The values for D indicated as basal mobility are only shown for the trajectories that were linear, as described in Results. * indicates p values for paired t test between without-ATP and with-ATP conditions for measurements of apparent diffusion coefficient Dapp for the experiments indicated (see Results). Area refers to area of the trajectory measured for 30 s imaging experiments as described in the Results. ** and * indicate that the values for D and the trajectory area for P2X2FLAG–YFP plus VILIP1 were significantly greater than for P2X2FLAG–YFP alone (p < 0.01 and p < 0.05, respectively). For the ATP-evoked responses, we used nonpatched cells for these experiments to ensure that VILIP1–CFP was not dialyzed out of the cells.
Cell and receptor specificity: lateral diffusion of P2X4HA–YFP receptors in neurons and of P2X2FLAG–YFP receptors in HEK-293 cells
We repeated key experiments from the preceding sections with P2X4 receptors to determine whether the ATP-evoked increase in mobility was P2X2 specific. To this end, we used P2X4 receptors carrying HA tags (P2X4HA–YFP) at the equivalent position used to generate P2X2FLAG receptors (Fig. 2A). The distinct P2X2FLAG–YFP receptor diffusion coefficients in the plasma membrane of neurons (Fig. 4) were similar to those observed for P2X4HA–YFP (Table 4), with similar values for D for mobile and slowly mobile pools (n = 183). However, P2X4HA–YFP slowly mobile trajectories displayed significantly larger areas by 150% compared with P2X2FLAG—YFP, indicating a less “confined” receptor population, and P2X4HA–YFP showed an increase in trajectories that displayed a directed MSD curve (9%) compared with P2X2FLAG–YFP (5%). Moreover, we found that Qd-labeled P2X4HA–YFP receptors did not show any ATP-dependent increase in mobility when expressed in neurons, although ATP-evoked substantial currents (−90 ± 8 pA/pF; n = 16; Table 4).
We also examined P2X2FLAG–YFP receptor mobility in HEK-293 cells to determine whether the P2X2 responses were cell specific. We found that the distribution of P2X2FLAG–YFP receptor D in HEK-293 cells did not display two peaks as observed in neurons (Fig. 6) but instead displayed a single peak with a mean of 0.00148 ± 0.00029 μm2/s and area of 0.177 ± 0.0174 μm2 (n = 114 receptors from 15 cells; Table 4). We also determined whether ATP applications caused changes in Dapp for P2X2FLAG–YFP receptors expressed in HEK-293 cells. We measured large ATP-evoked currents, but we failed to measure any ATP-evoked changes in P2X2FLAG–YFP receptor mobility (Table 4). Within the limits of the two cell types examined, we conclude that P2X2FLAG–YFP receptor basal mobility and regulation by ATP is cell specific, underscoring the importance of studying P2X2FLAG–YFP receptor mobility in native cell types such as neurons rather than in HEK-293 cells.
Relationship of P2X2FLAG–YFP receptors to excitatory synapses
Previous electron microscopy studies show that P2X2 receptors are not located on postsynaptic densities of excitatory synapses (Rubio and Soto, 2001). We performed a specific set of experiments to determine whether P2X2FLAG–YFP receptors were located within excitatory synapses for the experiments reported herein. We used Homer–DsRed as a marker for excitatory synapses (Petrini et al., 2009) and examined colocalization with total P2X2FLAG–YFP receptors in dendrites (Fig. 10A). We found that the Pearson's correlation coefficient (Zinchuk and Zinchuk, 2008) was 0.17 ± 0.02 (n = 22), indicating negligible colocalization between P2X2FLAG–YFP receptors and Homer–DsRed. Similarly, when we labeled only the surface pool of P2X2FLAG receptors and examined colocalization with Homer–DsRed, we measured a Pearson's correlation coefficient of 0.06 ± 0.02 (n = 26), also indicative of no significant colocalization (Fig. 10B). Consistent with past work (Rubio and Soto, 2001), these data provide no evidence for P2X2 receptor expression within synaptic regions of excitatory synapses in hippocampal neurons.
Figure 10.
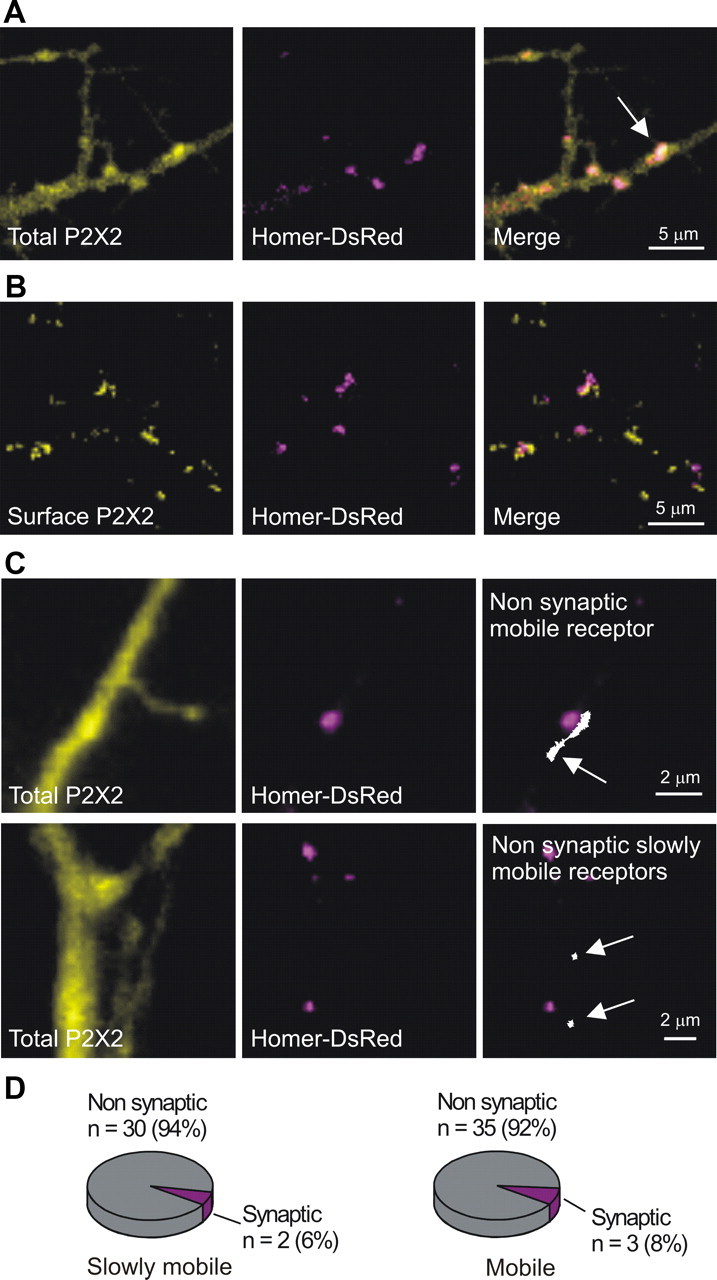
Relationship of P2X2 receptors to excitatory synapses. A, Images of neuronal dendrites from cells cotransfected with P2X2FLAG–YFP and Homer–DsRed. The left is the YFP image reflecting total P2X2FLAG–YFP expression, the middle is the Homer–DsRed image, and the right is a merge of the two. The white arrow points to a region of colocalization. B, As in A but, in this case, P2X2FLAG was cotransfected with Homer–DsRed and the surface fraction of P2X2FLAG receptors labeled with Alexa Fluor 488. Numerous regions of fluorescence corresponding to surface P2X2FLAG receptors can be seen, but these did not colocalize with Homer–DsRed. Of the total number of surface P2X2FLAG regions analyzed (n = 862), 28% were adjacent to a spot of Homer–DsRed and 72% were not adjacent. Thus, there was no colocalization of surface P2X2 receptors and Homer–DsRed (see Results). C, Top row, Representative images for experiments assessing whether mobile and slowly mobile Qd-labeled P2X2FLAG–YFP receptors overlapped with Homer–DsRed. The left shows the total pool of P2X2FLAG–YFP receptors based on the YFP image. The middle shows the Homer–DsRed image. The right shows a mobile P2X2 receptor trajectory (arrow) superimposed with the Homer–DsRed image. Note the trajectory does not overlap with Homer–DsRed. The bottom panels are similar but show two slowly mobile receptors (arrows) relative to Homer–DsRed. D, Pie charts summarizing findings for experiments such as those shown in C for mobile and slowly mobile receptors. The vast majority of slowly mobile and mobile Qd-labeled P2X2FLAG–YFP receptors did not overlap with Homer–DsRed and were thus designated as nonsynaptic (for additional details, see Results).
Because our data demonstrate distinct pools of mobile and slowly mobile Qd-labeled P2X2FLAG–YFP receptors on dendrites (Fig. 6), we next determined whether the slowly mobile pool imaged at the single-molecule level might represent receptors that localized to excitatory synapses. To address this, we performed SPT on Qd-labeled P2X2FLAG–YFP receptors in relation to Homer–DsRed as a marker of excitatory synapses (example images are shown in Fig. 10C). We found that only 2% of slowly mobile receptors imaged at the single-molecule level overlapped with Homer–DsRed (Fig. 10D). Similarly, only 8% of mobile receptors overlapped with Homer–DsRed (Fig. 10D). These data show that the vast majority of mobile and slowly mobile P2X2FLAG–YFP receptors did not overlap with Homer–DsRed and were thus designated as nonsynaptic (Fig. 10C,D; i.e., dendritic). We point out that we did not separate nonsynaptic receptors further into perisynaptic and extrasynaptic pools because this distinction is difficult to make for receptors that are clearly mobile and may reflect the time interval over which receptors were imaged on dendrites (Fig. 6). Irrespectively, the data show that slowly mobile receptors are not attributable to detectable localization within excitatory synapses.
Discussion
The main findings of this study are schematized in Figure 11. They include that (1) engineered P2X2FLAG–YFP receptors can be used for Qd-based single-molecule imaging to measure their lateral mobility, (2) P2X2 receptors display distinct types of lateral mobility in the dendrites of neurons, and (3) their mobility increases at a rate of ∼0.2 s−1 by approximately twofold in a use- and calcium-dependent manner. Thus, the ATP-evoked change in mobility is far slower than channel opening, which happens in <1 ms but similar in time course to slow conformational changes in P2X2 receptors that happen over seconds and affect channel function and protein interactions (Khakh et al., 1999; Virginio et al., 1999; Eickhorst et al., 2002; Fisher et al., 2004; Khakh and Egan, 2005; Chaumont and Khakh, 2008; Chaumont et al., 2008).
Figure 11.

Diagram illustrating that ATP activation of P2X2 receptors approximately doubles their lateral mobility with a rate constant of ∼0.2 s−1. PM, Plasma membrane.
We capitalized on and extended past work with fluorescent protein-tagged P2X2 receptors and FRAP (Khakh et al., 2001a, 2005; Chaumont et al., 2008), as well as with SPT of FLAG-tagged P2X2 receptors in spinal cord neurons (Shrivastava et al., 2011) to explore the mobility and regulation of P2X2 receptors within a native-like environment. It is important to note that lateral mobility can only be studied with single-molecule imaging, which in turn can only be performed within optically amenable systems. For practical purposes, this means cell culture systems in part because brain slices scatter light (Triller and Choquet, 2008; Pinaud et al., 2010). Of course, hippocampal neurons in culture are only a model of hippocampal neurons in vivo, and thus our data should be interpreted with this caveat in mind.
Past work with P2X1 and P2X4 receptors has shown that they are dynamically trafficked by constitutive and ATP-evoked endocytosis (Ennion and Evans, 2001; Bobanovic et al., 2002; Royle et al., 2002, 2005; Royle and Murrell-Lagnado, 2003; Qureshi et al., 2007; Murrell-Lagnado and Qureshi, 2008; Boumechache et al., 2009; Lalo et al., 2010; Toulmé et al., 2010). In contrast, P2X2 receptors do not undergo significant endocytosis over a timescale of tens of seconds (Bobanovic et al., 2002; Chaumont et al., 2004). However, past work has suggested that P2X2 receptors may undergo redistribution in the plasma membrane in response to ATP (Khakh et al., 2001a; Chaumont et al., 2008), although direct evidence has been lacking. In the present study, we determined whether P2X2 receptors are dynamically trafficked in the plasma membrane and whether this process is regulated by ATP.
FRAP and single-molecule imaging of P2X2 receptor dynamics
We started our evaluations of P2X2 receptor mobility in neurons by using FRAP, which suggested that ATP regulated P2X2 macroscopic mobility. However, FRAP displayed a significant IMF (∼50%; Fig. 2E) that most likely reflects an intracellular pool of receptors (Khakh et al., 2001a). Also, the diffraction limit means that FRAP has poor z-axis resolution and thus cannot assess plasma membrane receptors independently of those just beneath the surface (Jaiswal and Simon, 2007; Triller and Choquet, 2008). Using single-molecule methods, we found that ∼31% of plasma membrane P2X2 receptors were likely to be immobile (sum of the corralled and slowly mobile fractions in Figs. 5B, 6 and Table 4), providing evidence that FRAP reports stable intracellular fluorescence.
P2X2FLAG–YFP receptors could be labeled with Qds without markedly altering receptor function, although there was a ∼2.6-fold decrease in ATP EC50 for the tagged and Qd-labeled receptors relative to WT P2X2. There is no simple way to calculate accurate diffusion coefficients from FRAP experiments for P2X2FLAG–YFP receptors, but estimates suggest a value in the range of 0.01–0.03 μm2/s (Chaumont et al., 2008; Richler et al., 2008). This is in keeping with the values we measured directly with single-molecule imaging (Table 4), indicating that Qds do not overtly affect the mobility of receptors, as expected from theoretical and experimental work (Saffman and Delbrück, 1975; Triller and Choquet, 2008; Pinaud et al., 2010). Moreover, P2X diffusion coefficients are in accord with past studies on membrane proteins (Triller and Choquet, 2008) and with P2X2 receptor diffusion in spinal cord neurons (Shrivastava et al., 2011). Because of their favorable optical properties, the use of Qd-labeled P2X2FLAG–YFP receptors could now be extended to a variety of biological questions, including the study of receptor interactions and possibly receptor gating.
Basal P2X2 receptor mobility
Using single-molecule imaging and tracking, our data provide the first direct measurement of P2X receptor diffusion in the plasma membrane and the first direct proof for the existence of pools of P2X2 receptors with distinct types of mobility. Based on comparative work with P2X4 receptors, the lateral diffusion of P2X2 receptors is subunit specific, albeit only subtly (Table 4). Mobile and slowly mobile pools have also been observed for other receptors in the plasma membrane, but the basis for these pools is not known (Triller and Choquet, 2008). We explored the possibility that slowly mobile P2X2 receptors were sequestered in clusters or lipid rafts (Allsopp et al., 2010), but our data did not support these possibilities. Thus, the basis for different P2X2 receptor mobility types remains to be determined in future studies. Our data do suggest that VILIP1 regulates basal P2X2 receptor mobility (Chaumont et al., 2008). In the future, when VILIP1 and P2X2 receptor antibodies become available, it will be interesting to explore this further using siRNA knockdown approaches for natively expressed proteins.
ATP regulation of cell-surface P2X2 receptor mobility
As far as we know, our experiments are the first to combine single-molecule imaging and tracking with simultaneous whole-cell voltage-clamp recordings to measure receptor mobility and function concomitantly. We found that receptor lateral mobility doubled when the channels were opened and that this required calcium flux. The evidence to suggest this is threefold. First, the ATP-evoked increase in mobility was blocked by recording in calcium-free extracellular buffers. Second, S340Y mutants that are known to abrogate calcium flux also lacked ATP-evoked increases in P2X2 mobility (Migita et al., 2001; Egan and Khakh, 2004). Third, ATP-evoked mobility increases were blocked by voltage clamping the cells at positive voltages (+70 mV), when the inward driving force on calcium ions was substantially reduced. However, ATP-evoked P2X2 receptor mobility increases were not blocked by intracellular dialysis with BAPTA, implying that calcium entry via P2X2 receptors acts locally to increase mobility. Consistent with this suggestion, elevating calcium globally by ionomycin without activating P2X2 receptors within neurons (Table 2) did not increase P2X2 receptor lateral mobility, demonstrating that a global increase in intracellular calcium is insufficient to increase P2X2 receptor mobility. The most parsimonious explanation is that the ATP-evoked change in P2X2 receptor mobility is calcium flux dependent and that calcium acts locally within a microdomain to regulate mobility. Identifying the effectors for calcium within such microdomains will require additional work, perhaps using proteomic approaches with full-length P2X2 receptors (Chaumont et al., 2008).
Importantly, using SPT, the use- and calcium-dependent increase in P2X2 receptor mobility was not observed in HEK-293 cells and was specific to P2X2 receptors as similar observations were not made with P2X4HA–YFP receptors in neurons (Table 4). In relation to this, past work with FRAP of P2X2–YFP receptors in HEK-293 cells suggested that ATP increased receptor mobility and that this effect was blocked by VILIP1 (Chaumont et al., 2008). Together, our data suggest that VILIP1 regulates surface receptor lateral mobility (measured by SPT in this study) as well as trafficking of P2X2 receptors within intracellular compartments (Chaumont et al., 2008). In accord, VILIP1 is known to affect intracellular trafficking of nicotinic receptors (Lin et al., 2002). Overall, the differences between SPT and FRAP further illustrate the value in measuring surface receptor diffusion directly with Qds and SPT.
Overall, our data show that P2X2 receptors sample approximately twice as much of the plasma membrane (in a given time interval) when they are activated by ATP and when intracellular calcium flux occurs. The local nature of P2X2 regulation by calcium also implies that lateral mobility of this receptor may not be regulated by other signaling cascades (e.g., GPCR pathways) that also elevate calcium levels of neurons. Also, high concentrations of ATP are released from injured cells (Cook and McCleskey, 2002) as well as from astrocytes and neurons (Fields and Burnstock, 2006), and this ATP should be accessible to P2X2 receptors on neuronal dendrites.
Avenues for additional investigation
Our findings reveal a novel form of regulated P2X2 receptor trafficking in the plane of the plasma membrane. It would be interesting to extend these experiments to brain slices. However, such studies will have to await one or more advances. Thus, one would need to develop P2X2 subunit-specific antibodies that target the extracellular domain (without altering functional responses) and develop optical approaches to perform Qd-based single-molecule imaging in slices of brain, or in what is perhaps the most promising approach, knock-in mice expressing P2X2FLAG receptors in vivo would need to be generated. In future work, it will also be interesting to determine the molecular basis of P2X2 receptor mobility by combining single-molecule imaging experiments with optical measures of channel gating and evaluate mutant P2X2 receptor cohorts targeting the cytosolic domain, which is known to harbor protein interaction motifs (Chaumont et al., 2004, 2008; Chaumont and Khakh, 2006, 2008). Once distinct mutant receptors lacking ATP regulation of mobility are known, it should then be possible to express them in vivo. The study of receptor lateral diffusion is a nascent field, and important roles for receptor lateral diffusion for in vivo signaling are expected based on work in vitro (Triller and Choquet, 2008). From this perspective, our studies with P2X2 receptors offer unique opportunities to experimentally explore how lateral mobility is used during ATP signaling.
Footnotes
E.R. was supported by funds from the Molecular Cellular and Integrative Physiology (MCIP) Graduate Program at University of California, Los Angeles, which was supported by Grant T32GM065823 from the National Institute of General Medical Sciences. E.R. was also supported by the Training Program in Neural Repair through Grant T32 NS07449-05, by NIH/NINDS Fellowship NS064794, and with funds from the Khakh laboratory. The Khakh laboratory was supported partly by NIH Grants NS063186 and NS060677, a Stein-Oppenheimer Foundation Endowment Award, and unrestricted funds from University of California, Los Angeles (B.S.K.). We thank Dr. X. Michalet for guidance with data analysis and for extensive discussions during this project, Dr. S. Kracun for help generating the P2X2 receptor homology model figure and to members of the laboratory for comments and discussions, Dr. S Chaumont for making FLAG-tagged P2X2, E. Toulmé for making HA-tagged P2X4, and D. Choquet for the Homer–DsRed plasmid.
References
- Allsopp RC, Lalo U, Evans RJ. Lipid raft association and cholesterol sensitivity of P2X1-4 receptors for ATP: chimeras and point mutants identify intracellular amino-terminal residues involved in lipid regulation of P2X1 receptors. J Biol Chem. 2010;285:32770–32777. doi: 10.1074/jbc.M110.148940. [DOI] [PMC free article] [PubMed] [Google Scholar]
- Barajas-López C, Espinosa-Luna R, Zhu Y. Functional interactions between nicotinic and P2X channels in short-term cultures of guinea-pig submucosal neurons. J Physiol. 1998;513:671–683. doi: 10.1111/j.1469-7793.1998.671ba.x. [DOI] [PMC free article] [PubMed] [Google Scholar]
- Bobanovic LK, Royle SJ, Murrell-Lagnado RD. P2X receptor trafficking in neurons is subunit specific. J Neurosci. 2002;22:4814–4824. doi: 10.1523/JNEUROSCI.22-12-04814.2002. [DOI] [PMC free article] [PubMed] [Google Scholar]
- Boué-Grabot E, Toulmé E, Emerit MB, Garret M. Subunit-specific coupling between gamma-aminobutyric acid type A and P2X2 receptor channels. J Biol Chem. 2004a;279:52517–52525. doi: 10.1074/jbc.M410223200. [DOI] [PubMed] [Google Scholar]
- Boué-Grabot E, Emerit MB, Toulmé E, Séguéla P, Garret M. Cross-talk and co-trafficking between rho1/GABA receptors and ATP-gated channels. J Biol Chem. 2004b;279:6967–6975. doi: 10.1074/jbc.M307772200. [DOI] [PubMed] [Google Scholar]
- Boumechache M, Masin M, Edwardson JM, Górecki DC, Murrell-Lagnado R. Analysis of assembly and trafficking of native P2X4 and P2X7 receptor complexes in rodent immune cells. J Biol Chem. 2009;284:13446–13454. doi: 10.1074/jbc.M901255200. [DOI] [PMC free article] [PubMed] [Google Scholar]
- Burnstock G, Kennedy C. P2X receptors in health and disease. Adv Pharmacol. 2011;61:333–372. doi: 10.1016/B978-0-12-385526-8.00011-4. [DOI] [PubMed] [Google Scholar]
- Chaumont S, Khakh BS. Regulation of ATP-gated P2X channel functions by their cytosolic domains. In: Arias H, editor. Biological and biophysical aspects of ligand-gated ion channel receptor superfamilies. Kerala, India: Research Signpost; 2006. [Google Scholar]
- Chaumont S, Khakh BS. Patch-clamp coordinated spectroscopy shows P2X2 receptor permeability dynamics require cytosolic domain rearrangements, but not Panx-1 channels. Proc Natl Acad Sci U S A. 2008;105:12063–12068. doi: 10.1073/pnas.0803008105. [DOI] [PMC free article] [PubMed] [Google Scholar]
- Chaumont S, Jiang LH, Penna A, North RA, Rassendren F. Identification of a trafficking motif involved in the stabilization and polarization of P2X receptors. J Biol Chem. 2004;279:29628–29638. doi: 10.1074/jbc.M403940200. [DOI] [PubMed] [Google Scholar]
- Chaumont S, Compan V, Toulme E, Richler E, Housley GD, Rassendren F, Khakh BS. Regulation of P2X2 receptors by the neuronal calcium sensor VILIP1. Sci Signal. 2008;1:ra8. doi: 10.1126/scisignal.1162329. [DOI] [PMC free article] [PubMed] [Google Scholar]
- Collo G, North RA, Kawashima E, Merlo-Pich E, Neidhart S, Surprenant A, Buell G. Cloning of P2X5 and P2X6 receptors and the distribution and properties of an extended family of ATP-gated ion channels. J Neurosci. 1996;16:2495–2507. doi: 10.1523/JNEUROSCI.16-08-02495.1996. [DOI] [PMC free article] [PubMed] [Google Scholar]
- Cook SP, McCleskey EW. Cell damage excites nociceptors through release of cytosolic ATP. Pain. 2002;95:41–47. doi: 10.1016/s0304-3959(01)00372-4. [DOI] [PubMed] [Google Scholar]
- Decker DA, Galligan JJ. Cross-inhibition between nicotinic acetylcholine receptors and P2X receptors in myenteric neurons and HEK-293 cells. Am J Physiol Gastrointest Liver Physiol. 2009;296:G1267–G1276. doi: 10.1152/ajpgi.00048.2009. [DOI] [PMC free article] [PubMed] [Google Scholar]
- Decker DA, Galligan JJ. Molecular mechanisms of cross-inhibition between nicotinic acetylcholine receptors and P2X receptors in myenteric neurons and HEK-293 cells. Neurogastroenterol Motil. 2010;22:901–908, e235. doi: 10.1111/j.1365-2982.2010.01505.x. [DOI] [PMC free article] [PubMed] [Google Scholar]
- Ding S, Sachs F. Single channel properties of P2X2 purinoceptors. J Gen Physiol. 1999;113:695–720. doi: 10.1085/jgp.113.5.695. [DOI] [PMC free article] [PubMed] [Google Scholar]
- Egan TM, Khakh BS. Contribution of calcium ions to P2X channel responses. J Neurosci. 2004;24:3413–3420. doi: 10.1523/JNEUROSCI.5429-03.2004. [DOI] [PMC free article] [PubMed] [Google Scholar]
- Eickhorst AN, Berson A, Cockayne D, Lester HA, Khakh BS. Control of P2X2 channel permeability by the cytosolic domain. J Gen Physiol. 2002;120:119–131. doi: 10.1085/jgp.20028535. [DOI] [PMC free article] [PubMed] [Google Scholar]
- Ennion SJ, Evans RJ. Agonist-stimulated internalisation of the ligand-gated ion channel P2X1 in rat vas deferens. FEBS Lett. 2001;489:154–158. doi: 10.1016/s0014-5793(01)02102-0. [DOI] [PubMed] [Google Scholar]
- Ennion S, Hagan S, Evans RJ. The role of positively charged amino acids in ATP recognition by human P2X1 receptors. J Biol Chem. 2000;275:29361–29367. doi: 10.1074/jbc.M003637200. [DOI] [PubMed] [Google Scholar]
- Evans RJ, Derkach V, Surprenant A. ATP mediates fast synaptic transmission in mammalian neurons. Nature. 1992;357:503–505. doi: 10.1038/357503a0. [DOI] [PubMed] [Google Scholar]
- Fields RD, Burnstock G. Purinergic signalling in neuron-glia interactions. Nat Rev Neurosci. 2006;7:423–436. doi: 10.1038/nrn1928. [DOI] [PMC free article] [PubMed] [Google Scholar]
- Fisher JA, Girdler G, Khakh BS. Time-resolved measurement of state-specific P2X2 ion channel cytosolic gating motions. J Neurosci. 2004;24:10475–10487. doi: 10.1523/JNEUROSCI.3250-04.2004. [DOI] [PMC free article] [PubMed] [Google Scholar]
- Galligan JJ, Bertrand PP. ATP mediates fast synaptic potentials in enteric neurons. J Neurosci. 1994;14:7563–7571. doi: 10.1523/JNEUROSCI.14-12-07563.1994. [DOI] [PMC free article] [PubMed] [Google Scholar]
- Green T, Heinemann SF, Gusella JF. Molecular neurobiology and genetics: investigation of neural function and dysfunction. Neuron. 1998;20:427–444. doi: 10.1016/s0896-6273(00)80986-1. [DOI] [PubMed] [Google Scholar]
- Jaiswal JK, Simon SM. Imaging single events at the cell membrane. Nat Chem Biol. 2007;3:92–98. doi: 10.1038/nchembio855. [DOI] [PubMed] [Google Scholar]
- Jiang LH, Rassendren F, Surprenant A, North RA. Identification of amino acid residues contributing to the ATP binding site of a P2X receptor. J Biol Chem. 2000;275:34190–34196. doi: 10.1074/jbc.M005481200. [DOI] [PubMed] [Google Scholar]
- Jiang LH, Rassendren F, Spelta V, Surprenant A, North RA. Amino acid residues involved in gating identified in the first membrane-spanning domain of the rat P2X2 receptor. J Biol Chem. 2001;276:14902–14908. doi: 10.1074/jbc.M011327200. [DOI] [PubMed] [Google Scholar]
- Jiang LH, Kim M, Spelta V, Bo X, Surprenant A, North RA. Subunit arrangement in P2X receptors. J Neurosci. 2003;23:8903–8910. doi: 10.1523/JNEUROSCI.23-26-08903.2003. [DOI] [PMC free article] [PubMed] [Google Scholar]
- Jo YH, Donier E, Martinez A, Garret M, Toulmé E, Boué-Grabot E. Crosstalk between P2X4 and GABA-A receptors determines synaptic efficacy at central synapses. J Biol Chem. 2011;286:19993–20004. doi: 10.1074/jbc.M111.231324. [DOI] [PMC free article] [PubMed] [Google Scholar]
- Kanjhan R, Housley GD, Burton LD, Christie DL, Kippenberger A, Thorne PR, Luo L, Ryan AF. Distribution of the P2X2 receptor subunit of the ATP-gated ion channels in the rat central nervous system. J Comp Neurol. 1999;407:11–32. [PubMed] [Google Scholar]
- Kawate T, Michel JC, Birdsong WT, Gouaux E. Crystal structure of the ATP-gated P2X4 ion channel in the closed state. Nature. 2009;460:592–598. doi: 10.1038/nature08198. [DOI] [PMC free article] [PubMed] [Google Scholar]
- Khakh BS. Molecular physiology of P2X receptors and ATP signalling at synapses. Nat Rev Neurosci. 2001;2:165–174. doi: 10.1038/35058521. [DOI] [PubMed] [Google Scholar]
- Khakh BS, Egan TM. Contribution of transmembrane regions to ATP-gated P2X2 channel permeability dynamics. J Biol Chem. 2005;280:6118–6129. doi: 10.1074/jbc.M411324200. [DOI] [PubMed] [Google Scholar]
- Khakh BS, Bao XR, Labarca C, Lester HA. Neuronal P2X receptor-transmitter-gated cation channels change their ion selectivity in seconds. Nat Neurosci. 1999;2:322–330. doi: 10.1038/7233. [DOI] [PubMed] [Google Scholar]
- Khakh BS, Zhou X, Sydes J, Galligan JJ, Lester HA. State-dependent cross-inhibition between transmitter-gated cation channels. Nature. 2000;406:405–410. doi: 10.1038/35019066. [DOI] [PubMed] [Google Scholar]
- Khakh BS, Smith WB, Chiu CS, Ju D, Davidson N, Lester HA. Activation-dependent changes in receptor distribution and dendritic morphology in hippocampal neurons expressing P2X2-green fluorescent protein receptors. Proc Natl Acad Sci U S A. 2001a;98:5288–5293. doi: 10.1073/pnas.081089198. [DOI] [PMC free article] [PubMed] [Google Scholar]
- Khakh BS, Burnstock G, Kennedy C, King BF, North RA, Séguéla P, Voigt M, Humphrey PP. International Union of Pharmacology. XXIV. Current status of the nomenclature and properties of P2X receptors and their subunits. Pharmacol Rev. 2001b;53:107–118. [PubMed] [Google Scholar]
- Khakh BS, Gittermann D, Cockayne DA, Jones A. ATP modulation of excitatory synapses onto interneurons. J Neurosci. 2003;23:7426–7437. doi: 10.1523/JNEUROSCI.23-19-07426.2003. [DOI] [PMC free article] [PubMed] [Google Scholar]
- Khakh BS, Fisher JA, Nashmi R, Bowser DN, Lester HA. An angstrom scale interaction between plasma membrane ATP-gated P2X2 and a4b2 nicotinic channels measured with FRET and TIRF microscopy. J Neurosci. 2005;25:6911–6920. doi: 10.1523/JNEUROSCI.0561-05.2005. [DOI] [PMC free article] [PubMed] [Google Scholar]
- Kidd EJ, Grahames CB, Simon J, Michel AD, Barnard EA, Humphrey PP. Localization of P2X purinoceptor transcripts in the rat nervous system. Mol Pharmacol. 1995;48:569–573. [PubMed] [Google Scholar]
- Lalo U, Allsopp RC, Mahaut-Smith MP, Evans RJ. P2X1 receptor mobility and trafficking; regulation by receptor insertion and activation. J Neurochem. 2010;113:1177–1187. doi: 10.1111/j.1471-4159.2010.06730.x. [DOI] [PMC free article] [PubMed] [Google Scholar]
- Lin L, Jeanclos EM, Treuil M, Braunewell KH, Gundelfinger ED, Anand R. The calcium sensor protein visinin-like protein-1 modulates the surface expression and agonist sensitivity of the alpha4beta2 nicotinic acetylcholine receptor. J Biol Chem. 2002;277:41872–41878. doi: 10.1074/jbc.M206857200. [DOI] [PubMed] [Google Scholar]
- Lippincott-Schwartz J, Snapp E, Kenworthy A. Studying protein dynamics in living cells. Nat Rev Mol Cell Biol. 2001;2:444–456. doi: 10.1038/35073068. [DOI] [PubMed] [Google Scholar]
- Masin M, Kerschensteiner D, Dümke K, Rubio ME, Soto F. Fe65 interacts with P2X2 subunits at excitatory synapses and modulates receptor function. J Biol Chem. 2006;281:4100–4108. doi: 10.1074/jbc.M507735200. [DOI] [PubMed] [Google Scholar]
- Michalet X. Mean square displacement analysis of single-particle trajectories with localisation error: Brownian motion in an isotropic medium. Phys Rev E. 2010;82 doi: 10.1103/PhysRevE.82.041914. 041914. [DOI] [PMC free article] [PubMed] [Google Scholar]
- Michalet X, Pinaud FF, Bentolila LA, Tsay JM, Doose S, Li JJ, Sundaresan G, Wu AM, Gambhir SS, Weiss S. Quantum dots for live cells, in vivo imaging, and diagnostics. Science. 2005;307:538–544. doi: 10.1126/science.1104274. [DOI] [PMC free article] [PubMed] [Google Scholar]
- Migita K, Haines WR, Voigt MM, Egan TM. Polar residues of the second transmembrane domain influence cation permeability of the ATP-gated P2X2 receptor. J Biol Chem. 2001;276:30934–30941. doi: 10.1074/jbc.M103366200. [DOI] [PubMed] [Google Scholar]
- Murrell-Lagnado RD, Qureshi OS. Assembly and trafficking of P2X purinergic receptors (review) Mol Membr Biol. 2008;25:321–331. doi: 10.1080/09687680802050385. [DOI] [PubMed] [Google Scholar]
- Nakazawa K. ATP-activated current and its interaction with acetylcholine-activated current in rat sympathetic neurons. J Neurosci. 1994;14:740–750. doi: 10.1523/JNEUROSCI.14-02-00740.1994. [DOI] [PMC free article] [PubMed] [Google Scholar]
- North RA. Molecular physiology of P2X receptors. Physiol Rev. 2002;82:1013–1067. doi: 10.1152/physrev.00015.2002. [DOI] [PubMed] [Google Scholar]
- Petrini EM, Lu J, Cognet L, Lounis B, Ehlers MD, Choquet D. Endocytic trafficking and recycling maintain a pool of mobile surface AMPA receptors required for synaptic potentiation. Neuron. 2009;63:92–105. doi: 10.1016/j.neuron.2009.05.025. [DOI] [PMC free article] [PubMed] [Google Scholar]
- Pinaud F, Michalet X, Iyer G, Margeat E, Moore HP, Weiss S. Dynamic partitioning of a glycosyl-phosphatidylinositol-anchored protein in glycosphingolipid-rich microdomains imaged by single-quantum dot tracking. Traffic. 2009;10:691–712. doi: 10.1111/j.1600-0854.2009.00902.x. [DOI] [PMC free article] [PubMed] [Google Scholar]
- Pinaud F, Clarke S, Sittner A, Dahan M. Probing cellular events, one quantum dot at a time. Nat Methods. 2010;7:275–285. doi: 10.1038/nmeth.1444. [DOI] [PubMed] [Google Scholar]
- Qureshi OS, Paramasivam A, Yu JC, Murrell-Lagnado RD. Regulation of P2X4 receptors by lysosomal targeting, glycan protection and exocytosis. J Cell Sci. 2007;120:3838–3849. doi: 10.1242/jcs.010348. [DOI] [PubMed] [Google Scholar]
- Ren J, Galligan JJ. Dynamics of fast synaptic excitation during trains of stimulation in myenteric neurons of guinea-pig ileum. Auton Neurosci. 2005;117:67–78. doi: 10.1016/j.autneu.2004.10.007. [DOI] [PMC free article] [PubMed] [Google Scholar]
- Ren J, Bian X, DeVries M, Schnegelsberg B, Cockayne DA, Ford AP, Galligan JJ. P2X2 subunits contribute to fast synaptic excitation in myenteric neurons of the mouse small intestine. J Physiol. 2003;552:809–821. doi: 10.1113/jphysiol.2003.047944. [DOI] [PMC free article] [PubMed] [Google Scholar]
- Richler E, Chaumont S, Shigetomi E, Sagasti A, Khakh BS. Tracking transmitter-gated P2X cation channel activation in vitro and in vivo. Nat Methods. 2008;5:87–93. doi: 10.1038/nmeth1144. [DOI] [PMC free article] [PubMed] [Google Scholar]
- Royle SJ, Murrell-Lagnado RD. Constitutive cycling: a general mechanism to regulate cell surface proteins. Bioessays. 2003;25:39–46. doi: 10.1002/bies.10200. [DOI] [PubMed] [Google Scholar]
- Royle SJ, Bobanović LK, Murrell-Lagnado RD. Identification of a non-canonical tyrosine-based endocytic motif in an ionotropic receptor. J Biol Chem. 2002;277:35378–35385. doi: 10.1074/jbc.M204844200. [DOI] [PubMed] [Google Scholar]
- Royle SJ, Qureshi OS, Bobanović LK, Evans PR, Owen DJ, Murrell-Lagnado RD. Non-canonical YXXG{Phi} endocytic motifs: recognition by AP2 and preferential utilization in P2X4 receptors. J Cell Sci. 2005;118:3073–3080. doi: 10.1242/jcs.02451. [DOI] [PubMed] [Google Scholar]
- Rubio ME, Soto F. Distinct Localization of P2X receptors at excitatory postsynaptic specializations. J Neurosci. 2001;21:641–653. doi: 10.1523/JNEUROSCI.21-02-00641.2001. [DOI] [PMC free article] [PubMed] [Google Scholar]
- Saffman PG, Delbrück M. Brownian motion in biological membranes. Proc Natl Acad Sci U S A. 1975;72:3111–3113. doi: 10.1073/pnas.72.8.3111. [DOI] [PMC free article] [PubMed] [Google Scholar]
- Saxton MJ. Lateral diffusion in an archipelago. Single-particle diffusion. Biophys J. 1993;64:1766–1780. doi: 10.1016/S0006-3495(93)81548-0. [DOI] [PMC free article] [PubMed] [Google Scholar]
- Saxton MJ, Jacobson K. Single-particle tracking: applications to membrane dynamics. Annu Rev Biophys Biomol Struct. 1997;26:373–399. doi: 10.1146/annurev.biophys.26.1.373. [DOI] [PubMed] [Google Scholar]
- Searl TJ, Redman RS, Silinsky EM. Mutual occlusion of P2X ATP receptors and nicotinic receptors on sympathetic neurons of the guinea-pig. J Physiol. 1998;510:783–791. doi: 10.1111/j.1469-7793.1998.783bj.x. [DOI] [PMC free article] [PubMed] [Google Scholar]
- Shigetomi E, Khakh BS. Measuring near plasma membrane and global intracellular calcium dynamics in astrocytes. J Vis Exp. 2009;26:pii, 1142. doi: 10.3791/1142. [DOI] [PMC free article] [PubMed] [Google Scholar]
- Shrivastava AN, Triller A, Sieghart W, Sarto-Jackson I. Regulation of GABAA receptor dynamics by interaction with purinergic P2X2 receptors. J Biol Chem. 2011;286:14455–14468. doi: 10.1074/jbc.M110.165282. [DOI] [PMC free article] [PubMed] [Google Scholar]
- Stoop R, Thomas S, Rassendren F, Kawashima E, Buell G, Surprenant A, North RA. Contribution of individual subunits to the multimeric P2X2 receptor: estimates based on methanethiosulfonate block at T336C. Mol Pharmacol. 1999;56:973–981. doi: 10.1124/mol.56.5.973. [DOI] [PubMed] [Google Scholar]
- Surprenant A, North RA. Signaling at purinergic P2X receptors. Annu Rev Physiol. 2009;71:333–359. doi: 10.1146/annurev.physiol.70.113006.100630. [DOI] [PubMed] [Google Scholar]
- Surprenant A, Buell G, North RA. P2X receptors bring new structure to ligand-gated ion channels. Trends Neurosci. 1995;18:224–229. doi: 10.1016/0166-2236(95)93907-f. [DOI] [PubMed] [Google Scholar]
- Toulme E, Garcia A, Samways D, Egan TM, Carson MJ, Khakh BS. P2X4 receptors in activated C8–B4 cells of cerebellar microglial origin. J Gen Physiol. 2010;135:333–353. doi: 10.1085/jgp.200910336. [DOI] [PMC free article] [PubMed] [Google Scholar]
- Triller A, Choquet D. New concepts in synaptic biology derived from single-molecule imaging. Neuron. 2008;59:359–374. doi: 10.1016/j.neuron.2008.06.022. [DOI] [PubMed] [Google Scholar]
- Vavra V, Bhattacharya A, Zemkova H. Facilitation of glutamate and GABA release by P2X receptor activation in supraoptic neurons from freshly isolated rat brain slices. Neuroscience. 2011;188:1–12. doi: 10.1016/j.neuroscience.2011.04.067. [DOI] [PubMed] [Google Scholar]
- Virginio C, MacKenzie A, Rassendren FA, North RA, Surprenant A. Pore dilation of neuronal P2X receptor channels. Nat Neurosci. 1999;2:315–321. doi: 10.1038/7225. [DOI] [PubMed] [Google Scholar]
- Vulchanova L, Arvidsson U, Riedl M, Wang J, Buell G, Surprenant A, North RA, Elde R. Differential distribution of two ATP-gated channels (P2X receptors) determined by immunocytochemistry. Proc Natl Acad Sci U S A. 1996;93:8063–8067. doi: 10.1073/pnas.93.15.8063. [DOI] [PMC free article] [PubMed] [Google Scholar]
- Young MT, Fisher JA, Fountain SJ, Ford RC, North RA, Khakh BS. Molecular shape, architecture, and size of P2X4 receptors determined using fluorescence resonance energy transfer and electron microscopy. J Biol Chem. 2008;283:26241–26251. doi: 10.1074/jbc.M804458200. [DOI] [PMC free article] [PubMed] [Google Scholar]
- Zhou X, Galligan JJ. Non-additive interaction between nicotinic cholinergic and P2X purine receptors in guinea-pig enteric neurons in culture. J Physiol. 1998;513:685–697. doi: 10.1111/j.1469-7793.1998.685ba.x. [DOI] [PMC free article] [PubMed] [Google Scholar]
- Zinchuk V, Zinchuk O. Quantitative colocalization analysis of confocal fluorescence microscopy images. Curr Protoc Cell Biol Chapter. 2008;4 doi: 10.1002/0471143030.cb0419s39. Unit 4.19. [DOI] [PubMed] [Google Scholar]