

Abstract
In this paper we present a new pharmacovigilance data mining technique based on the biclustering paradigm, which is designed to identify drug groups that share a common set of adverse events in FDA’s spontaneous reporting system. A taxonomy of biclusters is developed, revealing that a significant number of bone fide adverse drug event (ADE) biclusters are identified. Statistical tests indicate that it is extremely unlikely that the discovered bicluster structures as well as their content arose by chance. Some of the biclusters classified as indeterminate provide support for previously unrecognized and potentially novel ADEs. In addition, we demonstrate the importance of the proposed methodology to several important aspects of pharmacovigilance such as: providing insight into the etiology of ADEs, facilitating the identification of novel ADEs, suggesting methods and rational for aggregating terminologies, highlighting areas of focus, and as a data exploratory tool.
Keywords: Pharmacovigilance, Adverse Drug Events, Biclustering, Clustering, FDA Adverse Event Reporting System
1. Introduction
Despite the methodological rigor of clinical trials, it is generally not possible to identify all safety issues associated with drugs during the pre-marketed research phase. This is primarily due to the fact that the size and subject population, drug use, dose, duration, and concomitant therapies in actual post-marketed reality, cannot be exactly mirrored in a clinical trial1. The impact of ADEs results in significant social costs estimated at several billion dollars annually, and inflicts unnecessary, often fatal, harm to patients2, 3.
Spontaneous reporting systems (SRS) are database resources encompassing voluntary reports of suspected ADEs. The availability of real-world data from SRS provides a rich opportunity to detect novel post-marketed ADEs as they contain populations not well represented in clinical trials. Among the major SRS is the United States Food and Drug Administration’s (FDA) Adverse Event Reporting System (AERS)4.
Present day SRS typically receive tens of thousands of reports each year, amounting to millions of reports in each SRS. Challenged by the vast size and complexity of the SRS, the traditional manual case-by-case review approach has been complemented by more efficient methods consisting of automated and quantitative approaches that are commonly referred to as data mining algorithms (DMAs). DMAs are generally designed to identify statistical associations between drugs and adverse events (AEs). These statistical associations, also referred to as signals, are not necessarily true ADEs but rather hypotheses that warrant further investigation to qualify them as credible ADEs. They allow evaluators to peruse the large volume of reports and focus their attention on potentially important safety issues, while avoiding as much as possible false alerts and missed signals.
Over the years, a wide range of DMAs have been developed to screen potential ADEs5–7. Most DMAs rely on the use of disproportionality measures, which attempt to quantify the degree of “unexpectedness” of a drug-AE association8. Typically, a pre-defined disproportionality threshold will be used to screen potential ADEs for further review. The Gamma Poisson Shrinker (GPS)9 used in this work, is a DMA endorsed by the FDA10, that attempts to account for the uncertainty in a disproportionality measure associated with small samples. Due to the voluntary nature of reporting DMAs are primarily limited by data quality issues of the SRS1, 8, 11, such as duplicity of reporting, missing data, typographical errors, accuracy of reporting, granularity and variation in the terminology used, underreporting, and media influences.
Most DMAs in current use focus on the detection of potential ADEs consisting of one drug and one AE only in isolation of other ADEs, and to the best of our knowledge no studies have considered the type of drug-AE clustering proposed in this paper. Recent work by Bate et al., suggests that “a single drug-AE combination should not be considered in isolation, but combinations of other AEs with that drug (especially similar terms) and other drugs (especially from the same therapeutic group) with the same AE should be considered”8. The clustering approach presented in this paper provides a structured approach for identifying and describing ADEs and their relationship to other ADEs and drug families. Examining the similarity of drugs and AEs within a cluster should provide valuable insight into the etiology of ADEs, help validate empirical evidence for AEs, and assist in the identification of novel ADEs. Additionally, drug classes identified by clustering can be used to predict potential ADEs for new drugs with similar active ingredients or molecular structure by their affiliation to known drug classes, an advantage recognized in a recent study by Fliri et al.12.
Although acknowledged by the FDA13, the importance of data exploratory analysis and visualization in the context of pharmacovigilance is often undervalued and overlooked. In the same paper, the FDA suggests that one of the goals should be “to both describe the database in a big picture manner and to be able to proceed from this big picture down to the particulars … that would facilitate medical understanding and insight into drug-event associations in the database”. The proposed clustering approach provides a natural way to explore and visualize the large space, complex structure, and content of SRS. Additionally, clustering can be used to detect data anomalies and highlight other data quality issues existing in SRS.
Since SRS heavily rely on drug naming and AE terminology, the success of DMAs may depend on the grouping of similar drugs that appear under different names, and AEs that are pathophysiologically related14. Bate et al.8 propose that “terminology and clustering of related terms is crucial in signal detection, so better methods of clustering are required”. The proposed clustering approach has the ability to automatically suggest grouping of potentially similar terms, which may increase the signal strength of ADE associations that would otherwise go undetected.
Biclustering is a relatively new clustering technique designed to identify clusters in sparse high-dimensional data sets by simultaneously clustering both observations (drugs) and variables (AEs)15, 16. Typical SRS contain thousands of drugs and thousands of AEs, thus creating a clustering space of several thousand dimensions that appears to be well-suited for the application of biclustering. In this context, a bicluster is defined as a small set of drugs, each of which is associated with the same small set of AEs (Figure 1).
Figure 1.
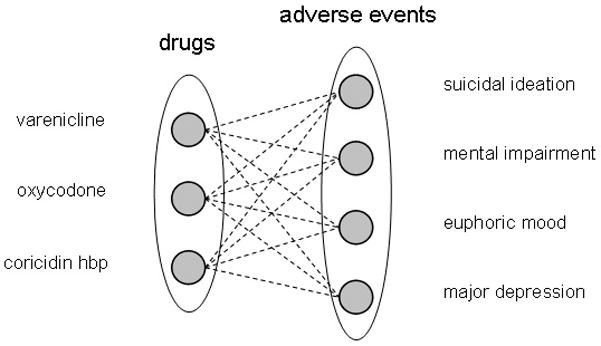
An ADE bicluster can be visualized as a complete bipartite graph where the left set of nodes correspond to drugs and the right set of nodes to adverse events. An edge represents a statistical association between a drug and an adverse event. By definition each drug must be associated with each adverse event in the bicluster, hence a complete graph. In this example the drugs varenicline, oxycodone, and coricidinhbp were all found to be statistically associated with the adverse events suicidal ideation, mental impairment, euphoric mood, major depression.
The objective of this paper is to describe a novel pharmacovigilance data mining technique designed to identify drug groups that share a common set of AEs, with which potential ADEs are analyzed, and previously unrecognized ADEs may be identified. The method is based on the biclustering paradigm, and is applied to individual reports from FDA’s AERS 2008. The overall mining process consists of six steps depicted in Figure 2. (1) to reduce drug naming redundancy and strengthen the signal, drug names are mapped to their corresponding generic names. (2) to reduce the number of spurious associations, duplicate reports are identified and removed. (3) to mitigate confounding, stratification by age, gender, and year is performed. (4) to obtain ADE association strengths, disproportionality analysis using the GPS approach is performed. (5) based on the association strengths computed in the previous step, biclustering of drugs and AEs is performed, and (6) a qualitative and quantitative evaluation of clustering results is undertaken. In contrast to current approaches, a set of study drugs or ADEs is not selected prior to mining, but rather our approach is to allow all the data to participate in the mining without any restrictions or prior assumptions.
Figure 2.
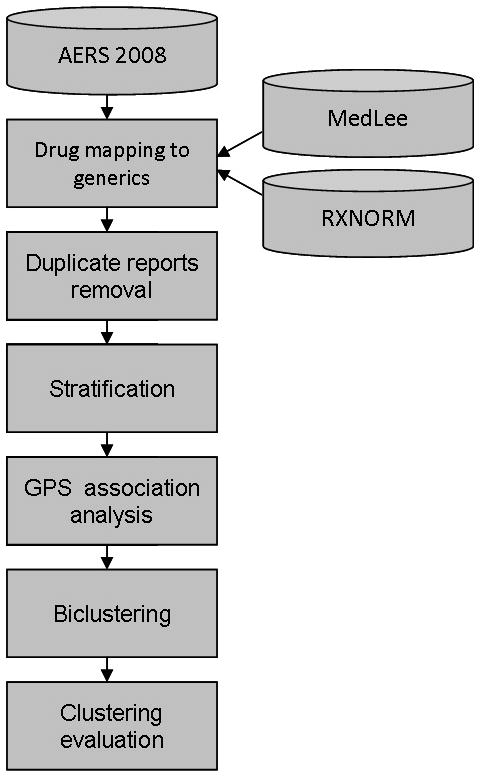
Data analysis and clustering process.
2. Results
Data collection and statistics
The overall data collection process of reports from AERS 2008 resulted in 441,009 individual reports, 65,975 unique drugs, and 10,886 unique AEs. Approximately 66% of the original set of unique drugs were recognized and mapped to generics, reducing the number of unique drugs to 28,341. The number of duplicate reports identified was 22,420.
Association statistics
The GPS EBGM measure of association was computed for 328,574 drug-AE combinations that had an incidence rate >0. Thus, of 308,520,126 (28,341 drugs × 10,886 AEs) possible drug-AE combinations, over 99% of the cells in the data matrix were empty. The mean and median of the EBGM measures were 12.9 and 3.2 respectively, slightly larger than reported in similar studies9, but can be expected since only drugs that were reported as primary suspect were used7.
The association strength threshold used to qualify “strong” and worthy associations was set equal to 5, which resulted in a set of 730 drugs and 1695 AEs participating in the clustering.
Bicluster statistics
Based on the above threshold, biclustering identified a total 3,866 biclusters, involving 467 different drugs and 1025 different AEs. The largest biclusters included a maximum of 17 drugs (cancer related) and a maximum of 57 AEs (bone disorder related). Approximately 33% of the biclusters were cancer related, i.e., drugs given to treat certain types of cancer and AEs commonly associated with cancer treatments. Accordingly, the most frequent drug Clofarabine, used to treat leukemia, was found in 1015 biclusters, and the most frequent AE Febrile Neutropenia (fever due to decreased count of Neutrophils), a leading side effect of chemotherapy and radiation, was found in 647 biclusters. Biclusters related to mental disorders accounted for approximately 5% of the total number of biclusters. Other frequently occurring types of biclusters, accounting for roughly 1% of the total number of biclusters were: Statins (cholesterol level lowering), HIV related, and diabetes related.
Taxonomy of biclusters
Analysis of the biclusters revealed several patterns, which were used to develop a taxonomy that characterizes the full set of biclusters. Based on an evaluation sample of 100 biclusters we approximated the proportions of each category in the taxonomy. The taxonomy along with the corresponding proportions and representative examples is shown in Table 1. Each bicluster is described by three elements: drugs (DR), adverse events (AE), and their relationship (R). DR-I characterizes drug sets in a bicluster consisting of the same (brand name and generic name) or similar drugs (same class or same active ingredients). DR-II characterizes drugs of different classes prescribed for the same indication, and DR-III drugs prescribed for different indications. Adverse events were categorized in a similar manner. AE-I characterizes clustered events which are identical or similar, AE-II events which are different but correspond to the same syndrome, and AE-III events representing completely different syndromes. The relationship between the drugs and AEs in a bicluster are classified as either R-I characterizing known associations where each drug-AE combination in the bicluster is a known, well established ADE, or R-II characterizing indeterminate associations where reported support for at least one of the drug-AE combinations is either non-existent or very sparse, or R-III characterizing confounded associations where AEs were signs or symptoms of the conditions for which the drug was prescribed (indications). Table 2 provides representative examples of biclusters classified according to the taxonomy, along with their average EBGM scores.
Table 1.
Taxonomy of Biclusters
| DRUGS | |
|---|---|
| DR-I: same or similar (class) active agents 1% |
alendronate, ibandronate, risedronate, pamidronate These are all bisphosphonates |
| phenytoin sodium, phenytoin Both phenytoin sodium and phenytoin share the same active ingredient. | |
| DR-II: dissimilar active agents, same indications 36% |
risperidone, olanzapine, haloperidol These are all drugs used to treat schizophrenia. |
| gemtuzumab, melphalan, clofarabine These are anti-neoplastic agents used as chemotherapy agents. | |
| DR-III: dissimilar active agents, dissimilar indications 63% |
telithromycin, bosentan, sertraline_hydrochloride These are drugs used to treat three different conditions. Telithromycin is an antibiotic used to treat community acquired pneumonia. Bosentan is commonly used to treat pulmonary hypertension. Sertraline is used to treat depression. |
| ADVERSE EVENTS | |
| AE-I: same or similar adverse events 3% |
Intentional drug misuse, drug dependence, dependence These adverse events are commonly reported with classes of drugs that can be intentionally misused as drugs of abuse. |
| AE-II: dissimilar adverse events, same syndrome 49% |
anxiety, tremor, panic reaction These characterize the symptoms of a panic attack in patients with panic disorder. |
| neutropenia, pancytopenia, febrile neutropenia, anaemia, thrombocytopenia These adverse events are all related to bone marrow failure | |
| AE-III: dissimilar adverse events, different syndrome 48% |
Enterococcal infection, atelectasis, culture urine positive While an enterococcal infection can commonly cause a urinary tract infection and a positive urine culture, atelectasis of the lungs is unrelated. |
| CLUSTERED RELATIONSHIP | |
| R-I: Known association between drugs and AEs 46% |
drugs: leflunomide, telithromycin, bosentan, terbinafine, amphotericin b AEs: gamma-glutamyltransferase increased, blood bilirubin increased, liver disorder, aspartate aminotransferase increased, alanine aminotransferase increased, blood alkaline phosphatase increased All of the above drugs have some association with hepatotoxicity, which can cause one or more of the aforementioned adverse events, all of which were characterized as part of the same syndrome. |
| R-II: Indeterminate association 41% |
drugs: nevirapine, efavirenz, zidovudine AEs: drug resistance, abortion induced, immune reconstitution syndrome, hepatotoxicity, abortion spontaneous While the drugs above are all treatment options for HIV positive patients, not all of the adverse events are associated with the drugs. Drug resistance and immune reconstitution syndrome are well established adverse events of antiretroviral therapy. However, only efavirenz has clear evidence of danger to the fetus in pregnant women. None of the drugs are used as abortifacients. |
| R-III: Confounding 13% |
drugs: erlotinib, capecitabine, pamidronate, zoledronic acid AEs: metastases to lung, metastases to bone, metastases to central nervous system The adverse events are all representative of already existing cancer states and all the drugs described in this group are used to treat varying types of cancer which can produce metastases to lung, bone, and the central nervous system. |
Table 2.
Classified Bicluster Examples
| Taxonomy | Bicluster Example | EBGM |
|---|---|---|
| DR-I/AE-II/R-I |
drugs: valproic acid, sodium valproate, valproate AEs: epilepsy, dysmorphism, speech disorder developmental, congenital nose malformation, foetal anticonvulsant syndrome Valproic acid aka sodium valproate, valproate, and Depakote, is used for seizure disorders in patients with epilepsy. The remainder of the adverse events refer to its potential for teratogenicity. It is listed as a category D drug for use in pregnant women by the FDA; it is highly associated with congenital malformations, including facial deformations and neural tube defects. While developmental speech disorder is not specifically listed among the adverse events of valproic acid, it is highly plausible that any number of congenital malformations can result in speech disorders. Lastly, there is evidence that a withdrawal syndrome termed fetal anticonvulsant syndrome exists for babies exposed to valproic acid in utero. |
128 |
| DR-III/AE-III/R-II |
drugs: lochol, entacapone, terbinafine, adefovir AEs: hepatic function abnormal, blood creatine phosphokinase increased, alanine aminotransferase increased Lochol is a trade name for cholesterol drugs used outside the US, where the different ingredients may vary. Commonly a statin drug is used as a main ingredient but the specifics differ from country to country. Entacapone is a drug used for Parkinson’s disease that acts by inhibiting an enzyme in the liver and kidney responsible for catalyzing levodopa. Terbinafine is an antifungal drug used in both oral and topical forms. Adefovir is used in chronic Hepatitis B. The adverse events could not be grouped together as creatine phosphokinase is not associated with abnormal hepatic function, though it, like hepatotoxicity, is a rare side effect of statin usage. Terbinafine and adefovir are associated with increased liver enzymes but have no association with muscle damage or elevated creatine phosphokinase. It is plausible entacapone could be associated with liver damage as its major target of inhibition is an enzyme in the liver but it is unassociated with elevated creatine phosphokinase. With the knowledge available to us, this grouping sounds implausible. |
15 |
| DR-II/AE-II/R-III |
drugs: estradiol, pamidronate, zoledronic acid AEs: nuclear magnetic resonance imaging abnormal, radiotherapy, biopsy, physical disability All three drugs are indicated for use with bony metastases from metastatic cancers. Estradiol is primarily indicated for use in metastatic prostate and breast cancer, both of which can cause bony lesions. Pamidronate and zoledronic acid can be used for either bony metastates or primary bone cancers. All the above adverse events are confounders—bone lesions can be associated with abnormal MRIs, radiotherapy, biopsies, and some sort of physical disability. |
76 |
| DR-III/AE-II/R-I |
drugs: varenicline, sodium oxybate, ambient cr AEs: abnormal dreams, somnambulism, abnormal behaviour Varenicline, more commonly known as Chantix, is prescribed as an aid for smoking cessation. Sodium oxybate is prescribed for narcolepsy. Ambien is prescribed for insomnia. All of the categorized drugs can cause sleeping disorders and behavioral changes as adverse events. |
35 |
| DR-III/AE-II/R-II |
drugs: cyclosporine, telithromycin, carbamazepine, azathioprine AEs: blood lactate dehydrogenase increased, lymphadenopathy, splenomegaly The drugs are in different categories. Cyclosporine is an immunosuppressant given after transplants. Telithromycin is an antibiotic given for community acquired pneumonia. Carbamazepine is an anti-convulsant. Azathioprine is an immunosuppressant given after renal transplant but also used for a wide variety of immune system disorders. The adverse events were characterized together as signs of a particular type of immune hemolytic anemia which is heretofore unassociated with any of the categorized drugs. Because both cyclosporine and azathioprine are immunomodulators, it is plausible that this collection of adverse events could represent a new side effect profile based upon the drugs’ action on the immune system. Nonetheless, it is more difficult to find a plausible reason for telithromycin and carbamazepine to cause hemolytic anemia, but it is certainly possible. |
17 |
Statistical tests
The expected number and probability for the occurrence of a random bicluster was 0.05 (less than one expected bicluster) and 1.1e-18 respectively, demonstrating that it is extremely unlikely that the bicluster structure found in the data is random. The p-value obtained for the hypothesis test that a known ADE bicluster would have arisen just by chance was extremely small (less than 1e-100), exceeding the precision limits of our computing environment.
3. Discussion
Overall, the results demonstrate that a significant number (46%) of bone fide biclusters, which relate common ADEs by grouping similar drugs with a common set of known and often similar AEs, were identified by our method. The two test statistics indicate that it is extremely unlikely that the bicluster structure, as well as its content, occurred by chance. A large proportion (41%) of the clustered relationships was classified as indeterminate due to one or more drug-AE pairs in the cluster being an indeterminate ADE. However, this suggests further investigation, and does not necessarily indicate that the unrecognized ADE association is incorrect. In fact, one of the goals of clustering is to provide insight into the etiology of ADEs for those cases where unrecognized and potentially novel ADEs are highlighted by their affiliation to a set of known ADEs in a cluster. For example, a cluster classified as indeterminate (R-II) linked the following drugs to measures of liver toxicity: leflunomide, telithromycin, bosentan, chlorpromazine, entacapone, lapatinib, gemtuzumab, letrozole, terbinafine, arsenic trioxide, fluvoxamine, amphotericin b, carbamazepine, micafungin, clofarabine, deferasirox, miglitol. Of those drugs, only some have well-established links to hepatic dysfunction. For the remainder, there is less definitive support linking them to liver dysfunction, but reports do exist in the medical literature. For instance, chlorpromazine does not have hepatotoxicity listed as an AE in the drug database Micromedex, but older case reports describe a syndrome known as “chlorpromazine hepatic hypersensitivity” with concomitant biochemical alterations of liver function tests17. Likewise, the antidepressant fluvoxamine has no established effect on the liver, but a recent case report describes a patient with abnormal liver function tests found to have tissue damage on liver biopsy thought to be due to fluvoxamine18. Other examples with which potentially novel ADEs are identified, such as the drug-event pairs: chlorpromazine - hepatotoxicity, fluvoxamine - liver toxicity, mirtazapine - inappropriate antidiuretic hormone secretion, bevacizumab - reversible posterior leukoencephalopathy syndrome, methotrexate - pancytopenia, vorinostat - atelectasis, bosentan - hepatic steatosis, busulfan – hyperkalemia, are discussed in Supplementary Material 1.
The results also suggest that the proposed methodology is useful in several other aspects of pharmacovigilance. First, clustering provides a rationale for aggregating various preparations of the same drugs in order to focus on the active agent. This is demonstrated in drug clusters which represent either various forms of the same drug phenytoin, phenytoin sodium or generic or brand preparations proventil hfa, albuterol. These synonymous but unique terms consistently clustered to the same or similar AEs. Hence, mapping drugs to the “active ingredient” should increase the signal, maximizing the potential for identifying rare events. This type of mapping is already possible using RXNORM19, but which is not entirely complete.
Clustering also provides a rational for aggregating individual AEs into syndromes. For example, initial insomnia, nightmare, abnormal dreams are all manifestations of “disordered sleep.” Mapping each of these manifestations to a common parent term such as “disordered sleep,” should in principle increase the strength of a potential drug-AE association.
Clustering drugs and AEs may also provide information about whether the AE associated with a particular agent is likely unique to that particular agent or rather a class effect. When an agent is shown to cause an AE and is the first in its class, it is not initially known if the effect is unique to that drug or is a class effect. We found numerous situations where many members of the same drug class were associated with particular AEs, suggesting the potential for any member of a class to cause a given AE. For example, the bisphosphonate drugs alendronate, alendronate sodium, pamidronate were all paired with the AEs impaired healing, femur fracture, pain in jaw. The AE impaired healing is non-specific but most likely means healing after a fracture, which is a common side effect for bisphosphnates. Femur fractures and aseptic necrosis of the jaw (causing pain in jaw) are also more likely in alendronate and pamidronate. The way in which these symptoms clustered to the class of bisphosphonates makes it likely that these effects are class-specific. Not surprisingly, both risedronate and ibandronate, also biphosphonates, can cause this similar side effect profile.
Clustering also highlights areas in the data that should be focused on in order to enhance detection of novel ADEs. For example, we observed that a large proportion (roughly 40%) of the biclusters identified were related to cancer or mental disorders. This outcome was not surprising and resulted in numerous associations of AEs which are common and known. A plausible explanation for this dominance is that a large proportion of clinical trials are actively testing new cancer and psychiatric drugs, and many of the reports submitted to AERS are typically by pharmaceutical companies reporting safety issues identified during the trials. Hence, removing these biclusters containing ADEs that are common and known would provide an opportunity for enhanced targeting of novel ADEs associated with other disorders and their related therapies.
In summary, the findings demonstrate the importance and utility of this biclustering methodology for several important aspects of parmcovigilance noted in several prominent studies. Biclustering provides insight into the etiology of known ADEs, and facilitates the identification of novel ADEs. Biclustering suggests methods and provides rational for aggregating terminologies used to describe ADEs. Biclustering can be used to identify AEs of drug classes. Biclustering highlights areas of focus and an opportunity for enhanced targeting of novel ADEs. Finally, biclustering provides a data exploratory tool in pharmacovigilance with which the underlying large and complex database can be summarized and described in a big picture manner, capturing important patterns as well as highlighting data quality issues, which can then be used to improve the signal detection process. We note that the proposed approach is fundamentally different than existing approaches and as such a direct comparison with existing methods is not possible. In addition, no claim is made that the proposed approach is able to identify ADEs that existing approaches cannot identify. In fact, since the method is based on an existing DMA (GPS) as a step prior to clustering, the same drug-AE associations will be reported.
4. Data Sources and Methods
Data Sources
The data used in this analysis included the latest full-year set of individual AERS reports available, published in the year 2008, and which offers the opportunity to examine newer ADEs. Of all the drugs and AEs appearing in the reports we selected only those drugs that were reported as “primary suspect”, and AEs that appeared in reports categorized as having a “serious” patient outcome. Demographic information including gender and age, necessary for stratification, was extracted from AERS and linked to each report. Additionally, we limited our analysis to drug-AE combinations that appeared at least 3 times.
The following provides a brief discussion of each of the steps depicted in Figure 2.
Drug name mapping
Unlike the suspected AEs and the indications, which are coded using the MedDRA terminology, drugs are entered as textual terms. Each drug obtained from a report was mapped to a UMLS19 drug code using MedLEE20, an existing NLP system. If the drug name included a dose or route, e.g. “Avandia (2 milligram) tablets”, the more general UMLS code consisting of the drug name only was chosen over the more specific code, e.g., C0875967 corresponding to “Avandia”. If the drug name could not be mapped, it was left as is. Finally, UMLS codes were mapped to generics using RXNORM19. Hence, C0875967 corresponding to the brand name Avandia, would be mapped to C0289313 corresponding to the generic name “Rosiglitazone”.
Duplicate reporting
It is suggested that between 5%–20% of the total number of reports submitted to AERS are duplicates 21, 22, hence one can expect thousands of duplicates to exist in AERS, and therefore thousands of spurious associations to be generated. While the FDA uses a proprietary algorithm, our method for identifying duplicate reports is based on searching through reports that contain at least 8 drugs/AEs, for pairs of reports that have an exact match of the reported drugs, AEs, and demographic data (age, gender, weight, and dates). The requirement for a match based on a set of at least 8 drugs/AEs minimizes the probability of a match by chance. Nonetheless, many potential duplicates do not demonstrate an exact match, mostly due to missing data or follow-ups which add or remove a small number of drugs/AEs. However, identifying these types of duplicates with high accuracy is a much harder task and beyond the scope of this study. We note that a possible solution has been proposed by Noren et al21, but their method was fit to the World Health Organization SRS23 and it is not clear how well it will generalize to AERS.
Stratification
The variables used for stratification included age, gender, and calendar year. The age variable was partitioned into four strata: pediatric (ages 0–15), young adults (ages 15–45), middle age (ages 45–70), and geriatric (ages 70 and above). Missing stratum data resulted in an extra NA stratum for each of the stratification variables, and an overall number of strata equal to 15 (5 age × 3 gender × 1 calendar year).
Disproportionality analysis using GPS
In order to perform clustering it was first necessary to identify all drugs–AE pairs that are strongly associated. Of those that are strongly associated the clustering will then group drugs that are strongly associated with a common set of AEs. To compute drug-AE association strengths we used the GPS method, which was implemented exactly as described in the original paper9.
Biclustering
The clustering data matrix consisted of m rows each representing a different drug, and n columns each representing a different AE, where each cell in the matrix initially contained GPS’ EBGM association strength value corresponding to the i-th drug and the j-th AE. This matrix was then transformed into a binary data matrix, where each cell contained either a 1 or 0, representing the states of “strongly associated” or “weakly associated” respectively. The transformation was performed by selecting an “association strength threshold”, and reflects the fundamental idea that drugs and AEs are either associated due to a causal relationship or not, and that in reality discovering this type of relationship is the ultimate goal. Moreover, clustering based on association strengths would have painted a completely different picture, not aligned with our goals. For example, drug-AE pairs that are associated only by chance, or even not associated at all, would have been clustered together since they share a common low association strength value.
Binary inclusion-maximal biclustering (Bimax)24 used in work, is one of the several biclustering algorithms included in Biclustering Analysis Toolbox25, which is a software platform for biclustering data analysis and visualization. Bimax assumes a binary data model, in which each entry in the data matrix either is 1 or 0, making it consistent with our clustering model. Bimax is designed to find maximal submatrices of the data matrix in which all elements have a value equal to 1. Translating to our problem, Bimax is able to find the largest clusters, such that each is made of a subset of drugs that are all strongly associated with the same subset of AEs. One of the main advantages of Bimax is that in contrast to most clustering algorithms, it is an exact algorithm able to find all of the biclusters that exist in the data. Supplementary Material 2 provides a more detailed discussion of biclustering.
Bimax requires the user to pre-specify two parameters – the minimum number of drugs and minimum number of AEs needed to define a bicluster. We selected 3 as the minimum for both drugs and AEs, as we felt that anything less would have produced a very large number of uninteresting small clusters. Figure 3 shows a sample of ADE biclusters produced by Bimax displayed in a binary heatmap.
Figure 3.
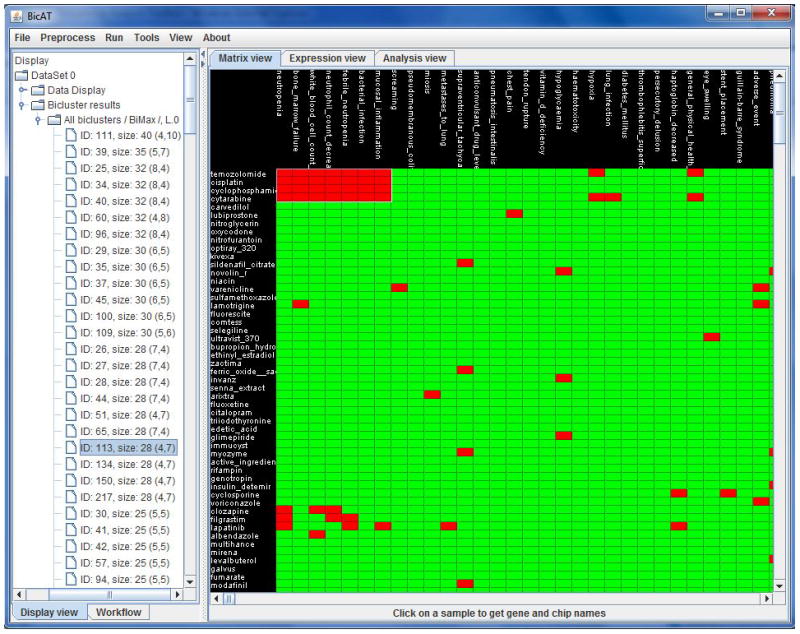
Graphical display of Bimax clustering results. The right pane displays a binary heatmap annotated with drugs along the left side and AEs along the top. Red cells in the heatmap indicate that a drug and AE are strongly associated, green indicates that they are weakly or not associated. After clustering the heatmap is rearranged to display a cluster (selected from the left pane) in the upper left corner of the map. This example shows a cluster of 4 cancer related drugs and their 7 common associated AEs. The left pane displays the loaded data matrix, analysis steps, and a clustering summary sorted according to cluster size.
Evaluation
Validation of clustering results is generally a hard task in the absence of a gold standard, which is typically the case. In the context of pharmacovigilance, the problem is exacerbated, since the evaluation of even a single drug-AE association, not to mention a set of associations which make up a cluster, is difficult due a lack of gold standard (set of all true ADEs is unknown). As a result, evaluation in terms of sensitivity and specificity is usually not possible, unless a small set of study ADEs is selected prior to mining, which is not the case here. One of the more common methods of evaluation in pharmacovigilance is by human experts5, 7. Following this practice, the full set of biclusters identified by our approach were ranked according to the average EBGM measure between each drug-AE pair in a bicluster, and a random sample of 100 biclusters (from the full range of average EBGM measures) was given to two clinical experts for manual review and qualitative evaluation. Known ADEs were validated by the experts using Micromedex26, which is considered a reliable and trusted reference for medications and their associated ADEs.
In addition, two statistical tests were conducted to demonstrate that (1) it is extremely unlikely that the bicluster structure arose in our data just by chance, and (2) it is extremely unlikely that a known ADE bicluster arose just by chance. As a limiting case, 3×3 biclusters (smallest size) were considered. To show (1) a standard graph theoretic approach was used to compute the expected number and probability of random 3×3 complete bipartite graphs given the sparsity of our data (probability of an association/edge). To show (2) a hypothesis test was conducted by creating a set of 100 random 3×3 biclusters sampled from AERS’ drug and AE distributions, and by comparing the number of known biclusters (R-I) identified in the random set with the number of known biclusters identified by our method. The p-value in this test is the probability of observing as large (or larger) difference between the proportion of known biclusters identified by the method and the proportion of known biclusters identified in the randomly generated set, given the (null) hypothesis of no difference between the two proportions. Supplementary Material 3 provides a more technical description of the two tests.
Supplementary Material
Acknowledgments
This research was supported in part by grants 1R01LM010016, 3R01LM010016-01S1, 3R01LM010016-02S1 and R01LM006910, from the National Library of Medicine. We thank Dowman Varn for his useful comments, and Lyudmila Shagina and Jianhua Li for their assistance extracting and preprocessing the data.
Reference List
- 1.Almenoff JS, Pattishall EN, Gibbs TG, DuMouchel W, Evans SJ, Yuen N. Novel statistical tools for monitoring the safety of marketed drugs. Clin Pharmacol Ther. 2007 August;82(2):157–66. doi: 10.1038/sj.clpt.6100258. [DOI] [PubMed] [Google Scholar]
- 2.Bates DW, Spell N, Cullen DJ, et al. The costs of adverse drug events in hospitalized patients. Adverse Drug Events Prevention Study Group. JAMA. 1997 January 22;277(4):307–11. [PubMed] [Google Scholar]
- 3.Classen DC, Pestotnik SL, Evans RS, Lloyd JF, Burke JP. Adverse drug events in hospitalized patients. Excess length of stay, extra costs, and attributable mortality. JAMA. 1997 January 22;277(4):301–6. [PubMed] [Google Scholar]
- 4.Adverse Event Reporting System. http://www.fda.gov/cder/aers/default.htm.
- 5.Hauben M, Madigan D, Gerrits CM, Walsh L, van Puijenbroek EP. The role of data mining in pharmacovigilance. Expert Opin Drug Saf. 2005 September;4(5):929–48. doi: 10.1517/14740338.4.5.929. [DOI] [PubMed] [Google Scholar]
- 6.Wilson AM, Thabane L, Holbrook A. Application of data mining techniques in pharmacovigilance. Br J Clin Pharmacol. 2004 February;57(2):127–34. doi: 10.1046/j.1365-2125.2003.01968.x. [DOI] [PMC free article] [PubMed] [Google Scholar]
- 7.Almenoff J, Tonning JM, Gould AL, et al. Perspectives on the use of data mining in pharmaco-vigilance. Drug Saf. 2005;28(11):981–1007. doi: 10.2165/00002018-200528110-00002. [DOI] [PubMed] [Google Scholar]
- 8.Bate A, Evans SJ. Quantitative signal detection using spontaneous ADR reporting. Pharmacoepidemiol Drug Saf. 2009 June;18(6):427–36. doi: 10.1002/pds.1742. [DOI] [PubMed] [Google Scholar]
- 9.DuMouchel W. Bayesian data mining in large frequency tables, with an application to the FDA Spontaneous Reporting System. Am Stat. 1999;53(3):177–90. [Google Scholar]
- 10.Szarfman A, Machado SG, O’Neill RT. Use of screening algorithms and computer systems to efficiently signal higher-than-expected combinations of drugs and events in the US FDA’s spontaneous reports database. Drug Saf. 2002;25(6):381–92. doi: 10.2165/00002018-200225060-00001. [DOI] [PubMed] [Google Scholar]
- 11.Stephenson W, Hauben M. Data mining for signals in spontaneous reporting databases: proceed with caution. Pharmacoepidemiol Drug Saf. 2007;16(4):359–65. doi: 10.1002/pds.1323. [DOI] [PubMed] [Google Scholar]
- 12.Fliri AF, Loging WT, Thadeio PF, Volkmann RA. Analysis of drug-induced effect patterns to link structure and side effects of medicines. Nature Chemical Biology. 2005 December;1(7):389–97. doi: 10.1038/nchembio747. [DOI] [PubMed] [Google Scholar]
- 13.O’Neill RT, Szarfman A. Data Mining in Large Frequency Tables, with an Application to the FDA Spontaneous Reporting System: Discussion. Am Stat. 1999;53(3):190–6. [Google Scholar]
- 14.Brown EG. Effects of coding dictionary on signal generation: a consideration of use of MedDRA compared with WHO-ART. Drug Saf. 2002;25(6):445–52. doi: 10.2165/00002018-200225060-00009. [DOI] [PubMed] [Google Scholar]
- 15.Kriegel H, Kröger P, Zimek A. Clustering high-dimensional data: A survey on subspace clustering, pattern-based clustering, and correlation clustering. ACM Trans Knowl Discov Data. 2009;3(1):1–58. [Google Scholar]
- 16.Madeira SC, Oliveira AL. Biclustering Algorithms for Biological Data Analysis: A Survey. IEEE/ACM Trans Comput Biol Bioinformatics. 2004;1(1):24–45. doi: 10.1109/TCBB.2004.2. [DOI] [PubMed] [Google Scholar]
- 17.Breuer RI. Chlorpromazine Hepatotoxicity Manifested by A Selective and Sustained Rise of Serum Alkaline Phosphatase Activity - Report of A Case. American Journal of Digestive Diseases. 1965;10(8):727–731. doi: 10.1007/BF02236073. [DOI] [PubMed] [Google Scholar]
- 18.Solomons K, Gooch S, Wong A. Toxicity with selective serotonin reuptake inhibitors. American Journal of Psychiatry. 2005 June;162(6):1225. doi: 10.1176/appi.ajp.162.6.1225. [DOI] [PubMed] [Google Scholar]
- 19.Unified Medical Language System. http://www.nlm.nih.gov/research/umls/rxnorm/
- 20.Friedman C, Shagina L, Lussier Y, Hripcsak G. Automated encoding of clinical documents based on natural language processing. J Am Med Inform Assoc. 2004 September;11(5):392–402. doi: 10.1197/jamia.M1552. [DOI] [PMC free article] [PubMed] [Google Scholar]
- 21.Noren GN, Orre R, Bate A, Edwards IR. Duplicate detection in adverse drug reaction surveillance. Data Mining and Knowledge Discovery. 2007 June;14(3):305–28. [Google Scholar]
- 22.Hauben M, Reich L, DeMicco J, Kim K. ‘Extreme Duplication’ in the US FDA Adverse Events Reporting System Database. Drug Safety. 2007;30(6):551–554. doi: 10.2165/00002018-200730060-00009. [DOI] [PubMed] [Google Scholar]
- 23.The Upsala monitoring centre. http://www.who-umc.org.
- 24.Prelic A, Bleuler S, Zimmermann P, et al. A systematic comparison and evaluation of biclustering methods for gene expression data. Bioinformatics. 2006 May 1;22(9):1122–9. doi: 10.1093/bioinformatics/btl060. [DOI] [PubMed] [Google Scholar]
- 25.Barkow S, Bleuler S, Prelic A, Zimmermann P, Zitzler E. BicAT: a biclustering analysis toolbox. Bioinformatics. 2006 May 15;22(10):1282–3. doi: 10.1093/bioinformatics/btl099. [DOI] [PubMed] [Google Scholar]
- 26.Micromedex® Healthcare Series [Internet database] Greenwood Village, Colo: Thomson Reuters (Healthcare) Inc; 2010. Updated periodically. [Google Scholar]
Associated Data
This section collects any data citations, data availability statements, or supplementary materials included in this article.