Abstract
We performed experiments using Aplysia neurons to identify the mechanism underlying the changes in the firing patterns in response to temperature changes. When the temperature was gradually increased from 11℃ to 31℃ the firing patterns changed sequentially from the silent state to beating, doublets, beating-chaos, bursting-chaos, square-wave bursting, and bursting-oscillation patterns. When the temperature was decreased over the same temperature range, these sequential changes in the firing patterns reappeared in reverse order. To simulate this entire range of spiking patterns we modified nonlinear differential equations that Chay and Lee made using temperature-dependent scaling factors. To refine the equations, we also analyzed the spike pattern changes in the presence of potassium channel blockers. Based on the solutions of these equations and potassium channel blocker experiments, we found that, as temperature increases, the maximum value of the potassium channel relaxation time constant, τn(t) increases, but the maximum value of the probabilities of openings for activation of the potassium channels, n(t) decreases. Accordingly, the voltage-dependent potassium current is likely to play a leading role in the temperature-dependent changes in the firing patterns in Aplysia neurons.
Keywords: Aplysia, Bursting, Doublet, Temperature-dependent scaling factor, Computer simulation
INTRODUCTION
It is well known that the general conclusion from other studies on the temperature dependence of firing patterns of Aplysia neurons was the increase in spike frequency [1,2], an increase in resting membrane potential [1,3], and a decrease in spike-broadening and spike height [4] with increasing temperature. For example, Hakozaki et al. found that temperature-induced hyperpolarization was mediated in Aplysia neurons by the temperature-sensitive and G-protein regulated potassium current as the temperature increased [5]. AP broadening in Aplysia R15 pacemaker neuron resulted from the depolarizing effect of slow voltage-dependent Ca2+ currents and its peak height was decreased by steady activation of a temperature-sensitive K+ current [4]. However, the mechanisms of the firing pattern changes in response to temperature are still unclear. To identify the mechanism of the temperature-induced firing pattern change, we examined the effect of temperature on the firing pattern by using the neurons of Aplysia and developed a computational model to simulate the temperature-dependent changes in the firing patterns.
Aplysia neurons have great advantages for electrophysiological study. In Aplysia, the nervous system is relatively simple and the size of individual neuron is so large that each neuron can be easily identified based on the location in the ganglia. In addition, Aplysia giant neurons are long-lived in vitro and so are apt to stand heat stress for a long time. The neurons in the left caudal quarter-ganglion (LUQ) of the abdominal ganglion of Aplysia fires spontaneously. We found that many of these neurons in the LUQ changed the firing pattern sequentially with temperature from a silent state to beating, beating-chaos, bursting-chaos, square-wave bursting, and finally a bursting-oscillation pattern. When the temperature was decreased over the same temperature range, the above seven patterns reappeared in reverse order.
Based on these experimental results, we wanted to compose equations to simulate all of the seven different spiking patterns. However, we found that these various signal patterns observed between 25℃ and 31℃ were similar to pictures published by Chay [6], and Chay and Lee [7]. Although in these papers various spiking patterns were described by solving nonlinear differential equations such as continuous spiking, doublets, beating-chaos, bursting-chaos, square-wave bursting, and slow-wave, the silent phase and low frequency beating were not described between 11℃ and 25℃ that are observed in our experiments. Furthermore, any temperature-dependent scaling factors were not included in these equations, either. Therefore, simply changing the variables presented in papers by Chay and Lee [6,7] would not be sufficient to simulate these exceptional spiking patterns. Furthermore it was uncertain whether or not the temperature-dependent neurons from the abdominal ganglion of A. juliana could be regarded as warm receptors. Because cold and warm receptors respond to temperature change in one direction only; warm (cold) receptor responds to temperature changes during the rising (falling) phase but do not respond to temperature changes during the falling (rising) phase. Therefore, these neurons are thought to be different from warm receptors. However, the effects of temperature changes on cold or warm receptors have been studied in various species, including cats [8,9], vampire bats and mice [10], snakes [11], rabbit [12], and human [13]. Although mammalian cold receptors are discussed in the Huber-Braun cold receptor model [14,15], it was not even able to find a proper biophysical model for warm receptors.
To set up nonlinear differential equations that can simulate all of these various spiking patterns together, it is necessary to modify the equations derived by Chay and Lee [6,7] with temperature-dependent scaling factors; we will adopt a temperature-dependent scaling factor for the ionic currents and ionic kinetics that are used in the Huber-Braun cold receptor model [14,15]. The cell membrane of this new model contains sodium, calcium, and potassium channels carrying a fast sodium current, INa, fast calcium current, ICa, and a potassium current, IK, respectively. But when channel blockers are used, we can find out how the spiking patterns change. After we focus on finding out the relationships between channel blockers and AP change, we will examine the mechanism of electrophysiological response to temperature change in neural cells in Aplysia.
METHODS
Animals and preparation of the ganglia
Aplysia juliana and Aplysia kurodai were purchased by a local supplier in Jeju-do, South Korea. The species are identified according to the literature [16].
When an Aplysia was to be dissected, 0.38 M MgCl2 were injected for anesthesia. MgCl2, amounting to half weight of the Aplysia, were injected. With dissecting tools, the abdominal ganglia of A. juliana were dissected out and preserved in artificial seawater ASW : L-15 (1 : 1, v/v) as described previously [16]. The abdominal ganglia incubated at 34℃ for about one hour in 1% protease (type IX, sigma) in ASW : L-15. The ganglia treated with protease were washed several times with ASW, and were stored at 18℃ for about five hours. Finally, the ganglion was pinned down on a Sylgard plate dish (50×9 mm) and the sheaths of the ganglia were dissected out under dissecting microscope to expose the neurons on the dorsal side of the abdominal ganglion. The medim was exchanged with L-15/ASW.
Data acquisition
The Sylgard plate containing the ganglion was placed on a small copper plate (50×100 mm) under which two thermoelectric controllers were set up (HMN 3940, Acetec Co., Korea) side by side. One with the hot side was faced down and the other with the cold side was faced down. We installed an automatic temperature controller. The data acquisition (DAQ) card (NI PCI-6221, National Instruments) was connected between the Neuroprove Amplifier (Model 1600, A-M Systems, Carlsborg, WA, USA) and the computer. The membrane potential was recorded intracellularly using the Neuroprove Amplifier with a glass microelectrode filled with 3 M KCl. and was sent to channel 2 of the data acquisition device. For the measurement of the temperature near the recording neurons, the PT100 temperature probe was placed near the Aplysia ganglion. To record the temperature, we used a digital thermometer (TRM-006, Toho, Japan) connected to a PT100 temperature sensor through channel 1 of the DAQ card. The values of temperature and membrane potential were simultaneously saved onto the computer hard disk. We used the computer program previously coded for another experiment. Some parts were modified and reused in this experiment. In data analysis program, various variables were calculated. Most significant variables are the AP amplitude AAP (mV), the membrane potential at the negative peak Vnp (mV), the interspike interval ISI (ms), the AP half-width duration ΔtAP, 1/2 (ms), the interburst interval IBI (ms), and the spontaneous firing frequency Frequency (s-1) [17].
Drug application
Tetraethylammonium chloride (TEA, Sigma: T2265), 4-aminopyridine (4-AP, TCI: A0414) are purchased from Sigma-Aldrich and TCI Co. LTD. By using a pump (BT100-2J, LongerPump, Hebei, China), L-15 : ASW (1 : 1), 10 mM TEA, L-15 : ASW (1 : 1), 10 mM 4-AP, L-15 : ASW (1 : 1), 10 mM TEA mixed with 10 mM 4-AP were pumped in consecutive order at a rate of 1 ml/min for 30 minutes, respectively. This is one cycle. We knew that the concentration of chemical reagents was at maximum within about five minutes before and after each drug treatment, and cells were adapted to it. In these time intervals, cells showed steady results. So, neurosignals were analyzed using the data recorded during these periods.
RESULTS
Experimental data for analysis
To simulate temperature-dependent properties of the APs, we performed experiments using Aplysia neurons. In these experiments, the cells showed a bursting-oscillation pattern at temperatures between 28.8℃ and 32.2℃ and then became silent when the temperature was increased over about 35℃. However, the temperature had to be reduced to prevent the cell from becoming silent after the bursting-oscillation pattern appeared because the silent state at high temperature could influence the activity of APs.
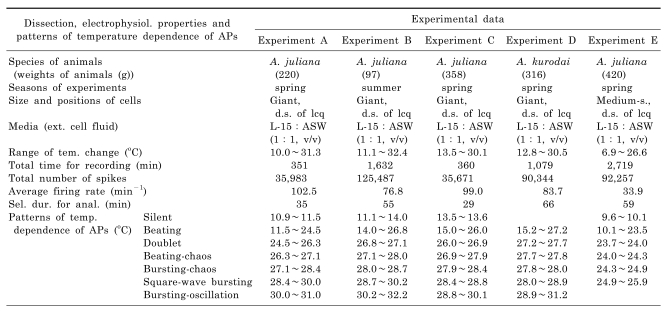
Table 1 shows the conditions of each experiment (Experiment A to E). In these experiments the species A. juliana and A. kurodai were used. Only large cell somata bigger than ~100 micron were selected for recording and these neurons were located at the dorsal surface of the left caudal quarter-ganglion. The temperature was controlled between 6.9℃ and 32.4℃. The total length of time for recording was between 351 and 2,719 min. The total number of spikes recorded from each neuron was from 35,983 to 125,487. The average firing rate was between 33.9 min-1 and 102.5 min-1. The duration of recording sections subjected to data analysis varied from 29 to 66 min. In Table 1, we selected the five datasets of the experiments that showed the following seven spiking patterns sequentially as temperature increased: silent, beating (sinusoidal bursting with a very long burst duration and short interburst intervals (IBI)), doublets, beating-chaos, bursting-chaos, square-wave bursting, and bursting-oscillation. In these experiments when the temperature was decreased over a similar range, the above seven patterns reappeared in reverse order. For each of the five separate experiments the temperature intervals corresponding to each spiking pattern are presented at the bottom of Table 1, suggesting that the firing pattern is likely determined by the instantaneous temperature; there were no data acquired below 15.2℃ in Experiment D (no silent state), and above 25.9℃ in Experiment E (no bursting-oscillation).
Table 1.
Dissection and electrophysiological properties for the experiments A to E and details of the seven different firing patterns observed in the acquired data. Silent, beating (bursting with very long burst duration and short interburst intervals), doublet, beating chaos, bursting chaos, bursting, and bursting oscillation patterns are shown
Ext. cell fluid, external cell fluid; d.s. of lcq, dorsal surface of the left caudal quarter-ganglion; Sel. dur. for anal., selected section duration for analysis; Patterns of temp. dependence of APs, Patterns of temperature dependence of APs.
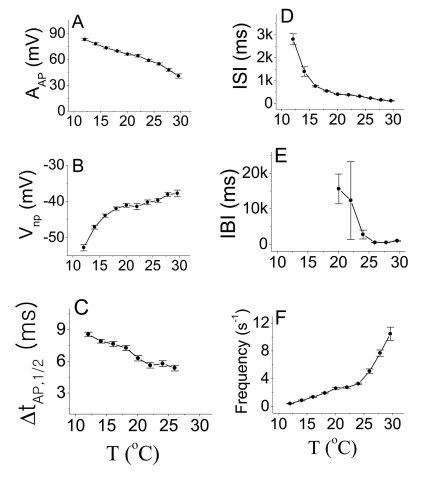
Fig. 1 displays the averaged values of AP parameters as a function of temperature. The IBI has larger errors bars than the other AP parameters. The AAP, ΔtAP, 1/2, and ISI decreased with increasing temperature. The IBI in Fig. 1 E also decreased with increasing temperature; however, the error bars in Fig. 1 E from 20℃ to 24℃ are relatively large because different values of the IBI in the sinusoidal bursting pattern appeared at different temperatures within these temperature ranges. |Vnp| in Fig. 1B and the Frequency in Fig. 1 F increased with increasing temperature. Likewise, the spiking frequencies of warm (cold) receptors increase as the temperature increase (decrease).
Fig. 1.
Average values of six AP parameters with error bars. AAP, ΔtAP, 1/2, ISI, and IBI displayed in panels A, C, D, and E, respectively, decreased as temperature increased. |Vnp| and Frequency displayed in panels B and F, respectively, increased as temperature increased.
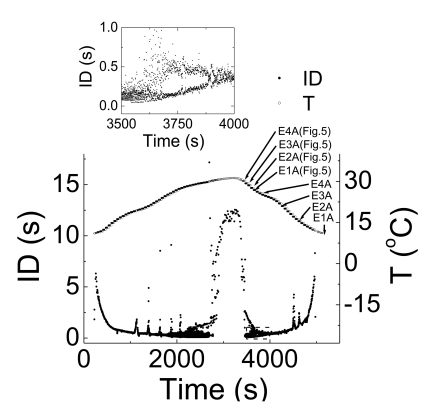
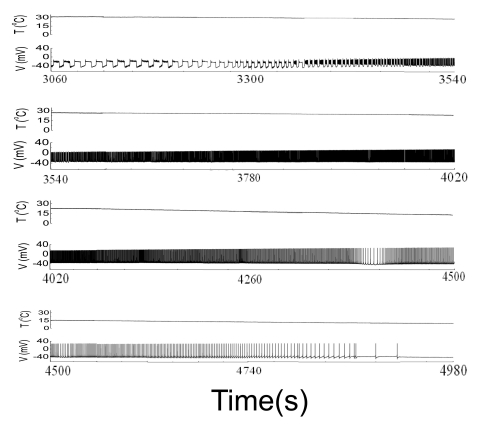
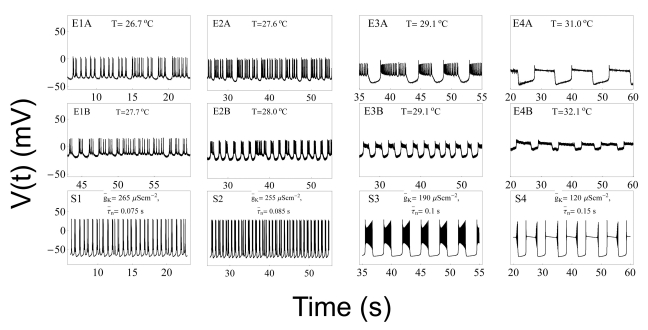
Based on these experimental results, we wanted to compose equations to simulate all of the seven different spiking patterns. In order to do this, we selected experimental data from two of the five experiments, i.e., Experiments A and B. Although the selected data had similar firing patterns, data from Experiment A displayed more stable firing patterns, especially in the doublet, beating-chaos, bursting-chaos, and square-wave bursting patterns. For this reason we chose to use the data from Experiment A to draw multiple graphs corresponding to each spiking pattern. It was also necessary to select a section of the data containing the properties of all of the spiking patterns; for this the 80-minute data which correspond to one temperature cycle was selected from the data of Experiment A. The temperature values and interval duration (ID) of APs are presented as functions of time in Fig. 2. In this figure, it is shown that when the temperature was increased or decreased over the same temperature range, the same spiking patterns reappeared in reverse order. For example, when the temperature was decreased from 31℃ to 11℃, the seven firing patterns of Aplysia neurons changed sequentially: bursting-oscillation, square-wave bursting, bursting-chaos, beating-chaos, doublets, beating, and silent. These spike trains in continuous time series are shown in Fig. 3. The small box at the top of Fig. 2 displays a magnified view of the IDs from 3,500 s to 4,000 s and clearly shows doublets appearing. The symbols "E1A"~"E4A (Fig. 5)" written on the lower big plot correspond to the names of the panels that are displayed in more detail in Fig. 4E1A to Fig. 5E4A, respectively. Several sinusoidal burstings with very long burst duration and short IBI are shown by the sign looked like "∧" in the bottom trace in Fig. 2. Since these signals appeared irregularly, we did not simulate these phenomena.
Fig. 2.
Temperature and ID as a function of time. Data acquired from one temperature cycle in Experiment A are plotted. The near symmetry of the graph is taken to mean that the time-dependence of the data to be analyzed is reproducible. The small upper box displays a magnified view from 3,500 s to 4,000 s. The symbols E1A to E4A (Fig. 5), written in the large bottom box correspond to the time series displayed in each panel in Fig. 4E1A to Fig. 5E4A. Sinusoidal bursting with very long burst duration and short IBI is shown by the sign looked like "∧" in the bottom trace.
Fig. 3.
The upper and lower traces represent temperature and membrane potential, respectively. When the temperature was decreased from 31℃ to 11℃, the seven firing patterns of Aplysia neurons changed sequentially: bursting-oscillation, square-wave bursting, bursting-chaos, beating-chaos, doublets, beating, and silent.
Fig. 5.
Comparison of experimental results with results from computer simulations. Panels E1A~E4A display data from Experiment A. Panels E1B~E4B display data from Experiment B. The relevant temperatures are shown at the top of each box. Panels S1~S4 display values calculated from equations (1) to (4) using parameters from the type 1 model at the temperatures shown in panels E1A~E4A, respectively. The variables g̅K and τ̅n used in the simulations are shown at the top of the boxes in the bottom panel of each set of three panels. Panels E1A, E1B, and S1 display beating chaos. Panels E2A, E2B, and S2 display bursting chaos. Panels E3A, E3B, and S3 display square-wave bursting. Panels E4A, E4B, and S4 display bursting-oscillation.
Fig. 4.
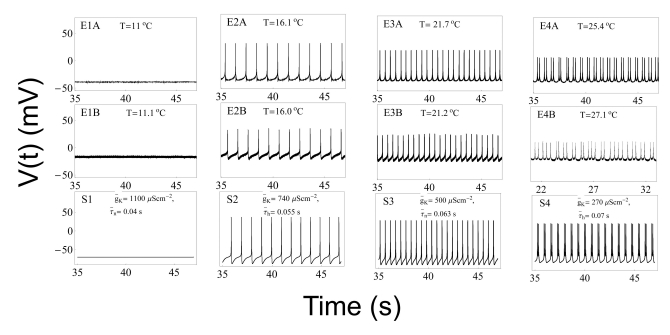
Comparison of experimental results with results from computer simulations. Panels E1A~E4A display data from Experiment A. Panels E1B~E4B display data from Experiment B. The relevant temperatures are shown at the top of each box. Panels S1~S4 display values calculated from equations (1) to (4) using parameters from the type 1 model at the temperatures shown in panels E1A~E4A, respectively. The variables g̅K and τ̅n nused in the simulations are shown at the top of the boxes in the bottom panel of each set of three panels. Panels E1A, E1B, and S1 display silent pattern. Panels E2A, E3A, E2B, E3B, S2 and S3 display beating pattern. Panels E4A, E4B, and S4 display doublet pattern.
The model
Although the Huber-Braun cold receptor model [14,15] describes cold receptors well, proper biophysical model for warm receptors has not been searched. To set up nonlinear differential equations that could simulate all of these various spiking patterns together, it was necessary to modify the equations (Chay-Lee model) derived by Chay and Lee [6,7] with temperature-dependent scaling factors; we adapted the temperature-dependent scaling factors for the ionic currents, ρ(T), and for the ionic kinetics, φ(T), that are used in the Huber-Braun cold receptor model. To consider a temperature-dependent scaling factor for reversal potentials (or Nernst potentials), a new temperature-dependent scaling factor, σ(T), was defined and used. The reference temperature T0 was also present in these new equations. As a result, we obtained equations using 23 parameters with temperature-like scaling factors to simulate the sequential firing patterns shown in Fig. 3.
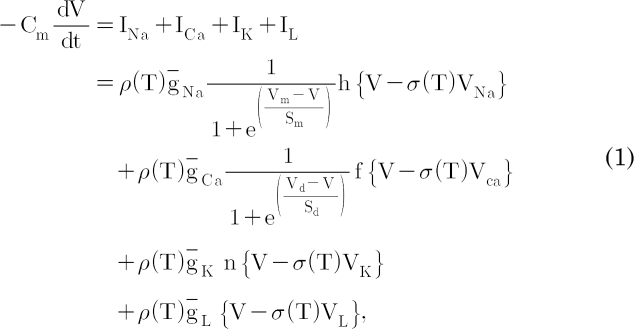
The cell membrane of this model contains sodium, calcium, and potassium channels carrying a fast sodium current, INa, fast calcium current, ICa, and a potassium current, IK, respectively. The sodium channel contains a fast-activated m gate and a fast-inactivated h gate upon depolarization. The calcium channel contains a fast-activated d gate and a slow-inactivated f gate. The potassium channel is controlled by an activated n gate. This membrane also contains a leak current, IL. And then the membrane potential, V, is given by
where Cm is the membrane capacitance. The temperature-dependent scaling factor, ρ(T), is defined as  ; the temperature coefficient of the single-channel conductance is Q10=1.35 [18]. The other temperature-dependent scaling factor, σ(T), is defined as
  . In Eq. (1), VNa, VCa, VK, and VL are the Nernst potentials for the Na+, Ca++, K+, and leak currents, respectively; and g̅Na, g̅Ca, g̅K, and g̅L are the maximal conductance for the respective currents. Vm and Sm, Vd and Sd are the half-maximal potentials and the slopes at these half-maximal potentials of the activation variables m and d, respectively. The inactivation variables h and f, and the activation variable n are all functions of voltage and time and these are described by the following differential equations,


where the temperature-dependent scaling factor, φ(T), is defined as  ; many enzyme reactions have a Q10 value near 3, as does the gating of many ion channels [18]. The sigmoidal steady-state inactivations, h∞ and f∞ are defined as
  and
and  , and the steady-state activation, n∞, is defined as
  . The parameters h∞, f∞, and n∞ are functions of voltage and time. The relaxation time constants τh, τf, and τn are respectively defined as
  ,
,  , and
, and  , where τ̅h, τ̅f, and τ̅n are maximal time
constants; these are also functions of voltage and time. The actual forms of these variables are described in equations (2)~(4). The variables Vh and Sh, Vf and Sf, Vn and Sn are the half-maximal potentials and the slopes at these half-maximal potentials of h, f, and n, respectively.
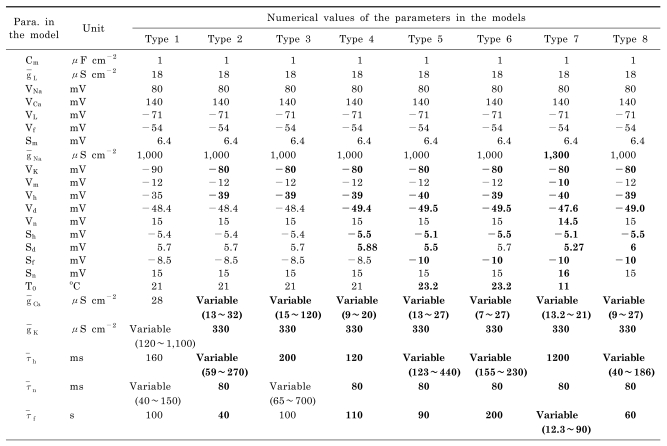
We modified the equations derived by Chay and Lee [6,7] for excitable cells by adopting temperature-like scaling factors defined in the Huber-Braun model. This modified Chay-Lee model is required to explain the temperature dependence of the sequence of the seven different firing patterns. Various combinations of ρ(T), φ(T), and σ(T) are shown in Table 2. Scaling factors in the type 1, 2 and 3 models have similar temperature-dependent scaling factors as those in the above mentioned paper by Braun et al. We tried to apply scaling factors that depend on temperature in this new equations as much as possible. To do this, we considered all eight combinations of scaling factors. Table 2 and 3 contains details of the eight different type models obtained by changing the temperature-dependent scaling factors. In type 1 model g̅K and τ̅n were used as variables, and the temperature-dependent scaling factors used in the Huber-Braun cold receptor model were chosen. Although the reference temperature was 25℃ in the Huber-Braun model, in this model we took a value of 21℃ as the reference temperature because this represents the middle of the temperature range (from 11℃ to 31℃) of Experiment A. The type 2 and 3 models used the same combination of factors as type 1 model except that the variable g̅Ca, τ̅h was used in the type 2 and g̅Ca in the type 3 instead of g̅K,τ̅n in type 1. The type 4 model is different from the type 1 because a scaling factor, σ(T) is considered in addition to the type 1 parameters. g̅Ca is the only variable used in the type 4 model. The type 5 model differs from the type 1 model because a scaling factor for the maximum conductance of leak current is considered, and a new reference temperature, 23.2℃, is used. The type 6 model is the same as the type 5 except for an additional scaling factor, σ(T). The type 7 model is the same as the type 1 model except that the reference temperature is taken to be 11℃ and the variables g̅Ca and τ̅f are used instead of g̅K and τ̅n. Twenty one fixed parameters are used in the type 8 model and g̅Ca and τ̅h are variables [19].
Table 2.
Seven arrangements of temperature-dependent scaling parameters for maximum conductance and time constants
Scaling para. for the time constants, scaling parameters for the time constants; Scaling para. for Nernst potentials, scaling parameters for Nernst potentials; Ref. temp., reference temperature.
Table 3.
Numerical values of the parameters in the models. The first seven parameters are the same in all eight model types. For the middle 11 parameters, numerical values in bold type indicate the parameters that have different values from that used in type 1. The last five parameters denote variables
Para. in the model, parameters in the model.
From these eight types of model, it was necessary to select the best type of model to properly explain the temperature dependence of the sequence of firing patterns. Each value of the first seven parameters in Table 3 was the same for all models. In the middle section of the table, numerical values in bold type indicate the parameter values that differ from the corresponding values in the type 1 model. The five parameters at the bottom of Table 3 are variables: g̅Ca, g̅K, τ̅h, τ̅n, and τ̅f. g̅Ca is a variable in all of these seven types of model except the type 1 model.
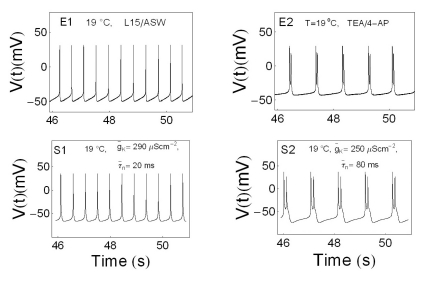
It is, however, necessary to check other merit points of the type 1 model. The first merit point is that the type 1 model was obtained using the same kind of temperature-dependent scaling factors used by the Huber-Braun cold receptor model. The second one is that the temperature range of the doublet in the experiment (between 24.5℃ and 26.3℃) was similar to that in simulation results (between 24.0℃ and 26.5℃). The last point to consider is that g̅K and τ̅n were used as variables. These two variables are associated with the potassium channels. Interestingly, we found that the spiking pattern changed from beating to doublet (from Fig. 8E1 to E2), when potassium channel blockers, TEA and 4-AP were used. It is noteworthy that this change phenocopies the temperature-induced change from beating to doublets (from Fig. 4E3A to 4E4A). Therefore, the type 1 model was considered to be a suitable simulation model as it contains the potassium channel associated variables, g̅K and τ̅n. The procedure to draw figures using parameters of the type 1 model is as follows.
Fig. 8.
Comparison of beating and bursting signals influenced or uninfluenced by drugs with simulation results. Panel E1 and E2 represents time series of APs without drug and with the treatment of drugs mixed with 10 mM TEA and 10 mM 4-AP, respectively. Panel S1 and S2 represents the results of computer simulation with modified Chay-Lee model with temperature-like scaling factors.
Computer simulation
The time traces of APs in Fig. 4S1 are plotted from the equations (1) to (4) at temperatures indicated in Fig. 4E1A using the values of the maximal potassium conductance and maximal potassium time constant in Fig. 4S1. Panels from Fig. 4S2 to Fig. 5S4 are also composed of the graphs plotted from these equations at temperatures indicated in the corresponding panels (from Fig. 4E2A to Fig. 5E4A) using the values of the corresponding potassium maximal conductances and maximal time constants shown in the panels from Fig. 4S2 to Fig. 5S4. In order to draw these graphs, we used the following numerical values in the type 1 model:
membrane capacitance: Cm=1µFcm-2;
the Nernst potentials for ions: VNa=80 mV, VCa=140 mV, VK=-90 mV, VL=-71 mV;
the maximal conductance: g̅Na=1,000µS cm-2, g̅Ca=28µS cm-2, g̅K=variable (120~1,100µS cm-2), g̅L=18µS cm-2;
maximal time constants: τ̅h= 0.16 s, τ̅f= 100 s, τ̅n= variable (0.040~0.150 s);
the half-maximal potentials: Vm=-12 mV, Vh=-35 mV, Vd=-48.4 mV, Vf=-54 mV, Vn=15 mV;
the slopes at the half-maximal potentials: Sm=6.4 mV, Sh=-5.4 mV, Sd=5.7 mV, Sf=-8.5 mV, Sn=15 mV;
reference temperature: T0=21℃.
The values of the variables g̅K and τ̅n used in each simulation are shown in the bottom panels of Fig. 4 and 5.
To compare the simulation results with experimental results, eight sets of three figures are drawn in Fig. 4 and 5. The time traces of membrane potentials displayed in the top panels of Fig. 4 and 5 (from Fig. 4E1A to Fig. 5E4A) show a part of data from Experiment A shown in Fig. 3, whereas those in the middle panels (from Fig. 4E1B to Fig. 5E4B) show a part of data from Experiment B. These sets of figures are arranged from low to high temperatures. Simulation results of the type 1 model are displayed in the bottom panels in Fig. 4 and 5 (from Fig. 4S1 to Fig. 5S4); these figures were obtained by solving equations in modified Chay-Lee model using Mathematica 5.1. To summarize, the bottom panels of Fig. 4 and 5 show the simulation results of this model at the temperatures shown in top panels; the used values of variables are shown in bottom panels.
In Fig. 4 panels E1A, E1B, and S1 show silent patterns. Panels E2A , E3A, E2B, E3B, S2, and S3 show beating, whereas panels E4A, E4B, and S4 show doublet patterns. In Fig. 5, panels E1A, E1B and S1 show beating-chaos, whereas panels E2A, E2B, and S2 show bursting-chaos. Panels E3A, E3B, and S3 show square-wave bursting, whereas panels E4A, E4B, and S4 show bursting-oscillations. Although the AP amplitudes in the simulation results (panels from Fig. 4S1 to Fig. 5S4) and the corresponding experimental results (from Fig. 4E1A to Fig. 5E4A) are slightly different, the frequencies of the time series of simulated APs are all very similar to the corresponding experimental results. This is in line with the fact that specific intensity information of environmental stimulus is transformed into a corresponding AP frequency in sensory receptors. Therefore, the simulation results of these eight model types can be interpreted as similar results to the experimental ones despite a little discrepancy in the AP amplitude simulation.
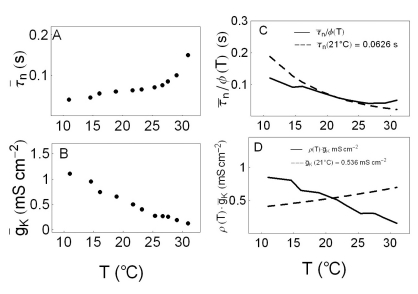
Fig. 6A and Fig. 6B displays the values of variables, τ̅n and g̅K, respectively, with respect to temperature. Fig. 6C displays the maximum time constant τ̅n, divided by the temperature-like scaling factor φ(T), τ̅n/φ(T) as a function of temperature. The solid line in this figure displays τ̅n/φ(T) where τ̅n varies with temperature with each value in the panel A; at low temperatures, the values of τ̅n/φ(T) are lower, and at high temperatures those are higher than the expected values, which is shown as a dotted line in this panel. Fig. 6D displays the maximum potassium conductance, g̅K, multiplied by the temperature-like scaling factor ρ(T), i.e., ρ(T) · g̅K. The solid line in this panel displays ρ(T) · g̅K where g̅K varies with temperature with each value in the panel B; the values of ρ(T) · g̅K decrease, yet the expected values of these increase as the temperature increases.
Fig. 6.
Simulation variables. Panel A display the variation in τ̅n with respect to temperature. Panel B displays the variation in g̅K with respect to temperature. Panel C displays τ̅n/φ(T). In this panel the dotted line displays the value of τ̅n/φ(T) when τ̅n is a constant value at reference temperature 21℃. The solid line in panel C displays τ̅n/φ(T) with τ̅n as a variable represented in panel A at the corresponding temperatures. At low (high) temperatures the value of τ̅n/φ(T) is smaller (larger) than the expected value, which is shown as a dotted line. Panel D displays ρ(T)·g̅K. In this panel the dotted line displays the value of ρ(T)·g̅K when g̅K is a constant value at reference temperature of 21℃. The solid line in this panel displays the value of ρ(T)·g̅K with g̅K a variable represented in panel B at the corresponding temperatures. Although the dotted line increase as temperature increase, the solid line decrease.
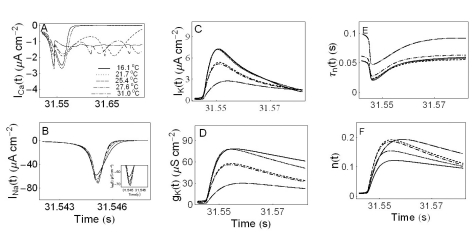
Fig. 7A, B, C displays the calcium current, ICa(t), the sodium current, INa(t), and the potassium current, IK(t), as functions of time, respectively. The solid, dotted, dashed, dash-dotted, dashed-double dotted lines in panels from A to F are used to represent the variables as a function of time at temperatures 16.1℃, 21.7℃, 25.4℃, 27.6℃, and 31℃, respectively. As shown in Fig. 7A the maximum calcium currents increase as the temperature rises until 21.7℃ and then decrease, but sodium currents increase as the temperature increases as shown in Fig. 7B and inset figure. The maximum potassium current decreases as the temperature increases. This is shown in Fig. 7C. Time series of the potassium conductance, gK(t) are shown in Fig. 7D. The maximum potassium conductance also decreases as the temperature increases. Time series of the potassium time constants τn(t) are shown in Fig. 7E. The maximum values of τn(t) decrease as the temperature rises until 25.4℃ and then decrease as the temperature increases further. Fig. 7F displays a time series of the probability of the opening of the potassium channel activation gate, n(t). In this panel, the maximum values of n(t) at high temperatures are larger than those at low temperatures. However, we need more experimental data to investigate the exact mechanisms inherent in determining the temperature-dependent properties of Aplysia neurons. We then carried out the experiments with potassium channel blockers since potassium channels are known to critically regulate the shape of AP and the firing pattern.
Fig. 7.
Ionic currents and parameters as a function of time. Panel A, B, and C display ICa(t), INa(t), and IK(t), respectively. The solid, dotted, dashed, dash-dotted, dashed-doubledotted lines in panels from A to F are used to represent the variables as a function of time at temperatures 16.1℃, 21.7℃, 25.4℃, 27.6℃, and 31℃, respectively. Panel D displays gk(t). The potassium channel relaxation time constants τn(t) and the probabilities of openings for activation of the potassium channels n(t) as a function of time are shown in panels E and F, respectively.
We used two distinct, specific potassium channel blockers TEA and 4-AP to find inter-relationships between TEA, 4-AP and APs. Our electrophysiological recording data revealed that TEA and 4-AP produced distinct pattern changes. Treatment of 10 mM TEA made AP frequency rise, width of APs wider, negative peak value rise, and amplitude of APs decrease. Treatment of 10 mM 4-AP made mostly opposite effects. It made AP frequency fall and width of APs narrower, and amplitude of APs increase, but negative peak value is not much affected. Mixing both 10 mM TEA and 10 mM 4-AP showed similar results to 10 mM TEA treatment (data not shown). We also found that the spiking pattern changed from beating (Fig. 8E1) to doublet (Fig. 8E2) at 19℃ when mixed K+ channel blockers (10 mM TEA and 10 mM 4-AP) were bath applied to Aplysia neuron. It is noteworthy that this is similar to the change from beating (Fig. 4E3A)to doublets (Fig. 4E4A) when temperature was changed from 21.7℃ to 25.4℃. Fig. 8S1 and S2 represents the results of computer simulation with modified Chay-Lee model using the values of variables shown in each panel at 19℃.
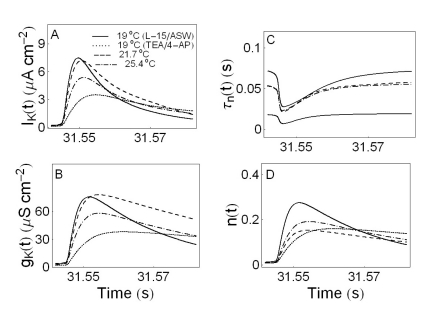
Ionic currents and parameters analyzed in the experiments with drugs (Fig. 8E1, E2, S1, and S2) or changing temperatures (Fig. 4E3A, E4A, S3, and S4) are shown in Fig. 9 as a function of time. Fig. 9A and B display IK(t) and gK(t), respectively. The solid, dotted lines in the panels from A to D shows the time series of ionic currents and parameters without drugs and with drugs (10 mM TEA and 10 mM 4-AP) at 19℃, respectively. The dashed and dash-dotted lines in the panels from A to D show the time series of those parameters in the firing state of beating at 21.7℃ and in the spiking state of doublet at 25.4℃, respectively. The time series of the potassium channel relaxation time constant, τn(t) and the probabilities of the openings for the activation of the potassium channels, n(t) are shown in the panels C and D. The maximum value of τn(t) increases whereas the maximum value of n(t) decreases as temperature increases.
Fig. 9.
Ionic currents and parameters as a function of time. Panel A and B display IK(t) and gK(t), respectively. The potassium channel relaxation time constants τn(t) and the probabilities of openings for activation of the potassium channels n(t) as a function of time are shown in panels C and D, respectively. The solid, dotted, dashed, and dash-dotted lines in panels from A to D indicate L15/ASW medium control without drugs at 19℃, L15/ASW medium containing 10 mM TEA and 10 mM 4-AP at 19℃, L15/ASW medium at 21.7℃, and L15/ASW medium at 25.4℃, respectively.
DISCUSSION
Modified Chay-Lee model with temperature-dependent scaling factors
By analyzing the equations in modified Chay-Lee model, we attempted to trace the mechanism underlying change of the various spike patterns as a response to a periodic change in temperature in Aplysia neurons.
It is known that the solutions of the dynamic equations developed by Chay and Lee [6,7] simulate six consecutive spiking patterns with the increasing function of maximal relaxation time constant τ̅h (or τ̅n). Although these equations does not contain any temperature-dependent scaling factors, the Huber-Braun cold receptor model [14,15] contains temperature-like scaling factors; the maximal conductances of currents were multiplied by the temperature-dependent scaling factor ρ(T), and the maximal time constants were divided by the temperature-dependent scaling factor φ(T). To reproduce by simulation the seven different types of signals during an increase (or decrease) in temperature, a set of equations that contain temperature-dependent scaling factors are required; the aim was to find neuronal equations capable of simulating at once all the various spiking patterns shown in Table 1. As a result, we crafted a set of equations by modifying the Chay-Lee model to include temperature-dependent scaling factors for the ionic currents and for the ionic kinetics used in the Huber-Braun cold receptor model; computer simulation using the parameter values in the type 1 model was reasonably good. However, the simulated AP amplitudes displayed in Fig. 4S1~Fig. 5S4 were slightly larger than the experimental results displayed in Fig. 4E1A~Fig. 5E4A. Nevertheless, the frequencies of simulation and experimental results were similar when compared at the corresponding temperatures. This demonstrates that we can trace the ionic mechanism of the firing pattern change in response to temperature change in Aplysia neurons by solving these equations of modified Chay-Lee model and analyzing the simulation results.
Ionic mechanism of temperature-driven firing pattern change
The modified Chay-Lee model contains a fast INa and slow ICa. The characteristics of these inward currents are similar to each other because the d gate in ICa opens as fast as the m gate in INa. τ̅f controls the burst periodicity, whereas τ̅h and τ̅n are related to the amplitude and frequencies of spikes [6]. As shown in Table 3, τ̅h, τ̅f, or τ̅n are variables in the simulation. These parameters with temperature-dependent scaling factors decrease as temperature increases. This means that the h, f, and n gates open faster at high temperature than at low temperature. The maximum conductances g̅Ca, g̅Na, and g̅K with the temperature-dependent scaling factors theoretically increase as temperature increases, whereas g̅K decreases as temperature increases as shown in Fig. 6B. The calcium currents, ICa(t) have maximum value at 21.7℃ and decrease at high temperatures as shown in Fig. 7A. In Fig. 7B and C, however, maximum values of INa(t) and IK(t) increase and decrease as temperature increases, respectively. As shown in Table 3, we used five variable parameters in the simulation: g̅Ca, g̅K, τ̅h, τ̅n, and τ̅f. Among the five variables, only two are used in the type 1 model: g̅K and τ̅n;τ̅n is one of the three variables of maximal time constants, and g̅K is one of the two variable of maximal conductances. From these figures, it may be supposed that the temperature dependence of sodium and calcium currents is driven by the temperature-dependent potassium current. Thus, the voltage-dependent potassium current is assumed to play a leading role in the temperature-sensitive reactions of neurons in Aplysia abdominal ganglion. However, more experiments have to be performed for further analysis with other channel blockers or other currents [20].
How can we trace the mechanism of change between the various spike patterns in Aplysia neurons in response to a periodic change in temperature by analyzing the modified Chay-Lee model? To address the issue, we can present the following procedure. First, it is necessary to set up nonlinear differential equations with temperature-like scaling factors and experiment results are to be simulated with these equations. Second, other experiments should be performed with ion channel blockers and these experimental results have to be simulated with revised equations. During the repeated procedure, if all of the AP parameters [17] are simulated well, then the problems will be resolved. Let's give an instance. In a set of experiments, we found that the spiking pattern change from beating to doublet (from Fig. 8E1 to E2) at room temperatures in the presence of K+ channel blockers was similar with the changes from beating to doublets caused by change in temperature only (from Fig. 4E3A to E4A). Therefore, some of the mechanisms inherent in the temperature dependencies of Aplysia neurons can be expressed by analyzing the results of the experiments using modified Chay-Lee model.
TEA or 4-AP reduced potassium current at a concentration of 10 mM and blocked ion conduction through potassium channels in a voltage-dependent manner [21]. However, n(t) decreased and τ̅n increased when TEA was applied [22]. These results were consistent with the simulation results obtained using modified Chay-Lee model and potassium current and conductance decreased, but τ̅n increased as drugs (TEA/4-AP) were applied (Fig. 8S1, Fig. 8S2). It would be interesting to perform more experiments in the future using more channel blockers or at different temperatures with different firing patterns to examine how reliably our modified Chay-Lee model can simulate experimental results.
Concluding remarks
When the temperature was increased from 11℃ to 31℃, the firing patterns changed sequentially from silent to continuous spiking, doublets, beating-chaos, bursting-chaos, square-wave bursting, and bursting-oscillation sequentially. We wanted to develop a set of equations to describe these firing pattern changes and tried to apply temperature-dependent scaling factors in modified Chay-Lee model; as a result, 23 temperature dependent parameters were used in these equations. Figures were drawn by solving these equations in this model using Mathematica 5.1. Although the simulated AP amplitudes were slightly bigger than those in the experimental results, the frequencies of the simulated and experimental results were very similar to each other. These results clearly suggest that our model equations could trace the ionic mechanism underlying the firing pattern changes in response to temperature change in Aplysia neurons by analyzing the solutions of modified Chay-Lee model. As a result, the voltage-dependent potassium current seems to play a leading role in the temperature dependence of neurons in Aplysia abdominal ganglion. Therefore, it will be of great interest to apply our new model equations to simulate the temperature dependence of the 14 AP parameters that we identified in Aplysia neurons in the previous study [17].
ACKNOWLEDGEMENTS
This work was supported by a research grant from Jeju National University in 2007 and supported in part by URP program in KAIST. NGH is most grateful to Prof. Jang-Ho Cha for his helpful advice and suggestions throughout the course of this work and for his generosity in allowing experiments to be conducted at MGH. BKK was supported by the National Creative Research Initiative Program and the WCU program. KL was supported by the Basic Science Research Program of the Ministry of Education, Science and Technology (2011-0028240).
ABBREVIATIONS
- TEA
tetraethylammonium chloride
- 4-AP
4-Aminopyridine
- AP
action potential
- ISI
the interspike interval
- IBI
the interburst interval
- ASW
artificial seawater
- DAQ
data acquisition
- ID
interval duration
References
- 1.Carpenter DO. Temperature effects on pacemaker generation, membrane potential, and critical firing threshold in Aplysia neurons. J Gen Physiol. 1967;50:1469–1484. doi: 10.1085/jgp.50.6.1469. [DOI] [PMC free article] [PubMed] [Google Scholar]
- 2.Moffett S, Wachtel H. Correlations between temperature effects on behavior in Aplysia and firing patterns of identified neurons. Mar Behav Physiol. 1976;4:61–74. [Google Scholar]
- 3.Carpenter DO, Alving BO. A contribution of an electrogenic Na+ pump to membrane potential in Aplysia neurons. J Gen Physiol. 1968;52:1–21. doi: 10.1085/jgp.52.1.1. [DOI] [PMC free article] [PubMed] [Google Scholar]
- 4.Fletcher SD, Ram JL. High temperature induces reversible silence in Aplysia R15 bursting pacemaker neuron. Comp Biochem Physiol. 1991;98A:399–405. [Google Scholar]
- 5.Hakozaki S, Matsumoto M, Sasaki K. Temperature-sensitive activation of G-protein regulating the resting membrane conductance of Aplysia neurons. Jpn J Physiol. 1989;39:115–130. doi: 10.2170/jjphysiol.39.115. [DOI] [PubMed] [Google Scholar]
- 6.Chay TR. Bursting excitable cell models by a slow Ca2+ current. J Theor Biol. 1990;142:305–315. doi: 10.1016/s0022-5193(05)80555-7. [DOI] [PubMed] [Google Scholar]
- 7.Chay TR, Lee YS. Bursting, beating, and chaos by two functionally distinct inward current inactivations in excitable cells. Ann N Y Acad Sci. 1990;591:328–350. doi: 10.1111/j.1749-6632.1990.tb15099.x. [DOI] [PubMed] [Google Scholar]
- 8.Hensel H, Huopaniemi T. Static and dynamic properties of warm fibres in the infraorbital nerve. Pflugers Arch. 1969;309:1–10. doi: 10.1007/BF00592277. [DOI] [PubMed] [Google Scholar]
- 9.Hensel H, Schäfer K. Static an dynamic activity of cold receptors in cats after long-term exposure to various temperatures. Pflugers Arch. 1982;392:291–294. doi: 10.1007/BF00584313. [DOI] [PubMed] [Google Scholar]
- 10.Schäfer K, Braun HA, Kürten L. Analysis of cold and warm receptor activity in vampire bats and mice. Pflugers Arch. 1988;412:188–194. doi: 10.1007/BF00583749. [DOI] [PubMed] [Google Scholar]
- 11.Hensel H. Static and dynamic activity of warm receptors in Boa constrictor. Pflugers Arch. 1975;353:191–199. doi: 10.1007/BF00584283. [DOI] [PubMed] [Google Scholar]
- 12.Kim YD, Cho MH, Kwon SC. Myoplasmic [Ca2+], crossbridge phosphorylation and latch in rabbit bladder smooth muscle. Korean J Physiol Pharmacol. 2011;15:171–177. doi: 10.4196/kjpp.2011.15.3.171. [DOI] [PMC free article] [PubMed] [Google Scholar]
- 13.Kim KS, Shin DH, Nam JH, Park KS, Zhang YH, Kim WK, Kim SJ. Functional expression of TRPV4 cation channels in human mast cell line (HMC-1) Korean J Physiol Pharmacol. 2010;14:419–425. doi: 10.4196/kjpp.2010.14.6.419. [DOI] [PMC free article] [PubMed] [Google Scholar]
- 14.Braun HA, Huber MT, Dewald M, Schäfer K, Voigt K. Computer simulations of neuronal signal transduction: the role of nonlinear dynamics and noise. Int J Bifurcation Chaos. 1998;8:881–889. [Google Scholar]
- 15.Finke C, Freund JA, Rosa E, Jr, Braun HA, Feudel U. On the role of subthreshold currents in the Huber-Braun cold receptor model. Chaos. 2010;20:045107. doi: 10.1063/1.3527989. [DOI] [PubMed] [Google Scholar]
- 16.Lim CS, Chung DY, Kaang BK. Partial anatomical and physiological characterization and dissociated cell culture of the nervous system of the marine mollusc Aplysia kurodai. Mol Cells. 1997;7:399–407. [PubMed] [Google Scholar]
- 17.Hyun NG, Hyun KH, Lee K, Kaang BK. Temperature Dependence of Action Potential Parameters in Aplysia Neurons. Neurosignals. 2011 doi: 10.1159/000334960. (in press) [DOI] [PubMed] [Google Scholar]
- 18.Hille B. Ion channels of excitable membranes. 3rd ed. Sunderland Mass: Sinauer; 2001. p. 366. [Google Scholar]
- 19.Hyun NG. The brain and the mind. 1st ed. Jeju: Jeju Nat Univ; 2007. pp. 321–338. [Google Scholar]
- 20.Wang LY, Fedchyshyn MJ, Yang YM. Action potential evoked transmitter release in central synapses: insights from the developing calyx of Held. Mol Brain. 2009;2:36. doi: 10.1186/1756-6606-2-36. [DOI] [PMC free article] [PubMed] [Google Scholar]
- 21.Volk KA, Matsuda JJ, Shibata EF. A voltage-dependent potassium current in rabbit coronary artery smooth muscle cells. J Physiol. 1991;439:751–768. doi: 10.1113/jphysiol.1991.sp018691. [DOI] [PMC free article] [PubMed] [Google Scholar]
- 22.Spruce AE, Standen NB, Stanfield PR. The action of external tetraethylammonium ions on unitary delayed rectifier potassium channels of frog skeletal muscle. J Physiol. 1987;393:467–478. doi: 10.1113/jphysiol.1987.sp016833. [DOI] [PMC free article] [PubMed] [Google Scholar]


