

Summary
Long-SAGE (Serial Analysis of Gene Expression) was used to profile the transcriptome of the brown tide-forming alga, Aureococcus anophagefferens, under nutrient replete (control), and nitrogen (N) and phosphorus (P) deficiency to understand how this organism responds at the transcriptional level to varying nutrient conditions. This approach has aided A. anophagefferens genome annotation efforts and identified a suite of genes up-regulated by N and P deficiency, some of which have known roles in nutrient metabolism. Genes up-regulated under N deficiency include an ammonium transporter, an acetamidase/formamidase, and two peptidases. This suggests an ability to utilize reduced N compounds and dissolved organic nitrogen, supporting the hypothesized importance of these N sources in A. anophagefferens bloom formation. There are also a broad suite of P-regulated genes, including an alkaline phosphatase, and two 5’-nucleotidases, suggesting A. anophagefferens may use dissolved organic phosphorus under low phosphate conditions. These N- and P-regulated genes may be important targets for exploring nutrient controls on bloom formation in field populations.
Introduction
Aureococcus anophagefferens is a small (~2 μm) eukaryotic phytoplankton responsible for the brown tide events that have plagued many coastal ecosystems in the Eastern United States, most notably Long Island waters. Shortly after its discovery in 1985, it became evident that brown tide events were decimating the Long Island scallop industry and causing substantial losses to eelgrass habitat (Dennison et al. 1989, Greenfield and Lonsdale 2002, Greenfield et al. 2004). This, combined with the regularity of blooms occurring in the Eastern U.S., has led to A. anophagefferens becoming a widely studied harmful algal bloom (HAB) species (see reviews by Gobler et al. 2005 and Sunda et al. 2006).
Occurrences of HABs in coastal ecosystems have been commonly attributed to nutrient loading, whereby increased levels of nitrogen (N) and phosphorus (P) relieve algae from nutrient limitation (see review by Anderson et al. 2008). In contrast, A. anophagefferens often blooms in periods when concentrations of dissolved inorganic nitrogen (DIN) and dissolved inorganic phosphorus (DIP) are low. For example, blooms have been linked to low nitrate inputs resulting from variability in ground water flow (LaRoche et al. 1997). Mesocosm experiments during a natural bloom also showed enrichment with DIN and DIP inversely correlated with A. anophagefferens cell densities (Keller and Rice 1989). Further experimental evidence shows a reduction of the relative abundance of A. anophagefferens within the phytoplankton community during DIN enrichment (Gobler and Sañudo-Wilhelmy 2001, Gobler et al. 2002, 2004, Kana et al. 2004).
Culture work has shown that A. anophagefferens can utilize N from a variety of organic compounds, including proteins, chitobiose, and acetamide (Berg et al. 2002, Mulholland et al. 2002). These observations are supported by field studies indicating that natural assemblages of phytoplankton during brown tide events have the ability to use N from dissolved organic nitrogen (DON) such as amino acids and urea (Berg et al. 1997, 2003, Mulholland et al. 2002), and that A. anophagefferens has a higher affinity for reduced N (e.g. ammonium) and DON (e.g. urea and amino acids) than nitrate (Lomas et al. 1996, Mulholland et al. 2002, 2004). To date, there is only one study that has examined N-regulated gene expression in A. anophagefferens. Using a quantitative RT-PCR approach on targeted genes involved in N transport and metabolism, it was demonstrated that A. anophagefferens up-regulates a variety of genes, in response to acute N deficiency and growth on different N sources including transporters for nitrate, formate/nitrite, urea, ammonium, and amino acids among others (Berg et al. 2008). Studies of P physiology are more limited. A. anophagefferens is capable of growing on dissolved organic phosphorus (e.g. glycerol-phosphate) as its sole P-source (Dzurica et al. 1989), but DOP metabolism in this group has not been comprehensively examined, either in culture studies or in the field. Further, there are no studies of functional genes related to P physiology in this species.
When taken together, these studies indicate that A. anophagefferens may have the capacity to utilize reduced nitrogen, or organic nutrients when the concentration of inorganic nutrients becomes low. Phytoplankton have evolved mechanisms for efficiently scavenging N and P from a variety of sources and these mechanisms can be induced at the transcriptional level when a nutrient becomes limiting (Grossman 2000, Dyhrman et al. 2006, 2008). Global transcriptome profiling studies have shown broad transcriptional regulation to nutrient deficiency in coccolithophores and diatoms (Dyhrman et al. 2006, Mock et al. 2008). This has also been seen in the HAB forming species Alexandrium fundyense (Erdner and Anderson 2006), and transcriptional studies are an increasingly popular tool for studies of HAB nutritional physiology (Dyhrman 2008). There are a number of approaches for examining transcription in a non-targeted manner, ranging from microarrays (e.g. Mock et al. 2008) to next generation sequencing of cDNA (e.g. Erdner et al. 2006). The Long-SAGE method used in this study is a sequencing-based approach, which avoids some of the challenges involved with microarrays, that infer abundance based upon hybridization, suffer from background noise, cross-hybridization problems, and only measure relative abundance (Irizarry et al. 2005). An adaptation of the original SAGE method (Velculescu et al. 1995), Long-SAGE generates tag libraries without a priori knowledge of gene sequences via the detection of 21 bp nucleotide sequence tags making it possible to evaluate the simultaneous expression patterns of many genes quantitatively (Saha et al. 2002). In this regard, Long-SAGE is similar to newer sequencing methods (digital gene expression and mRNA seq), but without the depth of coverage provided by advances in next generation sequencing capabilities (see review by Morozova et al. 2009). Long-SAGE tags are generated by the most 3’ Nla III restriction site on the transcript, and as a consequence, errors can be reduced by only considering tags mapping to the most 3’ Nla III site of a gene. Long-SAGE has been useful for identifying transcriptome profiles for other algae, including the coccolithophore Emiliania huxleyi (Dyhrman et al. 2006) and the dinoflagellate Pfiesteria shumwayae (Coyne et al. 2004).
In this study, transcriptional responses of A. anophagefferens to N and P deficiency (–N and –P) relative to a nutrient replete control were assayed to identify genes that A. anophagefferens may up-regulate when inorganic nutrients are depleted. These transcriptional responses were detected by mapping Long-SAGE tags to the 11,510 gene models identified by in silico modeling of the A. anophageferrens whole genome sequence (http://genome.jgi-psf.org/Auran1/Auran1.home.html). To our knowledge this is the first non-targeted transcriptional study in a Pelagophyte.
Results
Tag sampling and annotation
A total of 112,000 tags were sampled, representing 31,862 unique tags, from A. anophagefferens grown under P-deficient (–P), N-deficient (–N), and nutrient replete (control) conditions (Figure 1). At this sampling depth, there is still a high rate of unique tag discovery (Figure 2). All 31,862 unique Long-SAGE tags were annotated by mapping to available A. anophagefferens EST or genomic sequences. Of these 31,862 unique tags, 11,847 (37.2 percent) aligned to the genome with a 100 percent identical match to all 21 bp. A number of tags mapped to genes with annotations suggesting a role in N or P metabolism (Tables S1-S4).
Figure 1.

Growth of A. anophagefferens under nutrient replete (control), phosphorus-deficient (–P) and nitrogen-deficient (–N) conditions. The treatments were harvested on day 9 (box). Error bars represent standard deviation of the mean for the control (n = 3), –N and –P (n = 2).
Figure 2.
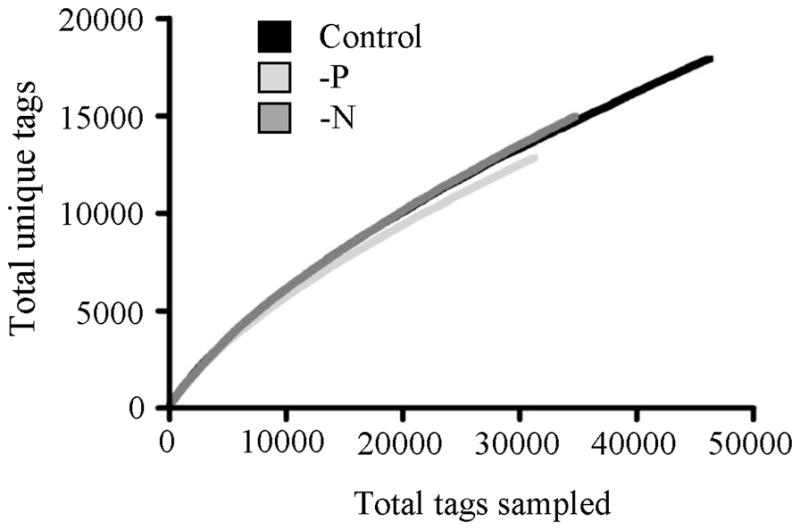
Long-SAGE tag data plotted showing the relationship between total tags sampled in each library and the number of unique tags found. A predicted asymptote (~50,000) was calculated by plotting the inverse of total tags sampled versus the inverse of unique tags and calculating the y-intercept.
Differential regulation
A. anophagefferens exhibited a broad transcriptional response to N and P deficiency, with 131 tags up-regulated two-fold or greater in –P, 56 tags up-regulated two-fold or greater in –N, 34 tags up-regulated two-fold or greater in both –P and –N, and 73 tags down-regulated two-fold or greater in both –N and –P. A tag in a given treatment is considered up-regulated (or down-regulated) if it shows two-fold or greater expression relative to both of the other libraries with an R value ≥ 2. In some cases, a tag was absent from one or more libraries, and is considered differentially regulated if the R value ≥ 2. The R value is a log likelihood ratio statistic which scores tags by their deviation from the null hypothesis of equal frequencies given the tag sampling depth for each Long-SAGE library (Stekel et al. 2003). A complete list of these 294 differentially expressed tags is available in the supplementary material (Tables S1-S4). Approximately 80 percent of differentially expressed tags could be mapped to available sequence data whereas 20 percent could not be aligned (Figure 3). Of tags that mapped to the genome, 43 percent were aligned with gene models (Figure 3). Roughly 49 percent of tags mapping to sequence data could not be assigned a function either because they aligned to (1) ESTs or genome sequence representing hypothetical or predicted proteins, (2) ESTs showing no database homology, or (3) genome sequence where no model is predicted (Tables S1-S4). Thus, approximately 31 percent of differentially expressed tags could be assigned a putative function (Tables 1–4).
Figure 3.
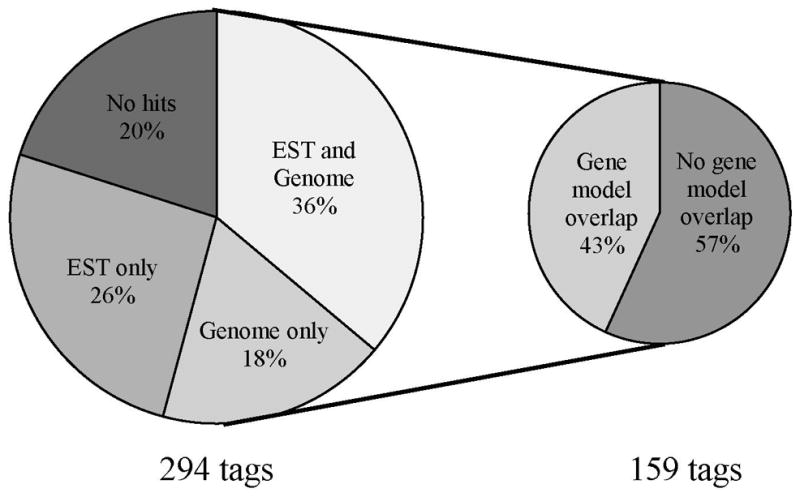
The percentage of tags showing differential regulation (294 total tags) that map to available sequence data, and the percentage of tags that overlap with gene models from the subset of those tags that map to the A. anophagefferens genome (159 tags). See text for a description of the criteria a tag must meet to be considered differentially regulated.
Table 1.
Successfully annotated tags showing up-regulation in the –P library. Only tags that show greater than two-fold change in the –P library relative to the control and –N libraries with an R-value > 2 are included. ESTs are given for tags annotated by mapping to an EST. A protein ID is given for: 1) tags that map directly to the genome where a gene model exists, or 2) tags that map to an EST that overlaps with a gene model on the genome.
| Tag ID | Tag sequence | R- value | Fold change versus: | Putative annotation | EST | Protein ID | |
|---|---|---|---|---|---|---|---|
| Control | -N | ||||||
| 1817 | CATGCCGGGCGCCTTCGACGC | 22.53 | 6.6 | Absent1 | 5' nucleotidase (manually curated)2 | - | 21301 |
| 1819 | CATGGGCGTCAAGCTCACGGC | 20.38 | 5.7 | Absent | Inorganic phosphate transporter (manually curated) | - | 22152 |
| 157 | CATGGTGAAGTTGCAAAAGGC | 16.19 | 2.5 | 6.8 | NADP-dependent oxidoreductase [Hahella chejuensis KCTC 2396] | - | 67152 |
| 1831 | CATGGCGCCCCTCGCCCGCGT | 10.09 | 4.8 | 4.4 | Endonuclease/exonuclease protein-like protein [Leishmania major] | - | 72478 |
| 2957 | CATGGTCTCCGTCTTCCACCC | 9.116 | 4.8 | 4.9 | ABC1-like [Oryza sativa Japonica Group] | - | 70922 |
| 1922 | CATGGTCTGGGCCGGCGAGGG | 7.792 | 4.949 | 7.3 | Nucleoside diphosphate kinase Nm23-SD1 [Suberites domuncula] | - | 22626 |
| 1833 | CATGGAGAACATCCACCGCGC | 7.194 | 3.4 | 27.9 | Mitochondrial substrate carrier family protein [Arabidopsis thaliana] | - | 22191 |
| 1921 | CATGTCCCAGTTCATCCTCGC | 6.070 | Absent | 13.9 | PREDICTED: similar to CG8472-PA, isoform A [Strongylocentrotus purpuratus] | - | 72105 |
| 1883 | CATGCGGGAGTCGCTAAGCTG | 5.601 | 4.4 | 3.0 | Beta transducin-like protein HET-E2C [Podospora anserina] | 4211177:40 | - |
| 1972 | CATGACGACGACCACCACCAC | 4.928 | Absent | Absent | Peptidase [Salinibacter ruber DSM 13855] | 4205112:1 | - |
| 2802 | CATGGACGCCGTCGACGCCGC | 4.928 | Absent | Absent | Pulvinus outward-rectifying channel for potassium SPOCK1 [Samanea saman] | 4205553:1 | - |
| 1556 | CATGTAGACACCCCCCCCTCC | 4.593 | 3.1 | 2.1 | Dimethylaniline monooxygenase (N-oxide forming). | - | 29808 |
| 1506 | CATGGACTACTGGCTCCTCGG | 4.451 | 2.9 | 4.6 | Cathepsin L [Theromyzon tessulatum] | 4209574:1 | - |
| 2385 | CATGATCGCCGCGCTGCGGCC | 4.402 | 2.6 | 19.3 | Fucokinase, isoform CRA_d [Homo sapiens] | 4217517:1 | - |
| 4828 | CATGGACGCGGCCGTCAAGCG | 4.224 | 2.9 | 6.4 | Alkaline phosphatase-like protein [Teredinibacter turnerae T7901] | 4205689:1 | - |
| 136 | CATGTACATACATCGCACATT | 4.017 | 5.3 | Absent | BRF1 homolog, subunit of RNA polymerase III transcription initiation factor IIIB [Danio rerio] | 71825 | - |
| 1879 | CATGCCCTCGACGCCGCAGCG | 3.689 | 9.5 | 7.0 | Chain A, 4ank: A Designed Ankyrin Repeat Protein With Four Identical Consensus Repeats | 4209777:1 | - |
| 1595 | CATGGACTCCGTCAAGCGCGG | 3.579 | 4.9 | Absent | Glycosyl transferase, group 1 | - | 60545 |
| 6248 | CATGGGCGCGCTCCGCGCCGT | 3.467 | 4.7 | 13.9 | 5'-nucleotidase (manually curated) | - | 28588 |
| 1917 | CATGCGCGCGCAGATCTGCGA | 3.125 | 3.7 | 4.8 | Protein kinase-like [Medicago truncatula] | 4211177:384 | - |
| 14815 | CATGGCAAGATTGTGGTTCCT | 2.962 | 13.1 | 9.7 | Glycoside hydrolase (manually curated) | - | 64125 |
| 2371 | CATGTCCACGCCGCAGCTCCG | 2.939 | 5.3 | 11.8 | ABC transporter (manually curated) | - | 62521 |
| 2034 | CATGATCATCTCGCCGTCGTC | 2.738 | Absent | Absent | PHD-finger family protein [Trichomonas vaginalis G3] | EH117526 | - |
| 3008 | CATGGCCTGCTACCGGGGCCA | 2.738 | Absent | Absent | PREDICTED: similar to ankyrin 2,3/unc44, partial [Strongylocentrotus purpuratus] | EH117401 | - |
| 1904 | CATGGCGTCGGGCTACGGCCC | 2.531 | 5.1 | Absent | Twin-arginine translocation pathway signal sequence domain protein, putative [Phaeobacter gallaeciensis 2.10] | 4205643:1 | - |
| 1957 | CATGGAGTAGATCCACCCGTC | 2.504 | 3.5 | 3.6 | Serine/threonine-protein kinase ripk4, putative [Penicillium marneffei ATCC 18224] | 4206124:1 | |
| 1929 | CATGCTCATCGCCTGCGTCGT | 2.463 | 3.3 | 4.3 | Synaptobrevin domain-containing protein [Dictyostelium discoideum AX4] | - | 36201 |
| 2817 | CATGGCAAATCCTGCCAAGGT | 2.454 | 6.6 | 9.7 | Mitogen-activated protein kinase 2 [Toxoplasma gondii] | - | 55052 |
| 3045 | CATGAAGGCGCCGTAGCTGCC | 2.433 | 5.3 | 5.9 | Flagellar associated protein [Chlamydomonas reinhardtii] | EH117555 | - |
| 1869 | CATGTCCAACCGCAAGTAGCT | 2.366 | Absent | 3.2 | Type I fatty acid synthase, putative [Toxoplasma gondii RH] | - | 72815 |
| 14836 | CATGCGCCTCTCGTACTACGG | 2.190 | Absent | Absent | OTU-like cysteine protease family protein [Tetrahymena thermophila] | 4208711:1 | |
| 14902 | CATGGACGCGTACGATTTGGT | 2.190 | Absent | Absent | Trehalose-phosphatase (manually curated) | - | 53568 |
| 14850 | CATGTACGTCGGCGAGGGCGG | 2.081 | Absent | 5.4 | Cellulase, endoglucanase (manually curated) | - | 12783 |
| 279 | CATGCCGCCGACGACGCGGTC | 2.019 | 2.5 | 2.3 | PREDICTED: similar to coiled-coil domain containing 93 [Ciona intestinalis] | 4206222:1 | - |
Fold change cannot be calculated on tags absent from a given library, but are included in the table with R-value > 2.
Manually curated notes the gene model was manually assigned a function and reviewed by a curator.
Table 4.
Successfully annotated tags showing greater than two-fold down-regulation in –N and –P libraries relative to the control (R-value >2). A protein ID is given for: 1) tags that map directly to the genome where a gene model exists, or 2) tags that map to an EST that overlaps with a gene model on the genome. ESTs are given for tags annotated by mapping to an EST.
| Tag ID | Tag sequence | R-value | Fold change in: | Putative annotation | EST | Protein ID | |
|---|---|---|---|---|---|---|---|
| -P | -N | ||||||
| 2 | CATGGTCCTCCGCCTCCGCGG | 11.54 | -2.5 | -2.4 | Polyubiquitin [Trichomonas vaginalis] | - | 17856 |
| 184 | CATGTAGGACGGACACGTAAG | 10.06 | -5.4 | -3.7 | Phosphoribosylaminoimidazole carboxylase, Candida glabrata | 4213887:1 | - |
| 257 | CATGAGCTCCCGGCTGCGGGC | 3.971 | -3.8 | -5.2 | ATP-dependent Clp protease proteolytic subunit [Cyanidioschyzon merolae] | 4206479:1 | - |
| 216 | CATGGGCGACGCCGTCGCCGC | 3.932 | -12.4 | -6.6 | 3-isopropylmalate dehydrogenase [Synechococcus elongatus PCC 6301] | EH412414 | - |
| 187 | CATGTAGGCGCGCCCGCGCGT | 3.846 | -6.2 | -3.3 | Methionine sulfoxide reductase A [Synechococcus sp. WH 5701] | - | 59179 |
| 1516 | CATGTCCTGCAAGAAGGACAC | 3.604 | -5.7 | -3.7 | Eukaryotic translation initiation factor 5A [Micromonas pusilla CCMP1545] | - | 59757 |
| 80 | CATGGTGAAGATCCCCCAGGC | 3.600 | Absent1 | -8.8 | Lipocalin [Pelobacter propionicus DSM 2379] | 4212868:1 | - |
| 53 | CATGGCCTAAAAAAAAAATAA | 3.251 | Absent | -8.1 | RS1, ribosomal protein 1 [Thalassiosira pseudonana] | 4211021:1 | - |
| 3728 | CATGGGGCTCTACGTCTACGG | 3.213 | Absent | -2.0 | Anthranilate phosphoribosyltransferase, chloroplast precursor putative, expressed [Oryza sativa (japonica cultivar-group)] | 4206546:1 | - |
| 4679 | CATGCTTAAAGAACTAATATA | 2.927 | -11.0 | -3.9 | PREDICTED: similar to ferredoxin-NADP reductase [Ornithorhynchus anatinus] | 4211085:1 | - |
| 4690 | CATGGAGGGCGAGAAGATCGC | 2.900 | -3.8 | Absent | Eukaryotic translation initiation factor 2 subunit 3, X-linked [Mus musculus] | - | 22992 |
| 240 | CATGTACTCCTAGAGGGTGCA | 2.896 | -2.1 | Absent | RAD23 [Phaeodactylum tricornutum CCAP 1055/1] | 4216537:1 | |
| 144 | CATGGCGCCGTATCAATAGCG | 2.857 | -2.5 | -2.1 | Protein kinase NPK2 [Nicotiana tabacum] | - | 72184 |
| 367 | CATGACGACGCCGGGCAGCCC | 2.730 | -5.5 | -5.9 | Proteophosphoglycan 5 [Leishmania major strain Friedlin] | 4206526:2 | - |
| 122 | CATGGACCTCAACCAGGTCAA | 2.691 | Absent | Absent | Replication factor A [Capsicum chinense] | 4216955:1 | - |
| 468 | CATGCGCGACGAGTTCCACGT | 2.642 | -10.3 | -3.7 | Aspartate aminotransferase [Phaeodactylum tricornutum CCAP 1055/1] | 4214969:2 | - |
| 4707 | CATGGCGCCGGACTACGTCGA | 2.520 | Absent | -2.0 | 1 origin recognition complex subunit 2 [Oryza sativa] | 4212823:1 | - |
| 3028 | CATGCACGGCTGATGAGCCCC | 2.437 | -2.3 | Absent | ABC transporter [Thalassiosira pseudonana CCMP1335] | 4210715:1 | - |
| 707 | CATGGGCTACAACGGCGGCAC | 2.331 | -5.5 | -3.9 | Light-inducible protein atls1, putative [Ricinus communis] | 4215630:1 | - |
| 996 | CATGGAGGACGAGGGGCGATG | 2.307 | Absent | Absent | Lipase/esterase [Synechococcus sp. CC9311] | - | 70850 |
| 4919 | CATGCGGCGCGGCGCGGCGGC | 2.307 | Absent | Absent | Centrin, putative [Plasmodium falciparum 3D7] | 4211177:12 | - |
| 4890 | CATGTGCAAGAAGCCCGGCTG | 2.260 | -5.5 | Absent | Putative GTP-binding protein typA [Oryza sativa] | - | 52055 |
| 375 | CATGACGGACCTCCGCGACAA | 2.229 | Absent | -5.9 | Malate/L-lactate dehydrogenase (manually curated)2 | 4211088:1 | |
| 4684 | CATGATGATCGAATGATCCAC | 2.156 | -9.6 | -2.6 | Nitrite reductase (manually curated) | - | 37238 |
| 4697 | CATGCGTGTCTACCCGGCCGC | 2.106 | -8.2 | -4.4 | Nitrate transporter (manually curated) | - | 60332 |
| 4807 | CATGTACCTCAAGCAGGACTC | 2.081 | Absent | -2.2 | DNA ligase I [Coprinopsis cinerea] | - | 36790 |
| 110 | CATGGACTAAAATTGATCACA | 2.058 | -5.5 | -2.9 | Elongation factor 1B-gamma, putative / eEF-1B gamma, putative [Arabidopsis thaliana] | 4210815:1 | - |
| 131 | CATGGCCGCGGCCATCGGCGT | 2.015 | -3.8 | -2.3 | F-ATPase family transporter: protons (mitochondrial) [Ostreococcus lucimarinus CCE9901] | 4206441:1 | - |
Fold change cannot be calculated on tags absent from a given library, but are included in the table with R-value > 2.
Manually curated notes the gene model was manually assigned a function and reviewed by a curator.
Of 131 tags up-regulated two-fold or greater in the –P treatment, many mapped to genes with putative functions in DIP and DOP acquisition (Table 1, Table S1). Tag 1819 mapped to a putative inorganic phosphate transporter, and showed an increase of almost 6-fold in the –P library relative to the control library (Table 1). Two tags (6248 and 1817) mapped to two unique 5’-nucleotidases. Tag 6248 was up-regulated 4.7-fold in the –P library relative to the control library, and was up-regulated 13.9-fold relative to the –N library (Table 1). Similarly, tag 1817 was up-regulated 6.6-fold in the –P library relative to the control library, and was absent in the –N library (Table 1). Consistent with the up-regulation of the putative 5’-nucleotidases, A. anophagefferens is able to grow on the nucleotide, adenosine monophosphate (AMP), as a sole P source (Figure 4). Tag 4828 mapped to an alkaline phosphatase and showed almost 3-fold up-regulation relative to the control library and 6.4-fold up-regulation relative to the –N library (Table 1). Other tags up-regulated in the –P library mapped to a putative oxidoreductase, a nuclease, a transcription initiation factor, a variety of kinases, and a phosphatase (Table 1).
Figure 4.
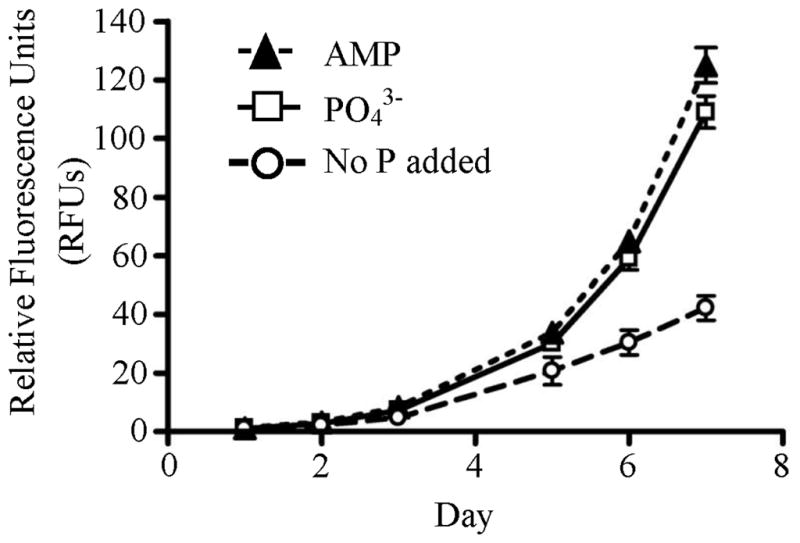
Growth of A. anophagefferens on different P sources: 50 μM phosphate (PO43−), 50 μM adenosine monophosphate (AMP) and a no P added control. RFUs (Relative Fluorescence Units) serve as a proxy for biomass. Error bars represent standard errors of the mean (n = 3).
Of 56 tags up-regulated two-fold or greater in the –N treatment, some mapped to genes involved in both DIN and DON metabolism (Table 2, Table S2). For example, tag 4223 mapped to an ammonium transporter and was up-regulated 10-fold in the –N library relative to the –P library and was absent from the control library (Table 2). Tag 3830 mapped to an acetamidase/formamidase that was up-regulated 11-fold in the –N library relative to the –P library and was up-regulated roughly 2-fold in the –N library relative to the control. Tag 17565 mapped to a xanthine/uracil/vitamin C permease and was only present in the –N library (Table 2). There were also tags that mapped to genes involved in protein metabolism, including two peptidases (tags 5832 and 3352), and an N-acetylglucoasmine transferase (Tag 17579) (Table 2). Finally, a variety of tags showed up-regulation in –N with less clear roles in N metabolism, including an arylsulfatase, phosphoglycerate dehydrogenase, a dynein heavy chain, and DNA-directed RNA polymerase.
Table 2.
Successfully annotated tags showing up-regulation in the –N library. Only tags that show greater than two-fold change in the –N library relative to the control and –P libraries with an R-value > 2 are included. A protein ID is given for: 1) tags that map directly to the genome where a gene model exists, or 2) tags that map to an EST that overlaps with a gene model on the genome. ESTs are given for tags annotated by mapping to an EST.
| Tag ID | Tag sequence | R-value | Fold change versus: | Putative annotation | EST | Protein ID | |
|---|---|---|---|---|---|---|---|
| Control | -P | ||||||
| 4223 | CATGGACGACTCGAAGCACGG | 4.742 | Absent1 | 10.3 | Ammonium transporter (manually curated)2 | - | 52202 |
| 11372 | CATGTATCCCCTGAGAACTGG | 3.159 | 6.1 | Absent | Dynein-1-beta heavy chain, flagellar inner arm I1 complex [Chlamydomonas reinhardtii] | - | 72661 |
| 3447 | CATGGCCGACGCGGGCGAGGT | 2.892 | 5.9 | 6.1 | DEAD (Asp-Glu-Ala-Asp) box polypeptide 46 [G. gallus] | - | 65005 |
| 5832 | CATGACGAAGTAGTACTTGCC | 2.772 | 5.4 | 3.0 | Peptidase [Salinibacter ruber DSM 13855] | EH117491 | - |
| 2091 | CATGGGCCCCCACGAGCGCGA | 2.643 | 3.6 | 5.0 | D-3-phosphoglycerate dehydrogenase [Thalassiosira pseudonana CCMP1335] | 4211036:1 | - |
| 17565 | CATGCTCTTCCACCTCGGCCT | 2.586 | Absent | Absent | Xanthine/uracil/vitamin C permease [Micromonas sp. RCC299] | - | 52593 |
| 17581 | CATGGAGCTCTGGCTCGCCGC | 2.586 | Absent | Absent | Arylsulfatase (manually curated) | - | 644463 |
| 3890 | CATGGTCGGCTACGGTGGCGG | 2.426 | 3.2 | 6.5 | Pherophorin-dz1 protein [Volvox carteri f. nagariensis] | 4210976:3 | - |
| 6403 | CATGCATCACTTTGGACTAAT | 2.358 | 2.7 | Absent | DNA-directed RNA polymerase II 135 kDa polypeptide, putative, expressed [Oryza sativa (japonica cultivar-group)] | - | 38738 |
| 3830 | CATGTCGATAGAATCCAATGG | 2.291 | 2.3 | 11.2 | Acetamidase/formamidase (manually curated) | - | 37987 |
| 3345 | CATGCAGGCCGTCGGTCTCTG | 2.238 | 2.0 | 11.2 | NADPH protochlorophyllide reductase [Bigelowiella natans] | 4207500:1 | - |
| 3352 | CATGGGCCCCGGCCGCCGCCG | 2.121 | 3.1 | Absent | Peptidase M16A, coenzyme PQQ biosynthesis protein PqqF [Medicago truncatula] | - | 22177 |
| 17579 | CATGTTCTCCGCGTCGTGGCT | 2.069 | Absent | Absent | O-linked N-acetylglucosamine (GlcNAc) transferase [Danio rerio] | - | 32337 |
| 5046 | CATGAAGGTGGCCGAGGCCCT | 2.003 | 2.1 | 10.3 | Poly A binding protein, cytoplasmic 1 a [Danio rerio] | - | 70409 |
Fold change cannot be calculated on tags absent from a given library, but are included in the table with R-value > 2.
Manually curated notes the gene model was manually assigned a function and reviewed by a curator.
Tag maps 3’ of gene model, but does not overlap.
There are 34 tags that can be considered to be related to a general stress response because they are up-regulated in both –P and –N relative to the control (Table S3). Two tags (10695 and 1839) mapped to two different oxidoreductases (Table 3). Tag 10695 showed strong up-regulation in both –P (14.6-fold) and –N (17.7-fold) relative to the control (Table 3). Tag 1839 also showed up-regulation in both –P and –N, with a 3-fold increase in –P and 2-fold increase in –N relative to the control (Table 3). Additionally, three tags (1814, 2687, and 922) mapped to three different proteins involved in light harvesting, with all three tags showing similar magnitudes of up-regulation (Table 3).
Table 3.
Successfully annotated tags showing greater than two-fold up-regulation in both the –N and –P libraries relative to the control library (R-value >2). A protein ID is given for: 1) tags that map directly to the genome where a gene model exists, or 2) tags that map to an EST that overlaps with a gene model on the genome. ESTs are given for tags annotated by mapping to an EST.
| Tag ID | Sequence | R-value | Fold change for: | Putative annotation | EST | Protein ID | |
|---|---|---|---|---|---|---|---|
| -P | -N | ||||||
| 1814 | CATGATGGGCGTCACGGGCGC | 15.58 | 4.8 | 3.2 | Chloroplast light harvesting protein isoform 3 [Isochrysis galbana] | - | 59955 |
| 10695 | CATGGAGGAGGTCAACCTCCT | 3.940 | 14.6 | 17.6 | Contains oxidoreductase domain | - | 72519 |
| 2687 | CATGTTCGGCGAGGGCCAGAC | 3.834 | 4.4 | 2.7 | Plastid light harvesting protein isoform 39 (manually curated)1 | - | 77828 |
| 922 | CATGCCGGCGGCCGTGCCGGG | 3.401 | 3.6 | 3.9 | Fucoxanthin chlorophyll a/c protein, deviant [Phaeodactylum tricornutum CCAP 1055/1] | 4208996:1 | - |
| 1894 | CATGCTCGGGCTCGCGCACGC | 3.327 | 7.8 | 3.6 | Glycosyl transferase group 1 [Herpetosiphon aurantiacus ATCC 23779] | 4211177:45 | - |
| 1481 | CATGGCCCGCAGCGACCTCCA | 3.276 | 2.3 | 5.4 | Sensory transduction histidine kinase [Psychroflexus torquis ATCC 700755] | - | 71871 |
| 1839 | CATGCCCGACTACACCAAGTC | 3.041 | 3.4 | 2.0 | Oxidoreductase, acting on the aldehyde or oxo group of donors, disulfide as acceptor / pyruvate dehydrogenase (acetyl-transferring) [Arabidopsis thaliana] | - | 53060 |
| 1951 | CATGTTCCTGTCGCTCGACGT | 3.026 | 16.0 | 6.8 | Cation efflux system protein [Oceanicola batsensis HTCC2597] | 4211177:393 | - |
| 6839 | CATGGTCGGCGGCATCGACGA | 3.026 | 16.0 | 6.8 | RecName: Full=ATP synthase subunit beta, mitochondrial; Flags: Precursor | 4206114:1 | - |
| 3296 | CATGCCGACGCCGCGCGCGCT | 2.610 | Absent2 | Absent | PREDICTED: similar to dishevelled-associated activator of morphogenesis 1 isoform 1 [Danio rerio] | - | 70943 |
| 1941 | CATGTGGATGCAAGCGGCTGC | 2.580 | 3.3 | 3.7 | Glutaminyl-tRNA synthetase, putative [Perkinsus marinus ATCC 50983] | 4211177:152 | - |
| 2546 | CATGGCGCGGTACCAGATCGG | 2.057 | 7.3 | 2.7 | O-methyltransferase, putative [Streptomyces ghanaensis ATCC 14672] | 4211177:220 | - |
Manually curated notes the gene model was manually assigned a function and reviewed by a curator.
Fold change cannot be calculated on tags absent from a given library, but are included in the table with R-value > 2.
The final category contains tags that were down-regulated in both –N and –P, which consists of 73 tags (Table S4). This may also be the result of a general stress response. Tags in this category were down-regulated two-fold or greater in the –P and –N libraries relative to the control with an R value ≥ 2. Two tags mapped to genes with known roles in DIN metabolism. Tag 4684 mapped to a nitrite reductase while tag 4697 mapped to a nitrate transporter (Table 4). Also in this category is tag 2, a highly expressed tag that mapped to polyubiquitin, and other tags that mapped to genes related to general metabolism (Table 4).
Some tags mapped to genes with known roles in N and P metabolism, but did not meet the criteria for differential regulation. For example, tag 113 mapped to a putative urea transporter and shows similar expression in the –N and control, compared to a depressed signal under –P (data not shown). Other tags that mapped to genes with known roles in nutrient metabolism included, but are not limited to, a variety of N substrate transporters, nitrate reductase, and urease (Figure 5).
Figure 5.

Schematic of N and P acquisition/metabolism genes identified in A. anophagefferens with Long-SAGE data. Putative N-related transporter localizations are based upon a previous study (Berg et al 2008). Localizations of P-related genes are for clarity of the figure only. Genes are in italics, with bold indicating the presence of a tag that is up-regulated in either the nitrogen-deficient (–N) or phosphorus-deficient (–P) library. AMT, FMD, XUV, and PEP are up-regulated in the –N library while PHO, NTD, and PTA are up-regulated in the –P library. NRT and NII are down-regulated in both –N and –P libraries. Other expressed genes include NAR (tag 381: CATGGTCCTCAACGACGCGAC), NIA (tag 11818: CATGTAATTCACGAAGGTCGG), DUR (tag 113: CATGCTAACTTGTATAATAAT), URE (tag 2023: CATGGTCCTCAACGACGCGAC), AOT (tag 31113: CATGTCGCTGACGGGCAACGT), CYN (tag 2141: CATGCGCCGCCAGTAGCGGGT) and GS (tag 18182: CATGTCCTGCAACCCCTACCT). Gene names are as follows: NRT, nitrate transporter; NAR, formate/nitrite transporter; AMT, ammonium transporter; DUR, urea transporter; AOT, amino acid transporter; XUV, xanthine/uracil/vitaminC transporter; NIA, nitrate reductase; NII, nitrite reductase; URE, urease; FMD, acetamidase/formamidase; CYN, cyanase; GS, glutamine synthetase; PEP, peptidase; PHO, phosphatase/alkaline phosphatase; NTD, 5’-nucleotidase; PTA, phosphate transporter.
Discussion
As a consequence of its devastating effects to the coastal ecosystem and commercial shellfishing industries, A. anophagefferens has become a widely studied HAB species (as reviewed in Gobler et al. 2005, Sunda et al. 2006). Nutrient supply is considered an important factor that may drive brown tide dynamics, and it is hypothesized that A. anophagefferens will use reduced N and DON under nitrate deficient conditions. A. anophagefferens may also switch to growth on DOP under phosphate deficient conditions. In this study, Long-SAGE was used to profile the A. anophagefferens transcriptome under N and P-deficient and nutrient replete (control) conditions with the goal of gaining a better understanding of the molecular mechanisms underlying N and P metabolism in A. anophagefferens and to examine molecular level evidence of switching from growth on inorganic nutrients to growth on organic matter at the onset of nutrient deficiency.
Long-SAGE and genome annotation
Here, 31,862 unique Long-SAGE tags have been identified and 11,847 (37.2 percent) of these tags mapped to the genome. As previously reviewed, these results are consistent with other Long-SAGE studies where on average, 36.5 percent of Long-SAGE tags can be mapped to the genome if it is available (Wang 2007). This may be explained by the fact that an exact match between the tag and genomic sequence is required, and there is most likely variation in the genomes of individual organisms, even of the same strain. Furthermore, if a tag is located at an intron/exon boundary, it will not map back to the genome. An individual tag may also map to multiple sites if two different genes have the same most 3’ Nla III restriction site and downstream sequence. A total of 1,045 (or 8.8 percent) of tags hit multiple sites, and were excluded from further analysis.
Despite these limitations and the fact that this study only covered a fraction of the transcriptome, these expression data have enhanced the A. anophagefferens genome annotation effort by assigning expression data to many genes, supporting in silico gene calls, and locating regions where genes may exist, but were not otherwise identified. For example, tag 1819 mapped to the genome in a location where both an EST and a gene model exist. In this example, expression data has been successfully assigned to this gene model, and the tag was successfully annotated as an inorganic phosphate transporter. Alternatively, Tag 1817 mapped to the genome in a location where a gene has been predicted (putative 5’-nucleotidase), but no EST support is available. In this case, the Long-SAGE tag has provided support for the in silico gene model prediction, and an annotation has been assigned to the tag. As a final example, tag 14,821 mapped to the genome where no gene model exists, and is located too far from the nearest gene model to be part of the 3’ untranslated region (UTR). This tag is found eight times exclusively in the –P library. This is a case where tag data have provided evidence for the existence of a gene that was not otherwise identified.
The Long-SAGE resulted in roughly 30,000 unique tags, and predicts the unique tag yield to be about 50,000 based on the frequency of unique tag recovery. If only one unique tag was sampled from every transcript, this would result in a transcriptome size of 50,000 genes, higher than the 11,510 gene models identified with in silico modeling with the genome sequence (http://genome.jgi-psf.org/Auran1/Auran1.home.html). However, transcriptome size estimates are often substantially elevated with Long-SAGE data because multiple unique tags can be generated for the same transcript at non-primary Nla III sites with incomplete restriction digests during library construction. This is likely the primary reason for the inflated gene number estimated here. However, this discrepancy is not entirely due to incomplete digestion, as tags (e.g. tag 14,821) mapped to the genome in regions where there was no gene model prediction. In Thalassiosira pseudonana, a tiling array (that is not restricted to the assumptions about gene content that is the case for traditional microarrays) identified 1,132 transcripts that were not present in the 11,390 modeled gene set (Mock et al. 2008). Here, Long-SAGE is similar in the ability to identify putative genes that were not detected with in silico gene modeling for the genome sequence, which highlights the value of these data types in supporting genome annotation efforts. Even with the relatively low depth of sampling in this study, it is apparent that highly expressed genes detectable in a low resolution dataset are missing from the gene models predicted in the A. anophagefferens genome. With advances in sequencing technology, it is becoming possible to perform large-scale short-read sequencing of the transcriptome with exceptionally high coverage, and decreasing cost. The application of these techniques will be valuable for helping to support future genome annotation efforts as well as discovering novel genes (Morozova et al. 2009).
Responses to P deficiency
A strong transcriptional response was observed in the –P library. A number of these –P tags mapped to genes with known roles in both inorganic and organic P metabolism. One of the most highly P-regulated tags (R value > 20) mapped to a putative inorganic phosphate transporter. This would suggest that one strategy employed by A. anophagefferens during P deficiency is to produce more phosphate transporters, or switch to a more efficient one. This strategy has been observed in other eukaryotic algae (Chung et al. 2003, Dyhrman et al. 2006).
Two tags (6248 and 1817) up-regulated in the –P library mapped to two different 5’-nucleotidases. This enzyme cleaves phosphorus from nucleotides and has been suggested to be involved in P-scavenging from exogenous nucleotides in other eukaryotic algae (Dyhrman and Palenik 2003, Flynn et al. 1986). In the ocean, nucleotides can be released from cells by grazing or lysis and may represent a major source of P, with concentrations reaching 10–20 nM (Ammerman and Azam 1985). A. anophagefferens can grow well on AMP as its sole P source, indicating that nucleotides may be an important P source for field populations. Although both of the tags mapping to the 5’-nucleotidase are generally up-regulated in the –P library, the intensity and pattern of their regulation is distinct and they could be serving different functions within the cell.
Tag 4828 is significantly up-regulated in the –P library and mapped to an EST that aligns with a gene model for alkaline phosphatase in the A. anophagefferens genome. This enzyme is known to cleave phosphorus from a variety of DOP compounds and has been shown to be induced under P limitation in other algae (Dyhrman and Palenik 1999, 2003, Landry et al. 2006, Xu et al. 2006). Algal alkaline phosphatases can be difficult to identify, for example the E. huxleyi alkaline phosphatase (Landry et al. 2006, Xu et al. 2006) has no database homology. The putative A. anophagefferens alkaline phosphatase is similar to the alkaline phosphatase identified in the T. pseudonana genome.
The presence and up-regulation of tags mapping to genes related to DOP hydrolysis suggests that A. anophagefferens has the ability to utilize P-ester, (especially 5’nucleotides) and perhaps other DOP compounds when DIP is low. This hypothesis is consistent with field observations of significant reductions in DOP concentration during the peak of brown tides, when A. anophagefferens cell densities exceed 106 cells ml−1 in New York estuaries (Gobler et al. 2004). Given the lack of studies on A. anophagefferens P physiology, these observations warrant further investigation using a semi-continuous or continuous culture study to differentiate short-term responses to P deficiency, examined herein, from the long-term acclimation strategies that may be more indicative of natural populations.
Responses to N deficiency
Under N-deficient conditions, A. anophagefferens up-regulates a number of genes putatively involved in N acquisition. Tag 4223 is up-regulated 15-fold in the –N library and mapped to an EST that shows sequence homology to characterized ammonium transporters in the diatom Cylindrotheca fusiformis. The ammonium transporters in C. fusiformis are transcriptionally regulated, with highest mRNA copies in N-deficient cells (Hildebrand 2005), consistent with the pattern observed herein. A. anophagefferens has several ammonium transporters, and this ammonium transporter is different than the one previously shown to be up-regulated under N-deficient conditions in A. anophagefferens (Berg et al. 2008). Clearly, A. anophagefferens up-regulates a variety of ammonium transporters in response to N deficiency, which is consistent with the preference for reduced N observed in low nitrate field populations (Gobler et al. 2005).
Past studies have shown that A. anophagefferens can hydrolyze proteins, and grow well on DON, such as aminosugars, urea, and amino acids, as a sole N source (Berg et al. 2002, 2003, Mulholland et al. 2002). It has also been reported to grow on small amides as a sole N source, including acetamide and, to a lesser extent, formamide (Berg et al. 2008). This is consistent with other studies which identified that dinoflagellates, coccolithophores, and diatoms grow on acetamide, and that coccolithophores grow well on formamide (Palenik and Henson 1997). Tag 3830, which mapped to an acetamidase/formamidase is up-regulated in the –N library, which suggests that A. anophagefferens can break down these small amides, and that this process is regulated by N deficiency. Increased activities of acetamidase and formamidase were detected in N-deficient E. huxleyi (Palenik and Henson 1997), which is consistent with the transcript regulation observed herein. The sources and concentrations of amides in marine systems are poorly understood, but they may serve as N sources for field populations, especially those experiencing N deficiency. A. anophagefferens also up-regulates a putative Xanthine/Uracil/Vitamin C permease. In a tiling array experiment with Thalassiosira pseudonana, a putative Xanthine/Uracil/Vitamin C permease was also shown to be up-regulated under N-deficient conditions (Mock et al. 2008). Due to the broad annotation it is difficult to determine the function of this gene in A. anophagefferens. Uric acid permeases have been shown to promote the uptake of uric acid into cells of Bacillus subtilis in N-deficient conditions (Schultz 2001). This gene may be serving a similar role in A. anophagefferens. Two tags mapping to putative peptidases were identified in the Long-SAGE libraries, with higher expression in the –N library relative to the –P library. Given their regulation pattern, these peptidases may serve to scavenge N from peptides, although peptidases serve many roles in a cell besides N scavenging from proteins. Further, there is a tag up-regulated in the –N library that mapped to an N-acetylglucosamine transferase. O-GlcNAcylation (mediated by N-acetylglucosamine transferase) has been shown to affect protein activity, stability, and localization and this, taken together with the up-regulation of the peptidases, suggests an increased protein metabolism and protein processing during N deficiency. Whether this is related to recycling of N inside the cell, or the acquisition of N from proteins or peptides from seawater, deserves further study.
It should be noted that both control and –N treatments consisted of nitrate as the primary N-source. In the diatom C. fusiformis, ammonia transporters are transcriptionally regulated with highest mRNA copies in N-starved cells, followed by cells grown on NO3− only, and lowest mRNA copies in ammonium-grown cells (Hildebrand 2005), suggesting negative regulation by ammonium. In A. anophagefferens, it has been shown that certain genes involved in N-metabolism can be transcriptionally regulated by N-source (Berg et al. 2008). It may be possible that a stronger global transcriptional response would be seen if A. anophagefferens had been grown on ammonia, rather than nitrate, as the primary N-source in the control library. Regardless, these data support the observation that A. anophagefferens can utilize a wide variety of N sources and switches to these N sources (including reduced and organic forms) at the onset of N deficiency. As discussed with P-regulated genes, additional culture studies could be used to identify if these responses are related to acclimation to N deficiency.
General stress response
A number of tags were up-regulated in response to both P and N deficiency, possibly as part of a general stress response. Interestingly, three tags (1814, 2687, and 922) mapped to proteins involved in light harvesting. Regulation of these gene families in other algae is variable. In the coccolithophore Emiliania huxleyi, a Long-SAGE study showed down-regulation of a fucoxanthin chlorophyll a/c binding (fcp) protein under N starvation (Dyhrman et al. 2006), and in diatoms genes encoding fcp and LHC-like proteins were significantly up-regulated in Fe-limited conditions (Allen et al. 2008). In the case of A. anophagefferns, it may be that there is broad down-regulation of many genes under stress, and that this down regulation is not as strong, or not as rapid for light harvesting related machinery. In fact, a number of tags were down-regulated in both –N and –P libraries, and have highest copy numbers in the control library. Owing to the fact that it requires resources to actively express genes, this down-regulation may be driven by a global stress response to conserve resources. A more detailed time-course study that quantifies RNA levels, and includes an Fe-deficient condition would examine the consistency of the regulation on genes encoding proteins related to light harvesting.
Tag 2 mapped to a ubiquitin gene and is expressed at a high copy number in the control library, but is down-regulated in both –N and –P libraries. Ubiquitin is a protein involved in post-translational modification of proteins, usually targeting them for proteosomal destruction (Hershko and Heller 1985). A high expression of this protein in nutrient replete, exponentially growing, A. anophagefferens cultures suggests changes in protein turn-over relative to the other treatments, and that this pathway is responsive to general stress. In the group of tags elevated in the control library, one tag (4684) mapped to a nitrite reductase while tag 4697 mapped to a nitrate transporter. Another targeted gene expression study of this species showed up-regulation of this same nitrate transporter under acute N deficiency (25 days in low N medium) compared to A. anophagefferens grown on acetamide as the sole N source (Berg et al. 2008). Berg et al. (2008) also demonstrated that the nitrate transporter gene was induced by nitrate. In the Long-SAGE study presented here, nitrate was used as the N source for all treatments, and nitrate replete expression patterns (control) were compared to cells grown roughly 8 days in low nitrate medium (–N), which may explain some of the differences. Nevertheless, these data indicate that the nitrate transporter expression is sensitive to both total N concentration as well as nitrate concentration. Therefore, the regulation patterns observed in the Long-SAGE libraries may be controlled by a combination of growth on nitrate and total N availability.
This is the first transcriptional data to examine general stress responses in a Pelgophyte. These transcriptional data suggest that under stress conditions, such as N and P deficiency, A. anophagefferens may broadly down-regulate many genes involved in general metabolism, while maintaining light harvesting capability. However, the lack of tags mapping to genes encoding heat shock proteins, chaperons and other markers of a cellular stress response, indicates that higher resolution sampling is required to detect a comprehensive stress response transcriptome.
Non-differentially expressed genes
In addition to transcripts discussed above, a number of tags mapped to genes with known roles in N and P metabolism. These remaining tags of interest are all at too low a copy number to resolve differential expression patterns. This includes tags that mapped to transporters for compounds known to be utilized as an N-source by A. anophagefferens, including nitrate, ammonium, urea, and amino acids (Figure 5). There was also a tag that mapped to a formate/nitrite transporter, although it is unclear whether A. anophagefferens can utilize nitrite as a sole N source (Figure 5). Finally, tags that mapped to the enzymes nitrite reductase, nitrate reductase, glutamine synthetase, urease, and cyanase were found (Figure 5). The expression data of these N-related genes are consistent with data from A. anophagefferens EST libraries (Berg et al. 2008), and given that the Long-SAGE data is detecting the most highly expressed genes, it also indicates that these genes are highly expressed in the cells. The cyanase is included as related to N metabolism because cyanase hydrolyzes cyanate into ammonium and carbon dioxide, and has been shown to play an important role in scavenging N from cyanate in cyanobacteria (Kamennaya et al. 2008). The Long-SAGE results suggest that cyanase is expressed, but not regulated by N in A. anophagefferens, however a targeted study would address this with more sensitivity than afforded by the current analysis.
In this set of N metabolism transcripts, tag 113 mapped to an EST with sequence homology to a high affinity urea transporter from the picoeukaryote Ostreococcus tauri (Derelle et al. 2006). This tag is expressed under nutrient replete and –N conditions, but down-regulated under P deficiency. The same urea transporter has been shown to be up-regulated under acute N deficiency (Berg et al. 2008). This difference may be explained by the fact that Long-SAGE is not as sensitive as quantitative RT-PCR at the depth of sequencing in this study, or that cells in the Berg et al. 2008 study were grown on acetamide, not nitrate. Regardless, both evidence from quantitative RT-PCR and Long-SAGE support the hypothesis that A. anophagefferens is able to scavenge urea from the environment. Consistent with this finding, several culture studies have demonstrated that A. anophagefferens can grow equally well on both urea and nitrate as an N source (MacIntyre et al. 2004, Pustizzi et al. 2004) and that urea enrichments can stimulate A. anophagefferens blooms in situ (Kana et al. 2004).
Conclusions
The goal of this study was to examine the transcriptome of A. anophagefferens under varying environmental conditions (such as –N or –P), to elucidate the broad-scale responses of this organism to nutrient deficiency, and to gain a better understanding of the metabolic pathways involved in nutrient acquisition. Many of the tags that are most highly up-regulated in the –N and –P library mapped to predicted or hypothetical genes, or areas of the genome where no gene model exists (Tables S1-S3). This underscores how little is known about the genes and pathways of nutrient metabolism in this Pelagophyte and the importance of further studies focused on characterizing these genes and their function. However, this study supports the hypothesis that A. anophagefferens can metabolize reduced or organic forms of N and P when inorganic nutrients are not available. A. anophagefferens expresses and regulates a suite of genes related to N acquisition/metabolism, including the genes necessary for growth on a variety of N compounds (Figure 5). This is consistent with observations from both culture and field data (Lomas et al. 1996, Berg et al. 1997, 2002, 2003, Mulholland et al. 2002, Kana et al. 2004, MacIntyre et al. 2004, Pustizzi et al. 2004). A. anophagefferens also expresses genes involved in both DIP and DOP uptake and metabolism, and these appear to be highly up-regulated under P deficiency (Figure 5). Very little is known about how P influences A. anophagefferens blooms, but the results indicate that DOP could be important to the P nutrition of this species adding further evidence for the importance of organic nutrients in fueling the growth of this harmful species in sensitive coastal regions.
These data have identified gene targets with expression patterns that are indicative of a switch to growth on organic nutrients. As such, monitoring the quantitative expression of these gene targets may serve as a tool for examining N and P deficiency in natural populations over the course of a bloom cycle, ultimately providing a much needed link between nutrient supply and A. anophagefferens bloom dynamics.
Experimental procedures
Culture conditions
Aureococcus anophagefferens CCMP 1984 was obtained from the Provasoli-Guillard Center for the Culture of Marine Phytoplankton (CCMP). The cultures were grown in batch to examine the instantaneous transcriptome response of A. anophagefferens to nutrient deficiency at 18°C on a 14 h:10 h light:dark cycle (140 μmol quanta m−2 s−1). Nitrogen- and phosphate-replete (883 μM NO3− and 36.3 μM PO43−) cells, –N (40 μM NO3−) cells, and –P (1 μM PO43−) cells were grown in autoclaved L1 media with no Si (Guillard and Hargraves 1993), prepared using 0.2 μm filtered Vineyard Sound seawater. Vitamins (thiamine, biotin, and B12) were sterile filtered and added to the media after autoclaving. The growth of the cultures was monitored daily by cell counts on a hemacytometer. Replete cells were harvested during mid log phase of growth, while –N and –P cells were harvested at the onset of stationary phase when N or P was depleted (Figure 1). With additions of N (883 μM NO3−) or P (36.3 μM PO43−) to the nutrient-depleted treatments, the cells resumed exponential growth (data not shown). To test whether A. anophagefferens can grow on AMP, an additional culture experiment was performed. A. anophagefferens was grown in L1 media with no Si as described above with the following changes: In the PO43− treatment, cells were grown in media containing (36.3 μM PO43−). For the AMP treatment, cells were grown in media containing no added PO43−, but instead contained AMP at a concentration of 36.3 μM. Media with no added P was used as a control and growth was monitored with a Turner Designs fluorometer.
Total RNA extraction
Approximately 2 × 10⁷ cells were harvested (8,000 x g for 10 minutes) from each treatment and immediately stored in liquid nitrogen until extraction. Total RNA was extracted using TRI reagent (Sigma, St. Louis, MO) according to the manufacturer’s instructions. RNA concentrations were quantified with a UV spectrophotometer. Integrity of the total RNA was assessed by 1% (wt/vol) agarose gel electrophoresis.
Long-SAGE library construction
Long-SAGE libraries were constructed using approximately 30 μg RNA isolated from extractions of replete (control), –P, and –N A. anophagefferens cells following the I-SAGE Long kit protocol (Invitrogen, Carlsbad, CA). Recombinant pZEro1 clones produced by Long-SAGE were purified using GeneMachines RevPrep Orbit (Genomic Solutions, Ann Arbor, MI) and were sequenced on an ABI 3730xl DNA sequencer (Applied Biosystems, Foster City, CA). The sequences collected were analyzed with software created at the Marine Biological Laboratory specifically for SAGE analysis and used in the context of previous work (Dyhrman et al. 2006). The SAGE software extracts ditag sequences from the ABI 3730xl results according to the Long-SAGE sequence grammar, parses out individual Long-SAGE tags, excludes tags with sequence ambiguities, and reduces all Long-SAGE tags to a look-up table of unique Long-SAGE tag sequences and their observed frequencies among all of the A. anophagefferens Long-SAGE libraries. All Long-SAGE tags were mapped to sequence data (see below) for annotation, but those tags found only once (singletons) were excluded from differential expression analysis.
Tags were annotated by mapping to A. anophagefferens ESTs on GenBank (http://www.ncbi.nlm.nih.gov), or the unpublished A. anophagefferens genome data sequenced by the DOE Joint Genome (JGI) Institute and located on their portal page (http://www.jgi.doe.gov/Aureococcus). Since Long-SAGE tags are short (21bp), an exact match was required. Tags mapping to the genome were annotated based on their overlap or proximity to gene models. ESTs specific to A. anophagefferens were used to help annotate tags in which a gene model could not be assigned, or for tags that did not map to the genome sequence, but did map to ESTs. These ESTs were assembled into clusters and blasted against GenBank using blastX to assign a putative function using an expect value cut-off of 1e-5.
Long-SAGE tags were scored for differential expression among the three libraries by using the R statistic (Stekel et al. 2000), a log likelihood ratio statistic which scores tags by their deviation from the null hypothesis of equal frequencies given the tag sampling depth for each Long-SAGE library. Higher scores represent a greater deviation from the null hypothesis, while scores close to zero represent near constitutive expression. To reduce the effects of sampling error in highlighting differential expression, only tags with an R value of 2 or greater are presented. Additionally, if more than one tag mapped to the same sequence, only the most 3’ tag was included here. The tag data discussed in this publication have been deposited in NCBI's Gene Expression Omnibus (Edgar et al., 2002) and are accessible through GEO Series accession number GSE21465 (http://www.ncbi.nlm.nih.gov/geo/query/acc.cgi?acc=GSE21465).
Supplementary Material
Acknowledgments
This paper is a result of research funded by the National Oceanic and Atmospheric Administration Center for Sponsored Coastal Ocean Research under award NA09NOS4780206 to WHOI. ECOHAB publication number 614. Further support came from funds from the Woods Hole Oceanographic Institution, the Woods Hole Center for Oceans and Human Health and the Woods Hole Coastal Ocean Institute, a STAR Research Assistance Agreement No. R-83041501-0 awarded by the U.S. Environmental Protection Agency, as well as an EPA STAR fellowship (STAR Fellowship assistance agreement number FP916901). We would like to thank the Joint Genome Institute (JGI) and the Aureococcus genome consortium. The Aurecoccus genome sequencing and analysis were performed under the auspices of the US Department of Energy's Office of Science, Biological and Environmental Research Program, and by the University of California, Lawrence Berkeley National Laboratory under contract No. DE-AC02-05CH11231, Lawrence Livermore National Laboratory under Contract No. DE-AC52-07NA27344, and Los Alamos National Laboratory under contract No. DE-AC02-06NA25396. We would also like to thank the Marine Biological Laboratory’s Josephine Bay Paul Center for sequencing and informatics assistance, particularly Shanda Birkeland and Andrew McArthur. Finally, we thank Alan Kuo, Astrid Terry, and Igor Grigoriev from the JGI for their efforts on the Aureococcus anophagefferens genome annotation as well as informatics supporting this study.
References
- Allen AE, LaRoche J, Maheswari U, Lommer M, Schauer N, Lopez PJ, et al. Whole-cell response of the pennate diatom Phaeodactylum tricornutum to iron starvation. Proc Nat Acad Sci USA. 2008;105:10438–10443. doi: 10.1073/pnas.0711370105. [DOI] [PMC free article] [PubMed] [Google Scholar]
- Ammerman JW, Azam F. Bacterial 5’-nucleotidase in aquatic ecosystems – a novel mechanism of phosphorus regeneration. Science. 1985;227:1338–1340. doi: 10.1126/science.227.4692.1338. [DOI] [PubMed] [Google Scholar]
- Anderson DM, Burkholder JM, Cochlan WP, Glibert PM, Gobler CJ, Heil CA, et al. Harmful algal blooms and eutrophication: Examining linkages from selected coastal regions of the United States. Harmful Algae. 2008;8:39–53. doi: 10.1016/j.hal.2008.08.017. [DOI] [PMC free article] [PubMed] [Google Scholar]
- Berg GM, Glibert PM, Lomas MW, Burford MA. Organic nitrogen uptake and growth by the chrysophyte Aureococcus anophagefferens during a brown tide event. Mar Biol. 1997;129:377–387. [Google Scholar]
- Berg GM, Repeta DJ, LaRoche J. Dissolved organic nitrogen hydrolysis rates in axenic cultures of Aureococcus anophagefferens (Pelagophyceae): comparison with heterotrophic bacteria. Appl Environ Microbiol. 2002;68:401–404. doi: 10.1128/AEM.68.1.401-404.2002. [DOI] [PMC free article] [PubMed] [Google Scholar]
- Berg GM, Repeta DJ, LaRoche J. The role of the picoeukaryote Aureococcus anophagefferens in cycling of marine high-molecular weight dissolved organic nitrogen. Limnol Oceanogr. 2003;48:1825–1830. [Google Scholar]
- Berg GM, Shrager J, Glockner G, Arrigo KR, Grossman AR. Understanding nitrogen limitation in Aureococcus anophagefferens (Pelagophyceae) through cDNA and qRT-PCR analysis. J Phycol. 2008;44:1235–1249. doi: 10.1111/j.1529-8817.2008.00571.x. [DOI] [PubMed] [Google Scholar]
- Chung CC, Hwang SPL, Chang J. Identification of a high affinity phosphate transporter gene in a prasinophyte alga, Tetraselmis chui, and its expression under nutrient limitation. Appl Environ Microbiol. 2003;69:754–759. doi: 10.1128/AEM.69.2.754-759.2003. [DOI] [PMC free article] [PubMed] [Google Scholar]
- Coyne KJ, Burkholder JM, Feldman RA, Hutchins DA, Cary SC. Modified serial analysis of gene expression method for construction of gene expression profiles of microbial eukaryotic species. Appl Environ Microbiol. 2004;70:5298–5304. doi: 10.1128/AEM.70.9.5298-5304.2004. [DOI] [PMC free article] [PubMed] [Google Scholar]
- Dennison WC, Marshall GJ, Wigand C. Effects of “brown tide” shading on eelgrass (Zostera marina) distributions. In: Cosper EM, Bricelj VM, Carpenter EJ, editors. Novel Phytoplankton Blooms: Causes and Impacts of Recurrent Brown Tides and Other Unusual Blooms. Vol. 35. Springer; New York: 1989. pp. 675–692. [Google Scholar]
- Derelle E, Ferraz C, Rombauts S, Rouze P, Worden AZ, Robbens S, et al. Genome analysis of the smallest free-living eukaryote, Ostreococcus tauri unveils many unique features. Proc Nat Acad Sci USA. 2006;103:11647–11652. doi: 10.1073/pnas.0604795103. [DOI] [PMC free article] [PubMed] [Google Scholar]
- Dyhrman ST, Palenik B. Phosphate stress in cultures and field populations of the dinoflagellate Prorocentrum minimum detected by a single-cell alkaline phosphatase assay. Appl Environ Microbiol. 1999;65:3205–3212. doi: 10.1128/aem.65.7.3205-3212.1999. [DOI] [PMC free article] [PubMed] [Google Scholar]
- Dyhrman ST, Palenik B. Characterization of ectoenzyme activity and phosphate-regulated proteins in the coccolithophorid Emiliania huxleyi. J Plankton Res. 2003;205:230–231. [Google Scholar]
- Dyhrman ST, Haley ST, Birkeland SR, Wurch LL, Cipriano MJ, McArthur AG. Long Serial Analysis of Gene Expression for gene discovery and transcriptome profiling in the widespread marine coccolithophore Emiliania huxleyi. Appl Environ Microbiol. 2006;72:252–260. doi: 10.1128/AEM.72.1.252-260.2006. [DOI] [PMC free article] [PubMed] [Google Scholar]
- Dyhrman ST. Molecular approaches to diagnosing nutritional physiology in harmful algae: Implications for studying the effects of eutrophication. Harmful Algae. 2008;8:167–174. [Google Scholar]
- Dzurica S, Lee C, Cosper EM, Carpenter EJ. Role of environmental variables, specifically organic compounds and nutrients, in the growth of the chrysophyte Aureococcus anophagefferens. In: Cosper EM, Bricelj VM, Carpenter EJ, editors. Novel Phytoplankton Blooms: Causes and Impacts of Recurrent Brown Tides and Other Unusual Blooms. Vol. 35. Springer; New York: 1989. pp. 229–252. [Google Scholar]
- Edgar R, Domrachev M, Lash AE. Gene Expression Omnibus: NCBI gene expression and hybridization array data repository. Nucleic Acids Res. 2002;30:207–210. doi: 10.1093/nar/30.1.207. [DOI] [PMC free article] [PubMed] [Google Scholar]
- Erdner DL, Anderson DM. Global transcriptional profiling in the toxic dinoflagellate Alexandrium fundyense using massively parallel signature sequencing. BMC Genomics. 2006;7:88. doi: 10.1186/1471-2164-7-88. [DOI] [PMC free article] [PubMed] [Google Scholar]
- Flynn KJ, Öpik H, Syrett PJ. Localization of the alkaline phosphatase and 5'-nucleotidase activities of the diatom Phaeodactylum tricornutum. J Gen Microbiol. 1986;132:289–298. [Google Scholar]
- Gobler CJ, Boneillo GE, Debenham C, Caron DA. Nutrient limitation, organic matter cycling, and plankton dynamics during an Aureococcus anophagefferens bloom in Great South Bay, N.Y. Aquat Microb Ecol. 2004;35:31–43. [Google Scholar]
- Gobler CJ, Lonsdale DJ, Boyer GL. A review of the causes, effects, and potential management of harmful brown tide blooms caused by Aureococcus anophagefferens (Hargraves et Sieburth) Estuaries. 2005;28:726–749. [Google Scholar]
- Gobler CJ, Renaghan MJ, Buck NJ. Impacts of nutrients and grazing mortality on the abundance of Aureococcus anophagefferens during a New York brown tide bloom. Limnol Oceanogr. 2002;47:129–141. [Google Scholar]
- Gobler CJ, Sañudo-Wilhelmy SA. Effects of organic carbon, organic nitrogen, inorganic nutrients, and iron additions on the growth of phytoplankton and bacteria during a brown tide bloom. Mar Ecol Prog Ser. 2001;209:19–34. [Google Scholar]
- Greenfield DI, Lonsdale DJ. Mortality and growth of juvenile hard clam Mercenaria mercenaria during brown tide. Mar Biol. 2002;141:1045–1050. [Google Scholar]
- Greenfield DI, Lonsdale DJ, Cerrato RM, Lopez GR. Effects of background concentrations of Aureococcus anophagefferens (brown tide) on growth and feeding in the bivalve Mercenaria mercenaria. Mar Ecol Prog Ser. 2004;274:171–181. [Google Scholar]
- Grossman A. Acclimation of Chlamydomonas reinhardtii to its nutrient environment. Protist. 2000;151:201–224. doi: 10.1078/1434-4610-00020. [DOI] [PubMed] [Google Scholar]
- Guillard RRL, Hargraves PE. Stichochrysis immobilis is a diatom, not a chrysophyte. Phycologia. 1993;32:234–236. [Google Scholar]
- Hershko A, Heller H. Occurrence of a polyubiquitin structure in ubiquitin-protein conjugates. Biochem Biophys Res Commun. 1985;128:1079–86. doi: 10.1016/0006-291x(85)91050-2. [DOI] [PubMed] [Google Scholar]
- Hildebrand M. Cloning and functional characterization of ammonium transporters from the marine diatom Cylindrotheca fusiformis. J Phycol. 2005;41:105–113. [Google Scholar]
- Irizarry RA, Warren D, Spencer F, Kim IF, Biswal S, Frank BC, et al. Multiple-laboratory comparison of microarray platforms. Nat Methods. 2005;2:477–477. doi: 10.1038/nmeth756. [DOI] [PubMed] [Google Scholar]
- Kana TM, Lomas MW, MacIntyre HL, Cornwell JC, Gobler CJ. Stimulation of the brwon tide organism, Aureococcus anophagefferens, by selective nutrient additions to in situ mesocosms. Harmful Algae. 2004;3:377–388. [Google Scholar]
- Keller AA, Rice RL. Effects of nutrient enrichment on natural populations of the brown tide phytoplankton Aureococcus anophagefferens (Chrysophyceae) J Phycol. 1989;25:636–646. [Google Scholar]
- Landry DM, Gaasterland T, Palenik BP. Molecular characterization of a phosphate-regulated cell-surface protein from the coccolithophorid, Emiliania huxleyi (Prymnesiophyceae) J Phycol. 2006;42:814–821. doi: 10.1111/j.1529-8817.2009.00693.x. [DOI] [PubMed] [Google Scholar]
- LaRoche J, Nuzzi R, Waters R, Wyman K, Falkowski PG, Wallace DWR. Brown tide blooms in Long Island’s coastal waters linked to variability in groundwater flow. Glob Change Biol. 1997;3:397–410. [Google Scholar]
- Lomas MW, Glibert PM, Berg GM. Characterization of nitrogen uptake by natural populations of Aureococcus anophagefferens (Chrysophyceae) as a function of incubation duration, substrate concentration, light, and temperature. J Phycol. 1996;32:907–916. [Google Scholar]
- Kamennaya NA, Chernihovsky M, Post AF. The cyanate utilization capacity of marine unicellular Cyanobacteria. Limnol Oceanogr. 2008;53:2485–2494. [Google Scholar]
- MacIntyre HL, Lomas MW, Cornwell JC, Suggett D, Gobler CJ, Koch E, Kana TM. Mediation of benthic-pelagic coupling by microphytobenthos: an energy and nutrient based model for initiation of blooms of Aureococcus anophagefferens. Harmful Algae. 2004;3:403–437. [Google Scholar]
- Mock T, Samanta MP, Iverson V, Berthiaume C, Robison M, Holtermann K, et al. Whole genome expression profiling of the marine diatom Thalassiosira pseudonana identifies genes involved in silicon bioprocesses. Proc Nat Acad Sci USA. 2008;105:1579–1584. doi: 10.1073/pnas.0707946105. [DOI] [PMC free article] [PubMed] [Google Scholar]
- Morozova O, Hirst M, Marra MA. Applications of new sequencing technologies for transcriptome analysis. Annu Rev Genomics Hum Genet. 2009;10:135–151. doi: 10.1146/annurev-genom-082908-145957. [DOI] [PubMed] [Google Scholar]
- Mulholland MR, Gobler CJ, Lee C. Peptide hydrolysis, amino acid oxidation and N uptake in communities seasonally dominated by Aureococcus anophagefferens. Limnol Oceanogr. 2002;47:1094–1108. [Google Scholar]
- Mulholland MR, Boneillo G, Minor EC. A comparison of N and C uptake during brown tide (Aureococcus anophagefferens) blooms from two coastal bays on the east coast of the USA. Harmful Algae. 2004;3:361–376. [Google Scholar]
- Palenik B, Grimwood J, Aerts A, Rouze P, Salamov A, Putnam N, et al. The tiny eukaryote Ostreococcus provides genomic insights into the paradox of plankton speciation. Proc Nat Acad Sci USA. 2007;104:7705–7710. doi: 10.1073/pnas.0611046104. [DOI] [PMC free article] [PubMed] [Google Scholar]
- Palenik B, Henson SE. The use of amides and other nitrogen sources by the phytoplankton Emiliania huxleyi. Limnol Oceanogr. 1997;42:1544–1551. [Google Scholar]
- Pustizzi F, MacIntyre HL, Warner ME, Hutchins DA. Interaction of nitrogen source and light intensity on the growth and photosynthesis of the brown tide alga Aureococcus anophagefferens. Harmful Algae. 2004;3:343–360. [Google Scholar]
- Saha S, Sparks AB, Rago C, Akmaev V. Using the transcriptome to annotate the genome. Nat Biotechnol. 2002;19:508–512. doi: 10.1038/nbt0502-508. [DOI] [PubMed] [Google Scholar]
- Schultz AC, Nygaard P, Saxild HH. Functional analysis of 14 genes that constitute the purine catabolic pathway in Bacillus subtilis and evidence for a novel regulon controlled by the PucR transcription activator. J Bacteriol. 2001;183:3293–3302. doi: 10.1128/JB.183.11.3293-3302.2001. [DOI] [PMC free article] [PubMed] [Google Scholar]
- Stekel DJ, Git Y, Falciani F. The comparison of gene expression from multiple cDNA libraries. Genome Res. 2000;10:2055–2061. doi: 10.1101/gr.gr-1325rr. [DOI] [PMC free article] [PubMed] [Google Scholar]
- Sunda WG, Graneli E, Gobler CJ. Positive feedback and the development and persistence of ecosystem disruptive algal blooms. J Phycol. 2006;42:963–974. [Google Scholar]
- Velculescu VE, Zhang L, Vogelstein B, Kinzler KW. Serial analysis of gene expression. Science. 1995;270:484–487. doi: 10.1126/science.270.5235.484. [DOI] [PubMed] [Google Scholar]
- Wang SM. Understanding SAGE data. Trends Genet. 2007;23:42–50. doi: 10.1016/j.tig.2006.11.001. [DOI] [PubMed] [Google Scholar]
- Xu Y, Wahlund TM, Feng L, Shaked Y, Morel FMM. A novel alkaline phosphatase in the coccolithophore Emiliania huxleyi (Prymnesiophyceae) and its regulation by phosphorus. J Phycol. 2006;42:835–844. [Google Scholar]
- Zuker M. Mfold web server for nucleic acid folding and hybridization prediction. Nucleic Acids Res. 2003;31:3406–15. doi: 10.1093/nar/gkg595. [DOI] [PMC free article] [PubMed] [Google Scholar]
Associated Data
This section collects any data citations, data availability statements, or supplementary materials included in this article.