

Abstract
Many pathogenic Gram-negative bacteria use a type III secretion system (T3SS) to deliver effector proteins into the host cell where they reprogram host defenses and facilitate pathogenesis. The first 20–30 N-terminal residues usually contain the ‘secretion signal’ that targets effector proteins for translocation, however, a consensus sequence motif has never been discerned. Recent machine-learning approaches, such as support vector machine (SVM)-based Identification and Evaluation of Virulence Effectors (SIEVE), have improved the ability to identify effector proteins from genomics sequence information. While these methods all suggest that the T3SS secretion signal has a characteristic amino acid composition bias, it is still unclear if the amino acid pattern is important and if there are any unifying structural properties that direct recognition. To address these issues a peptide corresponding to the secretion signal for Salmonella enterica serovar Typhimurium effector SseJ was synthesized (residues 1–30, SseJ) along with scrambled peptides of the same amino acid composition that produced high (SseJ-H) and low (SseJ-L) SIEVE scores. The secretion properties of these three peptides were tested using a secretion signal–CyaA fusion assay and their structural properties probed using circular dichroism, nuclear magnetic resonance, and ion mobility spectrometry–mass spectrometry. The secretion predictions from SIEVE matched signal–CyaA fusion experimental results with J774 macrophages suggesting that the SseJ secretion signal has some sequence order dependence. The structural studies showed that the SseJ, SseJ-H, and SseJ-L peptides were intrinsically disordered in aqueous solution with a small predisposition to adopt nascent helical structure only in the presence of structure stabilizing agents such as 1,1,1,3,3,3-hexafluoroisopropanol. Intrinsic disorder may be a universal feature of effector secretion signals as similar conclusions were reached following structural characterization of peptides corresponding to the N-terminal regions of the S. Typhimurium effectors SptP, SopD-2, GtgE, and the Yersinia pestis effector YopH.
Introduction
The Gram-negative Salmonella genus of bacteria contains two species, S. enterica and S. bongori, with over 4400 different characterized serovars (aka strains or seriological variants).1 Many of these serovars cause infectious diseases of variable severity in man. Typhimurium, the leading causative agent of gastroenteritis, is perhaps the most common2 with an estimated 20 million Americans infected annually, while Typhi, the causative agent of typhoid fever, is the most deadly killing an estimated 200 000-plus people worldwide annually.3 Recent emergence of multi-drug resistant strains,4 such as Typhimurium DT104,5 has heightened Salmonella’s threat to public health and fueled efforts to develop new therapeutic strategies.
One set of therapeutic targets is the components of type III secretion systems (T3SS) found in Salmonella and many other Gram-negative pathogenic bacteria.6,7 Type III secretion systems are generally composed of three sets of proteins; structural, effectors, and chaperones.8 The structural proteins form a needle-like complex on the bacteria’s surface that inserts into the host cell to deliver effector (virulence) proteins from the pathogen’s cytoplasm into the host cell. These effector proteins facilitate disease progression by manipulating host processes such as cytoskeleton assembly, vesicle transport, and signal transduction.9 Prior to secretion some effectors interact immediately with chaperone proteins. Along with targeting the effector to the needle complex for secretion, the effector-chaperone complex is thought to prevent effector folding and aggregation.10-12 However, not all effectors possess a cognate chaperone13,14 and it is not known how such chaperone-less effectors are recognized by the structural apparatus.
Effector proteins are often essential for virulence and species specific,15 and consequently, they are attractive drug targets that may be tailored to eradicate specific pathogenic organisms rather than entire commensal microbial communities.16,17 Unfortunately, effector proteins are difficult to identify from annotated genomes as they lack an obvious consensus sequence motif that would make them easily identifiable by sequence alignment alone. Several studies indicate that some type of secretion signal exists at the N-terminus,18 either encoded in the underlying mRNA19 or the protein sequence.20,21 By taking into account several genomic-level features of verified effector proteins, three new machine-learning programs have been developed to predict novel T3SS effectors.22-24 One such program, SIEVE (Support vector machine (SVM)-based Identification and Evaluation of Virulence Effectors), is able to identify 88% of the verified effectors when the program is trained on S. Typhimurium and evaluated on the plant pathogen Pseudomonas syringae.24 The SIEVE success rate is 87% when the experiment is reversed suggesting that there are features shared between both organisms. Indeed, the observations that the T3SS of one organism can export an effector from another organism25-27 supports this conclusion as does the observation that T3SS inhibitors can block secretion from many bacterial species (e.g., Yersinia pestis, Chlamydia trachomatis, and S. Typhimurium).28-30
The apparent universality of the effector N-terminal secretion signal suggested by in silico SIEVE experiments24 has also been shown with other recent machine-learning effector prediction programs.22,23 Many of the findings reported by the creators of these programs are similar including the length of the secretion signal and the importance of particular amino acids. None of the three new programs identify a consensus sequence for the secretion signal, but, the SIEVE program identifies a pattern bias within the composition bias for secretion signal recognition.24 To further examine pattern bias of the T3SS secretion signal, the N-terminal 30-residues of the S. Typhimurium effector SseJ along with two scrambled peptides of the same amino acid composition that produced high (SseJ-H) and low (SseJ-L) SIEVE scores were tested by the construction of translational fusions with the adenylate cyclase domain of the hemolysin/adenylate cyclase toxin (CyaA) from Bordetella pertussis.31,32 This cyaA fragment requires calmodulin for activity and is therefore not active until it reaches the mammalian cytoplasm where the concentration of cAMP can be easily quantified. If sequence order is important then the assay should show differences in the ability for these three CyaA fusion proteins to be transported into the host.
While structures have been determined for a number of effector proteins from different bacterial species,33 to date only one, the Y. pestis effector YopH, has been solved with a fully intact N-terminus.34-36 In the remaining structures the N-terminal region was either removed prior to crystallization33 or the electron density maps could not be interpreted/observed for the N-terminus.12,37,38 Indeed, the last two observations suggest that effector proteins possess a natively disordered N-terminus and that this property facilitates recognition and transport by type III secretion systems.12,33,39 To test this hypothesis the N-terminal 30 residues of the S. Typhimurium effectors SseJ, SptP, SopD-2, and GtgE plus the Yersinia pestis effector YopH were chemically synthesized and their structural properties in solution studied by circular dichroism (CD) and nuclear magnetic resonance (NMR) spectroscopy. These same methods, along with ion mobility spectrometry–mass spectrometry (IMS-MS), were also used to characterize the structural properties of synthetic peptides corresponding to the two scrambled peptides of SseJ, SseJ-H and SseJ-L. Since CD and NMR spectroscopy indicated that all the synthetic peptides lacked any structure in 100% aqueous solution, the powerful structure stabilizing agent, 1,1,1,3,3,3-hexafluoroisopropanol (HFIP), was used in an attempt to expose any folding predispositions of these peptides.40,41
Materials and methods
Materials
The native N-terminal 30 residues of the SseJ sequence were randomized to generate new peptides with a high (0.93) and low (0.0007) probability score using the SIEVE web server (http://www.biopilot.org).24 These two de novo sequences, SseJ-H (high probability score), MGIFKSFESNYSTVPLISPSQRAEEGAKLS, and SseJ-L (low probability score), MSVTELGSGEKANFISPYERSFIQSPLKSA, were chemically synthesized by Bio Basic Inc. (Markham, ON, Canada) along with the N-terminal 30 residues of the S. Typhimurium effectors SseJ, SptP, SopD-2, and GtgE plus the N-terminal 35 residues of the Yersinia pestis effector YopH (see Table 1). All DNA primers used to construct the translational CyaA fusions were purchased from Integrated DNA Technologies (San Diego, CA). Protonated and deuterated 1,1,1,3,3,3-hexafluoro-2-propanol (HFIP) was purchased from the Sigma Chemical Company (St. Louis, MI) and Cambridge Isotopes (Andover, MA), respectively.
Table 1.
Names, molecular weights, and amino acid sequences for the studied peptides
| Peptide | Mass | Sequence |
|---|---|---|
| SseJ | 3274.6 | MPLSVGQGYF TSSISSEKFN AIKESARLPE |
| SseJ-H | 3274.6 | MGIFKSFESN YSTVPLISPS QRAEEGAKLS |
| SseJ-L | 3274.6 | MSVTELGSGE KANFISPYER SFIQSPLKSA |
| SptP | 3490.0 | MLKYEERKLN NLTLSSFSKV GVSNDARLYI |
| SopD-2 | 3542.9 | MPVTLSFGNR HNYEINHSRL ARLMSPDKEE |
| GtgE | 3476.9 | MLRHIQNSLG SVYRSNTATP QGQIIHHRNF |
| YopH | 3826.3 | MNLSLSDLHR QVSRLVQQES GDCTGKLRGN VAANK |
Secretion signal–CyaA fusion assay
To generate translational CyaA fusions, polymer chain reaction (PCR) products of sseJ with flanking 5′ XbaI and 3′ PvuII restriction sites were cloned into the pMJW1753 expression vector digested with XbaI and SmaI.32 The forward primers for wild type sseJ, sseJ-H, and sseJ-L were 5′-GCCTCTAGAAAAGTAAGGAGGACACTATGCCATTGAGTGTTG-3′, 5′-GCCTCTAGATTTAATAAAGTAAGGAGGACACTATGAGCGTGACCGAACTGGGCAGCGGCGAAAAAGCGAACTTTATTAGCCCGTATGAACGCAGCTTTATTCAGAGCCCGCTGAAAAGCGCGTTAAGTTTATGGGAGAAAATCAAAG-3′, and 5′-GCCTCTAGATTTAATAAAGTAAGGAGGACACTATGGGCATTTTTAAAAGCTTTGAAAGCAACTATAGCACCGTGCCGCTGATTAGCCCGAGCCAGCGCGCGGAAGAAGGCGCGAAACTGAGCTTAAGTTTATGGGAGAAAATCAAAG-3′, respectively. These primers were designed to anneal approximately 20 base pairs upstream of the start codon so as to encode the putative Shine Dalgarno sequence. The reverse primer was 5′-CAACAGCTGTTCAGTGGAATAATGATGAGCTATAAAACTTTC-3′. Expression was driven by the plasmid encoded lac promoter constitutive in Salmonella. Plasmids were verified by automated sequencing and then electro-porated into the S. Typhimurium ATCC 14028 wildtype and ssaK−::cat cell lines.32 Expression was confirmed by Western hybridization using an antibody against the CyaA epitope. The J774 macrophages were infected and analyzed for cAMP levels in triplicate as previously described.32
Circular dichroism spectroscopy (CD)
Circular dichroism data for the peptides were obtained on an Aviv Model 410 spectropolarimeter (Lakewood, NJ) calibrated with an aqueous solution of ammonium d-(+)camphorsulfonate. Far-UV wavelength spectra were recorded between 200 and 260 nm, at 25 °C, in a quartz cell of 0.1 cm path length in unbuffered water and in various volume percentages of HFIP. For the SseJ, SseJ-H, and SseJ-L peptides, data were collected using identical peptide concentrations (0.08 mM) in 0, 10, 20, 30, 50, 75, and 100% HFIP. For the peptides corresponding to the N-terminal regions of the S. Typhimurium effectors SptP, SopD-2, GtgE, and the Yersinia pestis effector YopH the peptide concentrations were 0.06, 0.12, 0.13, and 0.07 mM, respectively. All spectra were the result of averaging two consecutive scans with a step size of 0.5 nm, 1.0 nm bandwidth, and time constant of 1.0 s. The wavelength spectra were processed by first subtracting a blank spectrum followed by automated data smoothing.
Nuclear magnetic resonance spectrometry (NMR)
All NMR data were collected on 1.5–2.0 mM samples at 25 °C using Varian Inova-750, and –800 spectrometers equipped with triple resonance probes and pulse field gradients. One-dimensional spectra were collected in unbuffered water and in various volume percentages of deuterated HFIP between 20 and 90% (it was necessary to have at least 10% D2O for the lock signal). Two-dimensional 1H–1H TOCSY, NOESY, and COSY spectra were recorded with water presaturation using Varian Protein-Pack pulse programs on the SseJ, SseJ-H, SseJ-L, SptP, SopD-2, GtgE, and YopH peptides in water, 20% HFIP, and 90% HFIP. Mixing times of 250 ms were used in the NOESY experiments. Felix 2007 (Felix NMR, Inc, San Diego, CA) and SPARKY42 programs were used to process and analyze all NMR data with indirect methods used to reference the 1H chemical shifts to DSS (DSS = 0 ppm).43
Ion mobility spectrometry–mass spectrometry (IMS-MS)
The synthetic peptides SseJ, SseJ-H, and SseJ-L were analyzed in water and increasing concentrations of HFIP on a home-built IMS-TOF (ion mobility spectrometer–time-of-flight) mass spectrometer operating in the positive electron spray ionization (ESI) mode. The procedure involved sampling the electrospray plume with a 64 mm long capillary inlet heated to 150 °C and transmitting the ions into a converging high-pressure hourglass ion to focus and trap the ions. This converted the continuous ion beam from the ESI source into a discrete short ion pulse for mobility measurements. The ejected ions then entered a 98 cm long drift cell filled with ultra-pure nitrogen gas (~4 Torr). Frictional drag due to the nitrogen gas was countered by a forward acceleration generated by a uniform electric field E (~18 V cm −1). As a consequence, an equilibrium was quickly reached where the ions drift at constant velocity, vd, proportional to the applied field, E, as shown in eqn (1), where the proportionality constant, K (in cm2 V−1 s−1), is termed the mobility of the ions.44
| (1) |
As the ions exited the drift cell, they were refocused by the rear ion funnel and transmitted through two, differentially pumped, short quadrupole chambers. An Agilent Technologies orthogonal acceleration time-of-flight (TOF) mass spectrometer (Santa Clara, CA) was utilized for accurate m/z measurement of mobility separated ions and an analog-to-digital converter recorded the ion counts that were signal averaged for 10 s. A detailed description of the instrument control software and data acquisition scheme is reported elsewhere.45,46
Computational prediction of secreted effectors
The sequences of all the peptides, SseJ, SseJ-H, SseJ-L, SptP, SopD-2, GtgE, and YopH, were analyzed by the T3SS effector predictor programs SIEVE (http://www.sysbep.org/sieve),24 EffectiveT3 (http://www.effectors.org),22 and T3SS Prediction (http://www.gecco.org.chemie.uni-frankfurt.de/T3SS_prediction).23
Results and discussion
Secretion signal–CyaA fusion assay
The N-terminal region of SseJ was chosen to examine the pattern bias of T3SS secretion signals because the protein, found on a small Salmonella pathogenicity island, is a known effector required for full virulence of serovar Typhimurium.47,48 Furthermore, the N-terminal 140 residues of SseJ have been shown to be essential for translocation and it is a member of a family of effectors with relatively conserved N-termini in Salmonella.49
The secretion signal–CyaA fusion assay involves the fusion of the target peptide on to the adenylate cyclase domain of the hemolysin/adenylate cyclase toxin (CyaA) from Bordetella pertussis31,32 and assaying for activity in the host cells, J774 macrophage. Adenylate cyclase activity is dependent on host cell calmodulin, and therefore, expressed signal–CyaA fusion protein is inactive in bacterial cells. Only when the signal–CyaA fusion protein is expressed and translocated into the host cytoplasm can cyclic AMP (cAMP) be generated. Detection of cAMP therefore identifies a ‘signal’ fused to CyaA that are successful in targeting the fusion protein to the type III secretion apparatus. For controls, a secretion signal-CyaA construct with the N-terminal 149 residues of another known effector protein, SrfH, was prepared and all four fusion constructs were also tested in a S. Typhimurium cell line with the SPI-2 secretion apparatus inactivated (SsaK−::cat mutant cell line). Fig. 1 shows that the fusion constructs with the native N-terminal sequence of SseJ and SrfH were secreted into the J774 macrophage at approximately equal levels. Note that the N-terminal region of SseJ studied here, residues 1–30, is a shorter region of the N-terminus than was previously shown to be essential for translocation.49 Relative to the fusion construct with the wildtype sequence, the SseJ-H and SseJ-L fusion constructs were secreted ~80% and <20% as effectively, respectively (Fig. 1). Transport was occurring through the SPI-2 secretion apparatus as none of the fusion constructs were secreted into the macrophage using the SPI-2 ssaK mutant cell line. Clearly, the data suggest that the amino acid composition of the N-terminal sequence alone does not drive secretion recognition and there is a component of the signal that is sequence order dependent (SOD).24 Given the evidence for a role of the pattern in the composition bias of amino acids in secretion signal recognition, the SseJ, SseJ-H, and SseJ-L peptides were characterized by CD and NMR spectroscopy to determine if these were also structural differences between the peptides that may contribute to signal recognition.
Fig. 1.
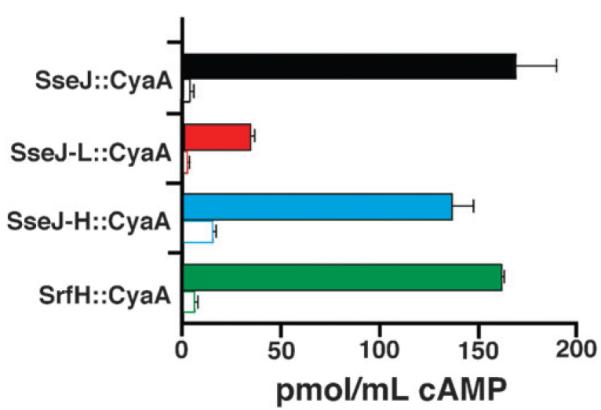
Levels of cAMP generated by the secretion signal–CyaA fusion assay using fusions with the peptides SseJ (black), SseJ-L (red), SseJ-H (blue), and SrfH (green). The solid colored columns are with wildtype S. Typhimurium and the white columns with SPI-2 inactivated mutant S. Typhimurium. All experiments were performed with J774 macrophage in triplicate with the error in these measurements indicated by the black error bars.
Circular dichroism spectroscopy
Circular dichroism (CD) is an established spectroscopy used to rapidly probe the conformation of proteins and peptides in solution50,51 and to monitor their structure and stability under a variety of conditions.52 This spectroscopy has been especially prominent in studying the effect of fluoroalcohols on peptide structure because these compounds can stabilize secondary structure.53 Circular dichroism spectra were acquired for the SseJ, SseJ-H, and SseJ-L peptides as a function of increasing percent volumes of HFIP and the spectra at 0, 20, and 100% HFIP are illustrated in Fig. 2A. In aqueous solution the spectra for all three peptides were characteristic of a protein that lacked a well-defined secondary structure: a negative band around 200–205 nm and a weak band near 220 nm.51 Note that the profiles of the CD spectra did not significantly change in the presence of various buffers with different salt concentration (50 to 500 mM NaCl) and ionic strength (data not shown). Upon the addition of HFIP to the peptides there was a distinct increase in the content of ordered secondary structure manifested by a decrease in the negative band in the 190–200 nm regiontowards positive ellipticity values and the appearance of negative bands with double minima at 222 and 208–210 nm. The double minimum is a distinct trait for α-helical structure51 and was clearly present at 20% HFIP for all three peptides as shown in Fig. 2A. A good monitor of structure is the ellipticity at 220 nm ([Θ]220)53 with more negative values indicative of the adoption of more structure. These values are plotted for SseJ (black solid line), SseJ-H (blue dashed line) and SseJ-L (red dotted line) in Fig. 2B. The behavior of all three peptides was similar with [Θ]220 becoming steadily more negative until reaching 20–30% HFIP. At this point SseJ and SseJ-H overlap and the value for SseJ-L became more negative suggesting it was slightly more ordered than the other two peptides. There was little change in [Θ]220 for all three peptide upon increasing HFIP from 30 to 75%. However, beyond 75% HFIP all three peptides behaved differently. The [Θ]220 value for the native peptide, SseJ, remained almost linear while the value for SseJ-L grew more negative and the value for SseJ-H grew more positive suggesting these peptides became more ordered and disordered, respectively, at 100% HFIP. One possible explanation for the increase in [Θ]220 for SseJ-H in going from 75 to 100% HFIP is that the peptide is less soluble at high concentrations of the fluoroalcohol and it comes out of solution.
Fig. 2.

(A) Circular dichroism spectra for the peptides SseJ (black solid line), SseJ-L (red dotted line), and SseJ-H (blue dashed line) at 0, 20, and 100% HFIP (v/v). (B) Dependency of [Θ]220 on the concentration of HFIP (volume percent) determined for the peptides SseJ (black solid line), SseJ-L (red dotted line), and SseJ-H (blue dashed line). Titration data were collected at 25 °C with an approximately equal concentration of each peptide (0.08 mM).
NMR spectroscopy
The CD data suggested that all the peptides go through a transition from a disordered state in the presence of water to a structured state in the presence of increasing percentages (v/v) of HFIP. If the CD data after 75% HFIP are ignored, each peptide reached its maximally structured state at between 20 to 30% HFIP. Consequently, to corroborate the structural properties of the peptides suggested by the CD data, the peptides were analyzed by NMR methods in 25% perdeuterated HFIP. A peptide’s transition from a disorder to structured state can be intimately followed by the acquisition of one-dimensional NMR spectra of the amide region (~7-10 ppm). Typically, the chemical shifts of amide resonances in disordered peptides fall within a narrow chemical shift range. Upon the adoption of secondary structure the local chemical environment of each amide becomes more unique, and consequently, the chemical shift dispersion of these resonances extends over a larger chemical shift range. Fig. 3 plots the one dimensional proton spectrum of the amide region of SseJ, SseJ-H, and SseJ-L in water and in the presence of 25% HFIP. In water, the chemical shift dispersion of the amides for all three peptides was <0.8 ppm and the heights of many of the resonances suggest a substantial overlap of chemical shifts, observations typical of disordered peptides and in agreement with the random coil CD profiles. In the presence of 25% HFIP the amide resonances of SseJ clearly became more disperse and now covered ~1.1 ppm, suggesting that SseJ became more structured in the presence of HFIP as suggested by the CD profiles. On the other hand, while the center of the range of amide chemical shifts for SseJ-H and SseJ-L shifted upfield in the presence of the organic solvent HFIP and there was an increase in the chemical shift dispersion of the amide resonances, there was still a significant overlap of amide chemical shifts. Collectively, these NMR observations for SseJ-H and SseJ-L suggest that these two peptides are also becoming more ordered in the presence of HFIP. However, the more extensive overlap in the amide region suggests they may not be structured to the same degree as suggested for SseJ.
Fig. 3.

Overlay of the one-dimensional proton spectra for the peptides SseJ, SseJ-L, and SseJ-H in water (black spectrum) and in 25% HFIP (blue spectrum), collected at a 1H resonance frequency of 750 MHz, 20 °C.
The one-dimensional NMR spectra suggest that the three peptides become more structured in the presence of 25% HFIP in the estimated order of SseJ > SseJ-L > SseJ-H. It is possible to characterize the type and extent of structure present in detail using a suite of two-dimensional NMR experiments, a technique routinely used to determine the structure of biological molecules in solution.54 If the peptides adopt a well-defined structure in solution they should give rise to patterns of proton–proton NOEs typical of α-helical or β-sheet structures.41,55-58 Two-dimensional 1H–1H NOESY spectra were collected for all three peptides in 0%, 25%, and 90% HFIP and the data analyzed for NOE patterns typical of α-helical or β-sheet structures. For all three peptides, under each of the three conditions, there was little evidence of any α-helical or β-sheet structure even with mixing times as long as 250 ms. This point is illustrated in Fig. 4 for SseJ in 25% HFIP. Because of the good chemical shift dispersion of the amide region in SseJ, it was possible to assign the majority of the peptide’s backbone and side chain resonances using two-dimensional TOCSY, COSY, and NOESY experiments. The assignment of the amides is illustrated in Fig. 4, the amide region of the 1H–1H NOESY spectrum. The most striking feature is that sequential NOEs were only observed and none of the amides have cross peaks to protons further away than their nearest neighbor. In regular α-helices the 1HN(i) to 1HN(i + 2) distance is approximately 4.2Å and at such a distance NOEs are routinely observed.54 More diagnostic of the adoption of a rigid structure are non-sequential NOEs between the backbone amide protons and side chain protons.54 In particular, 1HN(i) to 1Hα(i + 3) NOEs are typically observed in α-helical regions (~4.2Å) but only 1HN(i) to 1Hα(i) and 1HN(i) to 1Hα(i − 1) NOEs were observed experimentally as illustrated in Fig. 4. Note that the 1HN(i) to 1Hα(i) NOEs were stronger than the 1HN(i) to 1Hα(i − 1) NOEs, indicating that β-sheets were not forming.54 The absence of 1HN(i) to 1Hα(i + 3) and other NOEs characteristic of helical structure in the presence of data suggesting the presence of helical structure (CD spectra and dispersed amide region in the one-dimensional proton NMR spectrum) are indicative of nascent helices.59 These observations also illustrate the advantages of using two-dimensional NMR spectroscopy as a tool for the structural characterization of peptides as the conclusions reached by CD and one-dimensional NMR spectroscopy alone would have over-estimated the true structure adopted by these peptides in HFIP.
Fig. 4.

Amide (1HN) and alpha proton (1Hα) region of the two-dimensional 1H–1H NOESY spectrum for the peptide SseJ in 25% HFIP collected at a 1H resonance frequency of 750 MHz, 20 °C. Sequential walk through the amide and alpha proton assignments are shown in red.
HFIP versus trifluoroethanol (TFE)
While all the CD and NMR data presented here were in the presence of the powerful structure stabilizing agent HFIP, these titration experiments were also performed with trifluoroethanol (TFE), a milder structure stabilizing agent (data not shown).55,57 The CD data suggested that increasing concentrations of TFE was inducing the formation of helical structure in the three peptides, however, TFE had little effect on the one-dimensional spectra of SseJ, SseJ-H, and SseJ-L even at concentrations of 90% (v/v). The need to use one of the most powerful structure stabilizing agents, HFIP, to induce NMR detectable structure in these peptides (as monitored by one-dimensional spectra) may have resulted in inducing helices of no biological significance.
Ion mobility spectrometry–mass spectrometry (IMS-MS)
Circular dichroism and NMR spectroscopy are classical methods employed to study the structure of peptides in solution. Since the CD and NMR observations gave somewhat conflicting results the structural changes induced by HFIP on the peptides SseJ, SseJ-H, and SseJ-L were also studied by IMS-MS. Ion mobility spectrometry–mass spectroscopy is a technique that is gaining more popularity in studying structural differences in a population of molecules.60 This is because the mobility of different molecular conformations and charged states through a gas are often significant enough to be detected by IMS-MS.61 Fig. 5A illustrates the IMS-MS results for the triply protonated plus-three charge state of SseJ, SseJ-H, and SseJ-L in 25% HFIP. This concentration of HFIP induced the maximal increase in structure in all three peptides (as monitored by CD (Fig. 2)) and this plus-three charge state was by far the most populated charged state in the IMS-MS data (data not shown). Clearly, the arrival time distribution (ATD) plot on the top of each set of data in Fig. 5A shows that a range of conformations was present for all three peptides, with drift times between 31 and 34 ms. The ATD pattern, binned into three different groups indicated by the colors magenta, yellow, and blue, differed for the three peptides. SseJ and SseJ-L were most similar with the major difference, relative to SseJ, being more of the middle species (yellow) at the expense of the slowest moving species (blue). On the other hand, the fastest moving species (purple) observed in SseJ and SseJ-L was almost non-existent in SseJ-H. Given that the amino acid composition between SseJ, SseJ-H, and SseJ-L is identical and the order of the amino acids differ, the different ATD profiles indicate that the gas phase behavior of a peptide, as followed by IMS-MS, is sequence order dependent.
Fig. 5.

The nested IMS-MS spectra over a 5 ms drift time (x-axis) for the (A) triply protonated plus-three charge state of SseJ, SseJ-L, and SseJ-H in 25% HFIP and (B) the plus-three charge state of SseJ in 0, 25, and 100% HFIP. An example of a two-dimensional slice through the mass spectrum of SseJ is shown on the left. In addition to the triply protonated state, the (2H+ + Na+)3+ and (2H+ + K+)3+ species are also shown in (B). At the top of each spectrum is shown the ion arrival time distribution (ATD) for each peptide. All peptides exhibit a range of multiple conformations that have been grouped into three distinct groups: purple = compact; yellow = intermediate; blue = extended.
Extended structures, either helical or random coil, have the largest rotationally averaged cross section60 and the longest drift time in the spectrometer.62 Consequently, the ions with the longest drift time in Fig. 5A likely also represent an extended structure present in the gas phase (colored blue). The unfortunate consequence is that it is not possible to differentiate between fully extended random coil and fully extended helical structures. On the other hand, fully folded globular structures have the smallest rotational averaged cross section60 and the shortest IMS drift time.62 Such structures often do not contain elements of classical secondary structure, but instead, represent a folded random coil.63 In Fig. 5A the ions with the shortest drift time likely represent the completely folded random coil globular state (colored purple). Species in between the fully globular (purple) and fully extended (blue) state, colored yellow in Fig. 5A, likely represent a structural hybrid of a globular structure with an extended N- or C-terminus (hinged helix-coil states).63 Note that while extended helices in the gas phase may be related to helices observed in solution, it is not known if any relationship exists between folded globular and partially folded structures observed in the gas phase and similar structures in solution.63
While the CD data indicated that ~25% HFIP induced the maximal increase in structure in all three peptides, there was no significant difference in the ATD profile for SseJ in the presence of zero or 25% HFIP as shown in Fig. 5B. This was also observed for SseJ-H and SseJ-L (data not shown). Indeed, only at the highest concentrations of HFIP were any modest changes observed in the ATD profiles and these primarily involved a more focused distribution of the yellow and blue bands. Because it is not possible to differentiate between extended helical and extended random coil structures by IMS-MS, this method provided no new conclusive insights regarding the HFIP induced structural changes suggested by the CD data (both the CD and NMR data are consistent with a completely random coil structure in 0% HFIP, and hence, the blue band in 0% HFIP most likely represents an extended random coil structure). However, while the overall population of each structural bin in the ATD profile remained relatively constant with the addition of HFIP, there clearly was an increase in the population of the sodiated and potassiated species in the presence of 100% HFIP and these ions populated the yellow and blue ATD bins. Because the concentration of sodium and potassium in the sample was constant during the titration (the water and HFIP used to prepare the titration solutions were salt free), high concentrations of HFIP appeared to increase the affinity of these ions to the peptide, and in turn, these sodiated and potassiated ions predominately have slower drift times (more extended structures). This observed increase in sodiated and potassiated species may not be surprising because in the absence of water such ions might be expected to have a greater affinity for the peptide instead of the non-polar solvent HFIP. If the sodiated and potassiated extended species represent helices and not random coils, then perhaps the induction of such species by fluorinated alcohols is a mechanism by which aqueous HFIP and other fluorinated alcohols stabilize secondary structure in peptides and proteins.
Structural analysis for the SptP, SopD-2, GtgE, and YopH peptides
To assess if the CD, NMR and IMS-MS observations made for the N-terminal 30-residues of SseJ were unique for this peptide or generally true for the N-termini of all effectors, peptides for the N-terminal region of SptP, SopD-2, GtgE, and YopH were similarly analyzed by CD and NMR spectroscopy.
In water alone, the CD profile for all four peptides were characteristic of a peptide that lacked a well-defined secondary structure: a negative band around 200–205 nm and a weak band near 220 nm.51 Upon the addition of HFIP to the peptides there was a distinct increase in the content of ordered secondary structure manifested by a decrease in the negative band in the 190–200 nm region towards positive ellipticity values and the appearance of negative bands with double minima (222 and 208–210 nm) characteristic of α-helical structure. These features were similar to those observed for SseJ, SseJ-H, and SseJ-L and are summarized in Fig. 6, a plot of the ellipticity at 220 nm ([Θ]220) as a function of HFIP percentage. The [Θ]220 steadily becomes more negative for all four peptides until 20–30% HFIP for YopH, GtgE, and SopD-2 and B75% HFIP for SptP. Upon reaching this plateau, the [Θ]220 value tends to remain relatively constant or decreases further only marginally. Except for SptP, which required more HFIP to reach a [Θ]220 plateau, the [Θ]220 profile as a function of HFIP for YopH, GtgE, and SopD-2 was similar to that observed for SseJ.
Fig. 6.
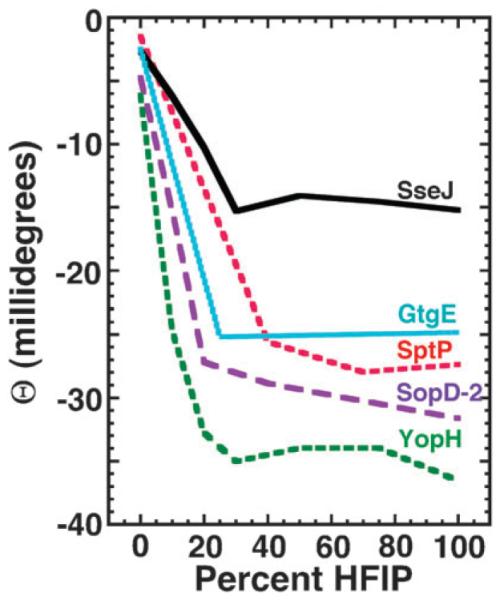
Circular dichroism dependency of [Θ]220 on the concentration of HFIP (volume percent) determined for the peptides corresponding to the N-terminal regions of the S. Typhimurium effectors SptP (red), SopD-2 (purple), GtgE (cyan), and SseJ (black) and Y. pestis effector YopH (green). The data were corrected for concentration differences between the peptides SptP (0.06 mM), SopD-2 (0.12 mM), GtgE (0.13 mM), and YopH (0.07 mM), and SseJ (0.08 mM) and have been normalized to SseJ.
The differences in the maximal negative [Θ]220 values observed for SseJ and the other four peptides in Fig. 6 does not accurately represent differences in helical content effected by the addition of HFIP. This is due to differences in amino acid sequence between SseJ, SptP, GtgE, and SopD-2, and the increased amino acid length of YopH (35 versus 30 residues). To more accurately determine if the SptP, SopD-2, GtgE, and YopH peptides formed a rigid structure in solution upon the addition of HFIP, 1H–1H NOESY data were collected for these peptides at 0, 25, and 90% HFIP. While these spectra were not assigned, as observed for SseJ there was clearly no evidence for proton–proton NOEs characteristic of a structured peptide (data not shown) for any of these peptides under any condition.
Intrinsically disordered secretion signal?
In aqueous solution alone, the CD, NMR, and IMS-MS data presented here indicate that SseJ, SseJ-H, and SseJ-L are disordered. Such disorder in the SseJ peptide may be because tertiary interactions with the parent protein are necessary for it to adopt its native fold.57,64 Alternatively, it may be because the N-terminus of effector proteins are natively disordered and that it is this property that allows recognition and transport by type III secretion systems.12,39 Intrinsically disordered proteins represent a unique functional and structural category of proteins65-67 implicated in several vital biological functions.68,69 As the name suggests, these proteins lack a rigid, well-ordered structure and exist as a highly dynamic ensemble in solution. Intrinsically disordered proteins or regions of proteins are often involved in binding interactions with other proteins, nucleic acids, or small molecules, undergoing a disorder to order transition upon ligand binding.53,70 Relationships between amino acid sequence and intrinsic disorder have been identified, and consequently, it is possible to predict the tendency of a polypeptide to be disordered (and ordered) from the primary amino acid sequence using programs such as PONDR (www.pondr.com).71,72
Fig. 7A is a plot of the PONDR predictions for SseJ, SseJ-H, and SseJ-L. PONDR scores above 0.5 are predictive of disorder while scores below 0.5 are predictive of order. The smaller the PONDR score the more likely the region is ordered. Clearly, the PONDR profiles for SseJ, SseJ-H, and SseJ-L are different. The native peptide, SseJ, is predicted to be ordered from residues 5–19 but only six residues, 10–15, have confident scores below 0.20. SseJ-L is predicted to be well-ordered from residues 2–10 and then the prediction towards disorder increases steadily to residue 19 and remains large to the end. The prediction for nearly the entire sequence of SseJ-H is on the disordered side, but only marginally. At face value, the program predicts that approximately half of SseJ and SseJ-L is disordered while SseJ-H is entirely disordered. The experimental data confirm the prediction for SseJ-H but not entirely for SseJ and SseJ-L. One possible explanation may be the N-terminal needs the rest of the native protein to fold properly, especially if this predicted ordered region is a β-strand without its partner. Note that the PONDR predicted disorder in SseJ, ~50%, is near the value obtained by secondary structure predictions for the first 25 residues of known T3SS effectors, 51% coil.22
Fig. 7.
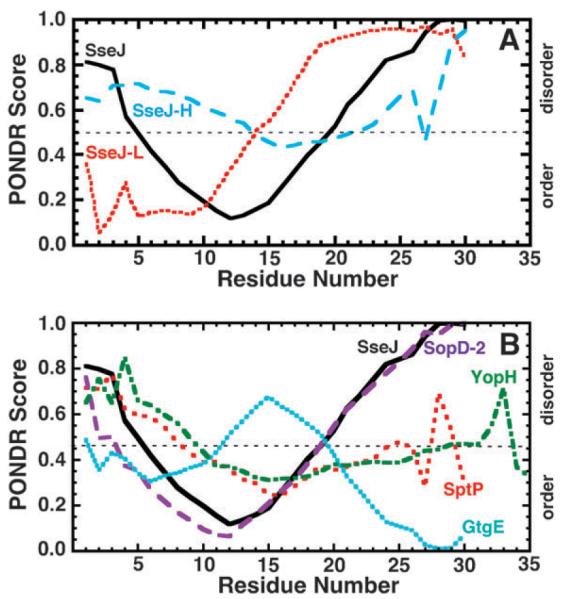
Graphical output of PONDR predictions using the VL-XT algorithm for (A) SseJ (black solid), SseJ-L (red dots), and SseJ-H (blue dashes) and (B) the N-terminal regions of the S. Typhimurium effectors SptP (red), SopD-2 (purple), GtgE (cyan), and SseJ (black) and Y. pestis effector YopH (green). Consecutive values above and below 0.5 predict disordered and ordered regions, respectively, within the protein.
Fig. 7B is a plot of the PONDR predictions for the SptP, SopD-2, GtgE, and YopH peptides along with the SseJ peptide. The PONDR profile for SopD-2 is similar to SseJ while the profiles for SptP and YopH straddle the ambiguous zone of no clear preference about 0.50. Only the last seven residues of the GtgE peptide have PONDR scores highly predictive of order (<0.2). As suggested for the SseJ peptide, one possible explanation for the absence of structure even in the presence of HFIP may be that SopD-2 and GtgE are missing the rest of the native protein to fold properly. However, another possibility is that the N-terminal type III effector signals are intrinsically disordered.12,39
The PONDR predictions for the N-terminal region of the proteins studied here predict with high confidence that only two of the peptides, SseJ and SopD-2, may be ~50% ordered. Secondary structure predictions for the first 25 residues of known T3SS effectors predict this region is 51% random coil.22 Another analysis of the effector proteins from P. syringae pv. tomato indicated that ~75% of the proteins showed a propensity for disorder at the N-terminal 50 residues.33 Nineteen crystal structures have been determined for effector proteins to date. However, the N-terminus was present for only three of these 19 structures and of these three structures only one, YopH from Y. pestis,34,36 showed a structured N-terminus. In the other two crystal structures the N-terminus contained no interpretable electron density suggesting this region was natively disordered.12,38 Indeed, to obtain crystals for effector proteins it has been observed that it was often necessary to remove an N-terminal region, presumably because the disorder in this region was not conducive to crystallization.33 Hence, there is a substantial body of evidence indicating that the N-terminal secretion signal of T3SS effector proteins are natively disordered and it this structural disorder that plays a role as a secretion signal.33
The NMR studies presented here add to this body of evidence, showing that the N-terminal region of the effector proteins SseJ, SptP, SopD-2, GtgE, and YopH are all disordered in 100% aqueous solution and remain highly flexible and unstructured even in the presence of HFIP. While these peptides were only between 30–35 residues in length, the NMR observations corroborate with solution studies of effector proteins containing much larger regions of the N-terminal secretion signal. For example, NMR analysis of the dynamic properties of the Yersinia pseudotuberculosis effector YopE indicated that the N-terminal 98 residues of this 219 residue protein was in a unstructured and flexible state.73 Indeed, the extreme N-terminal 20 residues of YopE remained disordered even after binding to its chaperone SycE.
The only crystal structures of a T3SS effector protein showing structure at the N-terminus is YopH from Y. pestis determined as a domain-swapped dimer.36 A crystal structure very similar to the domain-swapped dimer structure was reported earlier except the protein was a monomer.34 It was subsequently shown that the electron density for this monomer structure could be better fit as a dimer.36 A solution structure for the N-terminal domain (residues 1–129) for Y. pestis YopH was also determined bound to a short phosphorylated peptide, N-acetyl-DEpYDDPF-NH2.35 The N-terminal region of YopH is bifunctional and is necessary for directing YopH to a specific chaperone, SycH, for translocation and for directing YopH to components of the injectosome for secretion. Residues 1–17 are necessary for secretion and residues 18–71 are necessary for translocation.31 Fig. 8 illustrates the N-terminal 35 residues of YopH in the domain-swapped crystal structure (1K46) and the monomeric complex structure (1M0V). The region containing the secretion signal, residues 1–17, is helical in both structures contrary to the disordered structure observed here for the YopH peptide (residues 1–35). The reason for the discrepancy may be because the helical structure observed in the XRD and NMR structure is a consequence of dimerization and phosphopeptide binding, respectively. Alternatively, as suggested earlier, the YopH peptide is too short to fold properly because it requires the rest of the protein.57,64
Fig. 8.
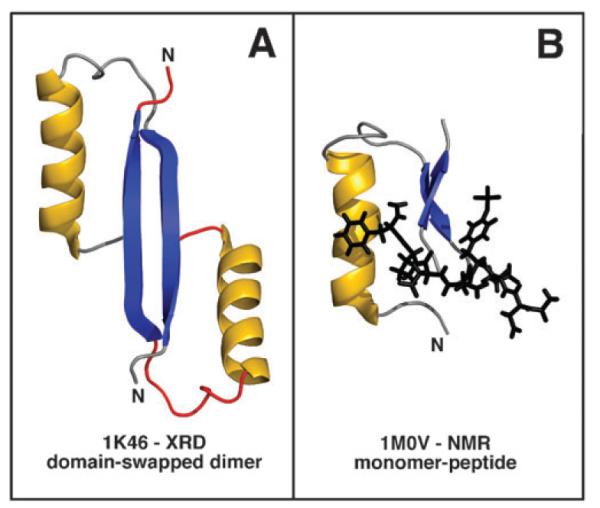
Structure of the first 35 residues in the only effector structures containing an intact N-terminal region, Y. pestis YopH (residues 1–129). (A) Crystal structure of a domain-swapped dimer, 1K46.36 (B) The solution structure of a monomer bound to N-aceyl-DEpYDDPF-NH2, 1M0V.35 The α-helix, shown in gold, comprises most of the residues (1–17) necessary for secretion. The β-strands are colored blue.
Prediction of amino acid pattern bias in T3SS effector signals
Table 2 summarizes the results of the analysis of SseJ, SseJ-H and SseJ-L peptide sequences with the T3SS effector predictor programs SIEVE,24 EffectiveT3,22 and T3SS Prediction.23 The SIEVE and EffectiveT3 programs both predicted that SseJ and SseJ-H will be secreted and not SseJ-L, consistent with the signal–CyaA fusion assay showing significantly reduced secretion of SseJ-L in macrophage relative to SseJ and SseJ-H. The amino acid composition of SseJ, SseJ-H, and SseJ-L are all the same, only the sequence pattern of these same amino acids differs. Evidently, the SIEVE and EffectiveT3 machine-learning algorithms recognize a role of the amino acid pattern in T3SS effector signal recognition. However, all three programs need further improvements as none of them successfully predicted the secretion of all the T3SS effectors SptP, SopD-2, GtgE and YopH as shown in Table 2. The inconsistencies in these predictions suggest that T3SS effector targeting is a complex and multifaceted process that is still not fully understood.
Table 2.
T3SS effector predictions using the N-terminal amino acid sequences in Table 1 and three different type III secretion system SVM-based prediction programs
| Peptide | SIEVEa | EFFECTIVEb | T3SS-EFc |
|---|---|---|---|
| SseJ | YES | YES | YES |
| SseJ-H | YES | YES | NO |
| SseJ-L | NO | NO | NO |
| SptP | YES | NO | NO |
| SopD-2 | YES | NO | YES |
| GtgE | YES | YES | NO |
| YopH | NO | YES | NO |
Program at www.sysbep.org/sieve.24
Program at www.effectors.org using the standard set and a 0.95 cutoff.22
Program at gecco.org.chemie.uni-frankfurt.de/T3SS_prediction/T3SS_prediction.html using SVM.23
Conclusions
The signal–CyaA fusion assay showed that the sequence order of the N-terminal 30-residues of SseJ was important for translocation through the type III secretion apparatus; the CyaA fusion constructs with scrambled sequences were secreted into macrophage less effectively than the wild-type sequence. Of the two scrambled sequences, the peptide with the lowest SIEVE probability score, SseJ-L, was translocated most poorly into the host macrophage. If these observations made for SseJ are true for all T3SS secretion signals, then a component of signal recognition depends on the pattern of the composition bias of the amino acids in the sequence.24 Both the CD and NMR structural studies showed that peptides consisting of the N-terminal regions of SseJ and the known S. Typhimurium effectors SptP, SopD-2, GtgE, and the Y. pestis effector YopH, were unstructured in 100% aqueous solution. Because such an absence of canonical structure may be due to the loss of tertiary interactions with the parent protein, the powerful structure stabilizing agent HFIP was used to determine if these peptides contained a common structural motif that may contribute to effector recognition by type III secretion systems. While CD spectroscopy showed an increase in helical content of the peptides in 25% HFIP, a detailed analysis of the structures by NMR spectroscopy indicated that the helical content was transient in nature because no long range, 1HN(i) to 1Hα(i + 3) NOEs characteristic of a long-lived, rigid, α-helix were observed. Note that fluoroalcohols, such as TFE and HFIP, will not induce helix formation independently of the peptide sequence, but instead, stabilize helices in regions with a propensity to adopt α-helices.74 Peptides removed from their corresponding region in the native protein may adopt a non-native like conformation in the presence of co-solvents if the tertiary environment of the protein has a large influence on the secondary structure of the peptide.55,57 For example, peptide fragments from regions of β-lactoglobulin that adopt β-strand conformations in the native protein were observed to adopt helical conformations in the presence of TFE.56 Consequently, the transient helical properties induced by HFIP in the N-terminal region of the effector peptides studied here may not reflect the conformation adopted by these regions in the native protein. Instead, it is more likely that intrinsic disorder in these N-terminal regions is the universal feature of effector secretion signal recognition.
In summary, the signal–CyaA studies presented here suggest the N-terminal sequence of effector proteins, in addition to its amino acid composition, plays a role in effector signal recognition. Such information may be useful for improving machine-learning computational approaches for identifying effector proteins from genomic sequence information. The structural studies of the N-terminal regions of the five known effector proteins studied here suggest they are all intrinsically disordered in solution. Such a feature may be important in secretion signal recognition of all effector proteins by the T3SS apparatus. Because intrinsic disorder is a feature common to many proteins, especially in eukaryotes, it may be difficult to exploit this N-terminal feature of effector proteins alone for targeting drugs. However, if machine-learning computational approaches can be improved to more reliably identify effector proteins, proteins that are often essential for virulence, then the number of potential protein drug targets that are species specific would increase for many Gram-negative pathogens.
Acknowledgements
This research was supported by the National Institute of Allergy and Infectious Diseases, NIH/DHHS, through interagency agreement Y1-AI-8401-01 with contributions from the NIH National Center for Research Resources (RR 18522), the NIH National Cancer Institute (R21 CA12619-01), the Washington State Life Sciences Discovery Fund, and the Laboratory Directed Research and Development program at Pacific Northwest National Laboratory (PNNL). Major portions of the research were performed at the W.R. Wiley Environmental Molecular Sciences Laboratory, a national scientific user facility sponsored by US Department of Energy’s Office of Biological and Environmental Research (BER) program located at PNNL. PNNL is operated for the US Department of Energy by Battelle.
References
- 1.Tindall BJ, Grimont PA, Garrity GM, Euzeby JP. Int. J. Syst. Evol. Microbiol. 2005;55:521–524. doi: 10.1099/ijs.0.63580-0. [DOI] [PubMed] [Google Scholar]
- 2.Bagger-Skjot L, Nielsen EM, Sandvang D, Ethelberg S, Monnet DL, Hammerum AM. J. Antimicrob. Chemother. 2007;59:814–815. doi: 10.1093/jac/dkm010. [DOI] [PubMed] [Google Scholar]
- 3.Crump JA, Luby SP, Mintz ED. Bull. W. H. O. 2004;82:346–353. [PMC free article] [PubMed] [Google Scholar]
- 4.Chen S, Zhoa C, White DG, Schroeder CM, Lu R, Yang H, McDermott PF, Ayers S, Meng J. Appl. Environ. Microbiol. 2003;2004:1–7. doi: 10.1128/AEM.70.1.1-7.2004. [DOI] [PMC free article] [PubMed] [Google Scholar]
- 5.Glynn MK, Bopp C, Dewitt W, Dabney P, Mokhtar M, Angulo FJ. N. Engl. J. Med. 1998;338:1333–1338. doi: 10.1056/NEJM199805073381901. [DOI] [PubMed] [Google Scholar]
- 6.Clatworthy AE, Pierson E, Hung DT. Nat. Chem. Biol. 2007;3:541–548. doi: 10.1038/nchembio.2007.24. [DOI] [PubMed] [Google Scholar]
- 7.Winstanley C, Hart CA. J. Med. Microbiol. 2001;50:116–126. doi: 10.1099/0022-1317-50-2-116. [DOI] [PubMed] [Google Scholar]
- 8.Cornelis GR. Nat. Rev. Microbiol. 2006;4:811–825. doi: 10.1038/nrmicro1526. [DOI] [PubMed] [Google Scholar]
- 9.Galan JE, Wolf-Watz H. Nature. 2006;444:567–573. doi: 10.1038/nature05272. [DOI] [PubMed] [Google Scholar]
- 10.Ghosh P. Microbiol. Mol. Biol. Rev. 2004;68:771–795. doi: 10.1128/MMBR.68.4.771-795.2004. [DOI] [PMC free article] [PubMed] [Google Scholar]
- 11.Wattiau P, Bernier B, Deslee P, Michiels T, Cornelis GR. Proc. Natl. Acad. Sci. U. S. A. 1994;91:10493–10497. doi: 10.1073/pnas.91.22.10493. [DOI] [PMC free article] [PubMed] [Google Scholar]
- 12.Lilic M, Vujanac M, Stebbins CE. Mol. Cell. 2006;21:653–664. doi: 10.1016/j.molcel.2006.01.026. [DOI] [PubMed] [Google Scholar]
- 13.Anderson DM, Ramamurthi KS, Tam C, Schneewind O. J. Bacteriol. 2002;184:1287–1295. doi: 10.1128/JB.184.5.1287-1295.2002. [DOI] [PMC free article] [PubMed] [Google Scholar]
- 14.Feldman MF, Muller S, Wuest E, Cornelis GR. Mol. Microbiol. 2002;46:1183–1197. doi: 10.1046/j.1365-2958.2002.03241.x. [DOI] [PubMed] [Google Scholar]
- 15.Hansen-Wester I, Stecher B, Hensel M. Infect. Immun. 2002;70:1619–1622. doi: 10.1128/IAI.70.3.1619-1622.2002. [DOI] [PMC free article] [PubMed] [Google Scholar]
- 16.Pan NJ, Brady MJ, Leong JM, Goguen JD. Antimicrob. Agents Chemother. 2009;53:385–392. doi: 10.1128/AAC.00670-08. [DOI] [PMC free article] [PubMed] [Google Scholar]
- 17.Lee VT, Kessler JL. IDrugs. 2009;12:636–641. [PubMed] [Google Scholar]
- 18.Michiels T, Cornelis GR. J. Bacteriol. 1991;173:1677–1685. doi: 10.1128/jb.173.5.1677-1685.1991. [DOI] [PMC free article] [PubMed] [Google Scholar]
- 19.Anderson DM, Schneewind O. Science. 1997;278:1140–1143. doi: 10.1126/science.278.5340.1140. [DOI] [PubMed] [Google Scholar]
- 20.Karavolos MH, Roe AJ, Wilson M, Henderson J, Lee JJ, Gally DL, Khan CM. J. Bacteriol. 2005;187:1559–1567. doi: 10.1128/JB.187.5.1559-1567.2005. [DOI] [PMC free article] [PubMed] [Google Scholar]
- 21.Crawford JA, Kaper JB. Mol. Microbiol. 2002;46:855–868. doi: 10.1046/j.1365-2958.2002.03214.x. [DOI] [PubMed] [Google Scholar]
- 22.Arnold R, Brandmaier S, Kleine F, Tischler P, Heinz E, Behrens S, Niinikoski A, Mewes HW, Horn M, Rattei T. PLoS Pathog. 2009;5:e1000376. doi: 10.1371/journal.ppat.1000376. [DOI] [PMC free article] [PubMed] [Google Scholar]
- 23.Lower M, Schneider G. PloS One. 2009;4:e5917. doi: 10.1371/journal.pone.0005917. [DOI] [PMC free article] [PubMed] [Google Scholar]
- 24.Samudrala R, Heffron F, McDermott JE. PLoS Pathog. 2009;5:e1000375. doi: 10.1371/journal.ppat.1000375. [DOI] [PMC free article] [PubMed] [Google Scholar]
- 25.Ginocchio CC, Galan JE. Infect. Immun. 1995;63:729–732. doi: 10.1128/iai.63.2.729-732.1995. [DOI] [PMC free article] [PubMed] [Google Scholar]
- 26.Frithz-Lindsten E, Holmstrom A, Jacobsson L, Soltani M, Olsson J, Rosqvist R, Forsberg A. Mol. Microbiol. 1998;29:1155–1165. doi: 10.1046/j.1365-2958.1998.00994.x. [DOI] [PubMed] [Google Scholar]
- 27.Rosqvist R, Hakansson S, Forsberg A, Wolf-Watz H. EMBO J. 1995;14:4187–4195. doi: 10.1002/j.1460-2075.1995.tb00092.x. [DOI] [PMC free article] [PubMed] [Google Scholar]
- 28.Muschiol S, Bailey L, Gylfe A, Sundin C, Hultenby K, Bergstrom S, Elofsson M, Wolf-Watz H, Normark S, Henriques-Normark B. Proc. Natl. Acad. Sci. U. S. A. 2006;103:14566–14571. doi: 10.1073/pnas.0606412103. [DOI] [PMC free article] [PubMed] [Google Scholar]
- 29.Bailey L, Gylfe A, Sundin C, Muschiol S, Elofsson M, Nordstrom P, Henriques-Normark B, Lugert R, Waldenstrom A, Wolf-Watz H, Bergstrom S. FEBS Lett. 2007;581:587–595. doi: 10.1016/j.febslet.2007.01.013. [DOI] [PubMed] [Google Scholar]
- 30.Negrea A, Bjur E, Ygberg SE, Elofsson M, Wolf-Watz H, Rhen M. Antimicrob. Agents Chemother. 2007;51:2867–2876. doi: 10.1128/AAC.00223-07. [DOI] [PMC free article] [PubMed] [Google Scholar]
- 31.Sory MP, Boland A, Lambermont I, Cornelis GR. Proc. Natl. Acad. Sci. U. S. A. 1995;92:11998–12002. doi: 10.1073/pnas.92.26.11998. [DOI] [PMC free article] [PubMed] [Google Scholar]
- 32.Geddes K, Worley M, Niemann G, Heffron F. Infect. Immun. 2005;73:6260–6271. doi: 10.1128/IAI.73.10.6260-6271.2005. [DOI] [PMC free article] [PubMed] [Google Scholar]
- 33.Gazi AD, Charova SN, Panopoulos NJ, Kokkinidis M. Cell. Microbiol. 2008;11:719–729. doi: 10.1111/j.1462-5822.2009.01297.x. [DOI] [PubMed] [Google Scholar]
- 34.Evdokimov AG, Tropea JE, Routzahn KM, Copeland TD, Waugh DS. Acta Crystallogr., Sect. D: Biol. Crystallogr. 2001;57:793–799. doi: 10.1107/s0907444901004875. [DOI] [PubMed] [Google Scholar]
- 35.Khandelwal P, Keliikuli K, Smith CL, Saper MA, Zuiderweg ER. Biochemistry. 2002;41:11425–11437. doi: 10.1021/bi026333l. [DOI] [PubMed] [Google Scholar]
- 36.Smith CL, Khandelwal P, Keliikuli K, Zuiderweg ER, Saper MA. Mol. Microbiol. 2001;42:967–979. doi: 10.1046/j.0950-382x.2001.02711.x. [DOI] [PubMed] [Google Scholar]
- 37.Evdokimov AG, Anderson DE, Routzahn KM, Waugh DS. J. Mol. Biol. 2001;312:807–821. doi: 10.1006/jmbi.2001.4973. [DOI] [PubMed] [Google Scholar]
- 38.Lee CC, Wood MD, Ng K, Andersen CB, Liu Y, Luginbuhl P, Spraggon G, Katagiri F. Structure. 2004;12:487–494. doi: 10.1016/j.str.2004.02.013. [DOI] [PubMed] [Google Scholar]
- 39.Dunker AK, Silman I, Uversky VN, Sussman JL. Curr. Opin. Struct. Biol. 2009;18:756–764. doi: 10.1016/j.sbi.2008.10.002. [DOI] [PubMed] [Google Scholar]
- 40.Hirota N, Mizuno K, Goto Y. Protein Sci. 1997;6:416–421. doi: 10.1002/pro.5560060218. [DOI] [PMC free article] [PubMed] [Google Scholar]
- 41.Roccatano D, Fioroni M, Zacharias M, Colombo G. Protein Sci. 2005;14:2582–2589. doi: 10.1110/ps.051426605. [DOI] [PMC free article] [PubMed] [Google Scholar]
- 42.Goddard TD, Kneller DG. University of California; San Francisco: 2000. [Google Scholar]
- 43.Wishart DS, Bigam CG, Yao J, Abildgaard F, Dyson HJ, Oldfield E, Markley JL, Sykes BD. J. Biomol. NMR. 1995;6:135–140. doi: 10.1007/BF00211777. [DOI] [PubMed] [Google Scholar]
- 44.Mason EA, McDaniel EW. Transport properties of ions in gases. JohnWiley & Sons; New York: 1988. [Google Scholar]
- 45.Tang K, Shvartsburg AA, Lee HN, Prior DC, Buschback MA, LI FM, Tolmachev AV, Anderson GA, Smith RD. Anal. Chem. 2005;77:3330–3339. doi: 10.1021/ac048315a. [DOI] [PMC free article] [PubMed] [Google Scholar]
- 46.Baker AS, Livesay EA, Orton DJ, Moore RJ, Danielson WF, III, Prior DC, Ibrahim YM, LaMarche BL, Mayampurath AM, Schepmoes AA, Hopkins DF, Tang K, Smith RD, Belov ME. J. Prot. Res. 2010;9:997–1006. doi: 10.1021/pr900888b. [DOI] [PMC free article] [PubMed] [Google Scholar]
- 47.Ruiz-Albert J, Yu X-J, Beuzon CR, Blakey AN, Galyov EE, Holden DW. Mol. Microbiol. 2002;44:645–661. doi: 10.1046/j.1365-2958.2002.02912.x. [DOI] [PubMed] [Google Scholar]
- 48.Ohlson MB, Fluhr K, Birmingham CL, Brumell JH, Miler SI. Infect. Immun. 2005;73:6249–6259. doi: 10.1128/IAI.73.10.6249-6259.2005. [DOI] [PMC free article] [PubMed] [Google Scholar]
- 49.Miao EA. Proc. Natl. Acad. Sci. U. S. A. 2000;97:7539–7544. doi: 10.1073/pnas.97.13.7539. [DOI] [PMC free article] [PubMed] [Google Scholar]
- 50.Johnson WCJ. Proteins. 1990;7:205–214. doi: 10.1002/prot.340070302. [DOI] [PubMed] [Google Scholar]
- 51.Woody RW. Methods Enzymol. 1995;246:34–71. doi: 10.1016/0076-6879(95)46006-3. [DOI] [PubMed] [Google Scholar]
- 52.Kelly SM, Jess TJ, Price NC. Biochim. Biophys. Acta. 2005;1751:119–139. doi: 10.1016/j.bbapap.2005.06.005. [DOI] [PubMed] [Google Scholar]
- 53.Uversky VN. Protein J. 2009;28:305–325. doi: 10.1007/s10930-009-9201-4. [DOI] [PubMed] [Google Scholar]
- 54.Wuthrich K. John Wiley & Sons; New York: 1986. pp. 117–199. [Google Scholar]
- 55.Sonnichsen FD, Van Eyk JE, Hodges RS, Sykes BD. Biochemistry. 1992;31:8790–8798. doi: 10.1021/bi00152a015. [DOI] [PubMed] [Google Scholar]
- 56.Hamada D, Kuroda Y, Tanaka T, Goto Y. J. Mol. Biol. 1995;254:737–746. doi: 10.1006/jmbi.1995.0651. [DOI] [PubMed] [Google Scholar]
- 57.Khandelwal P, Seth S, Hosur RV. Eur. J. Biochem. 1999;264:468–478. doi: 10.1046/j.1432-1327.1999.00641.x. [DOI] [PubMed] [Google Scholar]
- 58.Cort JR, Liu Z, Lee GM, Huggins KNL, Janes S, Prickett K, Andersen NH. Protein Eng. Des. 2009;22:497–513. doi: 10.1093/protein/gzp029. [DOI] [PMC free article] [PubMed] [Google Scholar]
- 59.Dyson HJ, Wright PE. Annu. Rev. Biophys. Biophys. Chem. 1991;20:519–538. doi: 10.1146/annurev.bb.20.060191.002511. [DOI] [PubMed] [Google Scholar]
- 60.Wyttenbach T, Bowers MT. Top. Curr. Chem. 2003;225:207–232. [Google Scholar]
- 61.Bohrer BC, Merenbloom SI, Koeniger SL, Hilderbrand AE, Clemmer DE. Annu. Rev. Anal. Chem. 2008;1:293–327. doi: 10.1146/annurev.anchem.1.031207.113001. [DOI] [PMC free article] [PubMed] [Google Scholar]
- 62.Kinnear BS, Hartings MR, Jarrol MF. J. Am. Chem. Soc. 2001;123:5660–5667. doi: 10.1021/ja004196e. [DOI] [PubMed] [Google Scholar]
- 63.Counterman AE, Clemmer DE. J. Amer. Chem. Soc. 2001;123:1490–1498. doi: 10.1021/ja9940625. [DOI] [PubMed] [Google Scholar]
- 64.Dyson HJ, Sayre JR, Merutka G, Shin H-C, Lerner RA, Wright PE. J. Mol. Biol. 1992;226:819–835. doi: 10.1016/0022-2836(92)90634-v. [DOI] [PubMed] [Google Scholar]
- 65.Tompa P. Trends Biochem. Sci. 2002;27:527–533. doi: 10.1016/s0968-0004(02)02169-2. [DOI] [PubMed] [Google Scholar]
- 66.Fink AL. Curr. Opin. Struct. Biol. 2005;15:35–41. doi: 10.1016/j.sbi.2005.01.002. [DOI] [PubMed] [Google Scholar]
- 67.Uversky VN, Dunker AK. Biochim. Biophys. Acta. 2010;1804:1231–1264. doi: 10.1016/j.bbapap.2010.01.017. [DOI] [PMC free article] [PubMed] [Google Scholar]
- 68.Bienkiewicz EA, Adkins JN, Lumb KJ. Biochemistry. 2002;41:752–759. doi: 10.1021/bi015763t. [DOI] [PubMed] [Google Scholar]
- 69.Dunker AK, Brown CJ, Lawsor JD, Iahoucheva LM, Obradovic Z. Biochemistry. 2002;41:6573–6582. doi: 10.1021/bi012159+. [DOI] [PubMed] [Google Scholar]
- 70.Radivojac P, Iakoucheva LM, Oldfield CJ, Obradovic Z, Uversky VN, Dunker AK. Biophys. J. 2007;92:1439–1456. doi: 10.1529/biophysj.106.094045. [DOI] [PMC free article] [PubMed] [Google Scholar]
- 71.Li X, Romero P, Rani M, Dunker AK, Obradovic Z. Genome Inf. 1999;10:30–40. [PubMed] [Google Scholar]
- 72.Romero P, Obradovic Z, Li X, Garner EC, Brown CJ, Dunker AK. Proteins: Struct., Funct., Genet. 2001;42:38–48. doi: 10.1002/1097-0134(20010101)42:1<38::aid-prot50>3.0.co;2-3. [DOI] [PubMed] [Google Scholar]
- 73.Rodgers L, Gamez A, Riek R, Ghosh P. J. Biol. Chem. 2008;283:20857–20863. doi: 10.1074/jbc.M802339200. [DOI] [PMC free article] [PubMed] [Google Scholar]
- 74.Lehrman SR, Tuls JL, Lund M. Biochemistry. 1990;29:5590–5596. doi: 10.1021/bi00475a025. [DOI] [PubMed] [Google Scholar]