Abstract
We sought to determine whether obese adolescents with high-“normal” 2-h post-oral glucose tolerance test glucose levels display defects in insulin secretion and sensitivity associated with future development of impaired glucose tolerance (IGT). Insulin sensitivity was measured by hyperinsulinemic-euglycemic clamp and insulin secretion by applying mathematical modeling during the hyperglycemic clamp in 60 normal glucose tolerance (NGT) obese adolescents, divided into three groups based on the 2-h glucose values (<100, 100–119, 120–139 mg/dL), and in 21 IGT obese adolescents. Glucose tolerance was reevaluated after 2 years. Insulin sensitivity decreased significantly across 2-h glucose NGT categories, while the highest NGT category and IGT group were similar. First-phase insulin secretion decreased across NGT categories, while no difference was found between the highest NGT group and IGT subjects. Second-phase secretion was similar across all NGT and IGT groups. The disposition index (CDI) decreased across NGT categories, while no difference was observed between the highest NGT and IGT subjects. Age and CDI were the best predictors of 2-h glucose after two years. Across rising categories of normal 2-h glucose levels, NGT obese adolescents exhibit significant impairment of β-cell function relative to insulin sensitivity associated with the development of IGT.
Glucose tolerance is typically categorized as either normal (NGT) or impaired (IGT), based on 2-h plasma glucose concentration during an oral glucose tolerance test (OGTT) (1). Studies in youth have demonstrated defects in β-cell function across the spectrum of glucose tolerance (2,3). Interestingly, β-cell defects appear to be evident in individuals with high-normal 2-h glucose (4). Although recent cross-sectional clamp studies have indicated a decline in the disposition index (CDI) in obese children with 2-h glucose below IGT levels (5), no longitudinal studies have monitored the evolution of these defects. The overall hypothesis of this study was that the 2-h glucose represents a continuum and that rising levels, even within the seemingly normal range, represent increased risk for glucose tolerance deterioration. Therefore, we tested two hypotheses: 1) that obese youths with high-normal 2-h post-OGTT glucose levels display defects in both insulin secretion and sensitivity similar to those present in IGT subjects; and 2) that subjects with the highest-normal 2-h glucose will have a greater likelihood of developing IGT over time. We tested these hypotheses through mathematical modeling of insulin secretion during a hyperglycemic clamp in NGT obese adolescents stratified into three levels of 2-h glucose values and in a group of IGT obese youths. Glucose tolerance in NGT subjects was evaluated longitudinally.
RESEARCH DESIGN AND METHODS
Subjects were recruited from a multiethnic cohort participating in the Yale Pathophysiology of Type 2 Diabetes in Youth Study, a long-term project aimed to study early alterations in glucose metabolism in obese youth (4). The study was approved by the Human Investigations Committee of the Yale School of Medicine. In order to be eligible, subjects needed to be obese and not be taking medications that affect glucose metabolism. In addition to parental consent, complete medical histories and thorough physical examinations were obtained from each participant. Stage of development was assessed on the basis of breast development in girls and genital development in boys according to Tanner criteria. All subjects were negative for autoimmune markers for type 1 diabetes (insulin antibody, GAD65, and islet cell antibody 512).
Study population: cross-sectional data in the entire cohort.
A multiethnic cohort of 1,601 obese Caucasian, African American, and Hispanic youth participated in the study (Supplementary Table). All subjects underwent a single OGTT and 80.2% were NGT (fasting plasma glucose <100 mg/dL and 2-h glucose <140 mg/dL) and 19.8% were IGT (140 mg/dL ≤2-h glucose ≤199 mg/dL). The distribution of 2-h glucose levels in NGT and IGT subjects was evaluated. In addition, according to the 2-h glucose levels, NGT subjects were divided into three groups: 1) less than 100 mg/dL, 2) 100–119 mg/dL, and 3) 120–139 mg/dL (4). In a previous study, we found the results from the OGTT to be reproducible because intraindividual variability was low in obese youth (6).
Study population in the subgroup analysis: cross-sectional and longitudinal data.
As part of the Yale Pathophysiology of Type 2 Diabetes in Youth Study, all subjects were offered a hyperglycemic clamp and a hyperinsulinemic-euglycemic clamp at baseline. Only those who participated in both clamp studies (60 NGT and 21 IGT) were included in this analysis. Cross-sectional data on 30 subjects from both the hyperglycemic and euglycemic clamp have been previously reported (2,7). Clinical and anthropometric characteristics of the subgroup were similar. NGT subjects in the subgroup were also divided into three groups based on the 2-h glucose values. A subgroup of 21 obese IGT subjects who underwent a similar study paradigm was used to compare the magnitude of differences in insulin sensitivity and secretion across categories of NGT and IGT.
After a follow-up period of ∼27 months, 75 out of 81 subjects (55 NGT and 20 IGT) performed a second OGTT. The time interval was based on our previous study suggesting that changes in categories of glucose tolerance in obese adolescents are likely to occur over a relatively short period of time (8). During the follow-up, all participants received nutritional guidance and recommendations for physical activity.
OGTT.
At 8:00 a.m. following a 10- to 12-h overnight fast, a standard OGTT (1.75 g/kg body wt, up to 75 g) was conducted to determine glucose tolerance (9).
Calculations from the OGTT.
Estimated insulin sensitivity was calculated using the Matsuda index (10) (whole-body insulin sensitivity index [WBISI]), as reported (11). The insulinogenic index (IGI) (12) was defined by Δinsulin (0–30, pmol/L)/Δglucose (0–30, mmol/L), and was found to correlate with first-phase insulin secretion measured by the hyperglycemic clamp (r = 0.56; P < 0.001). We also calculated the disposition index as the product of WBISI and IGI obtained during the OGTT (ODI).
The β-cell demand index (BCDI) was calculated as the ratio of IGI and WBISI (13). This index represents the additional burden placed on β-cell function by decreasing insulin sensitivity. The area under the curve (AUC) for insulin and C-peptide was calculated using the trapezoidal rule.
Assessment of insulin sensitivity: hyperinsulinemic-euglycemic clamp.
The subjects were admitted to the at Yale Hospital Research Unit at 7:30 a.m. Two intravenous catheters, one for blood sampling and one for infusion of glucose, insulin, and 6,6-deuterium–labeled glucose, were inserted in the antecubital vein of each arm after local infiltration with lidocaine. Whole-body insulin sensitivity was measured by infusing insulin at a continuous infusion rate of 80 mU/m2 ∙ min and by using the hot-GINF method to maintain the plasma glucose enrichment constant (14). Glucose disposal (M) was measured during the last 30 min of the clamp (steady state) and expressed as milligrams per m2 body surface per minute (M = mg/m2 ∙ min) (12).
Assessment of insulin secretion: hyperglycemic clamp.
To quantify insulin secretion, plasma glucose concentration was raised to 11 mmol/L by infusion of 20% dextrose at variables rates and kept at that value for 120 min (2). Samples were drawn at 2, 4, 6, 8, 10, and every 20 min thereafter for glucose, insulin, and C-peptide concentrations. Incremental first-phase concentration of insulin and C-peptide was calculated as the mean of 2-, 4-, 6-, 8-, and 10-min values minus the fasting levels. Mean second-phase concentration of insulin and C-peptide was calculated as the mean value of 60 and 120 min.
Analysis of the hyperglycemic clamp data.
The analyses of glucose and C-peptide curves during the hyperglycemic clamp follow the general strategy proposed by several laboratories (15) with slight, previously described modifications (7). Insulin secretion during the hyperglycemic clamp is described as the sum of three components: 1) basal (postabsorptive) secretion rates, 2) insulin secretion in response to the rate of increase in plasma glucose (dynamic secretion component [16,17], known as first-phase secretion), and 3) insulin secretion in response to the actual glucose levels above the postabsorptive glucose concentration (static or proportional secretion component [18], known as second-phase secretion). The proportional component is further boosted by a gain factor, which comes into effect during the last part of the clamp and is proportional to the integral of the hyperglycemic stimulus (18,19). Parameters were estimated by implementing the model of C-peptide secretion in the SAAM-II 1.2 software (SAAM Institute, Seattle, WA). Numerical values of unknown parameters were estimated by using nonlinear least squares. Weights were chosen optimally (equal to the inverse of the variance of the measurement errors) and were assumed to be additive, uncorrelated, with zero mean, and a constant coefficient of variation (CV) of 13%. The main outputs of this model are glucose sensitivity of first-phase secretion (σ1, dynamic secretion component), expressed as the amount of insulin secreted in response to a rate of increase in glucose concentration rate of 1 mmol/L between time 0 and 1 min of the study (picomoles per kilogram lean body mass [LBM] per millimole per liter per minute) (the CV of glucose sensitivity of first-phase secretion, as estimated by the model, was 13.8 ± 1.2%); and glucose sensitivity of second-phase secretion (σ2, static secretion component), expressed as the steady-state insulin secretion rate in response to a steep increase in glucose concentration of 1 mmol/L (picomoles per minute per kilogram LBM per millimole per liter) (the CV of glucose sensitivity of second-phase secretion, as estimated by the model, was 19.6 ± 2.2%). We also calculated a disposition index as the product of glucose sensitivity of first-phase secretion (picomoles per kilogram LBM per millimole per liter per minute) obtained during the hyperglycemic clamp and glucose disposal (M, milligrams per m2 body surface per minute) obtained during the hyperinsulinemic-euglycemic clamp (CDI).
Abdominal MRI and total body composition.
Abdominal MRI studies were performed on a Siemens Sonata 1.5-T system, as previously reported (14). Total body composition was measured by dual-energy X-ray absorptiometry with a Hologic scanner (Boston, MA) (14).
Analytical methods.
Plasma glucose was determined with a YSI 2700 Analyzer (Yellow Springs Instruments, Yellow Springs, OH). Plasma lipid levels were determined with an AutoAnalyzer (Roche-Hitachi 747–200). Plasma insulin was measured with a radioimmunoassay (RIA) (Linco, St. Charles, MO), which has <1% crossreactivity with C-peptide and proinsulin. Plasma C-peptide levels were determined with an assay made by Diagnostic Product (Los Angeles, CA). Proinsulin was measured with another RIA kit (Linco). The intra-assay variation was 4.5% for insulin and 5.9% for C-peptide, and the interassay variation was 10% for insulin and 11% for C-peptide. Plasma adiponectin was measured by a double-antibody RIA (Millipore). The intra- and interassay CVs are 7.1 and 9.5%, respectively. Plasma leptin was measured using an RIA (Millipore). The intra- and interassay CVs are 6.5 and 8.0%, respectively. HbA1c was measured by high-performance liquid chromatography (Tosoh Medics).
Statistical analysis.
The distribution of continuous variables was tested for skewness and kurtosis, and those variables not normally distributed were logarithmically transformed. Differences in sex and ethnicity were assessed by χ2 test. Distribution of 2-h glucose distribution across the entire cohort was determined. Differences for continuous variables across the 2-h categories of NGT and IGT subjects were assessed by performing ANOVA or, when necessary, ANCOVA. Control for multiple comparisons was performed using the post hoc Bonferroni correction. To identify predictors of the 2-h glucose at the second OGTT in NGT youths who were longitudinally followed, a multiple stepwise regression analysis and a logistic regression analysis were performed. Two different models were evaluated by using 2-h glucose at the second OGTT as the dependent variable. The parameters included in the linear regression and logistic regression models as independent variables were age, sex, ethnicity, time between studies, BMI, and 2-h glucose at baseline. The two models were different for DI once calculated with the clamp data (CDI) and the other one with the OGTT (ODI). Statistical analyses were performed with SPSS (16.0 for Windows; SPSS, Chicago, IL). All data were expressed as mean ± SD. For all analyses, a P value less than 0.05 was considered statistically significant.
RESULTS
2-h glucose and ODI distribution across the entire cohort of obese youth.
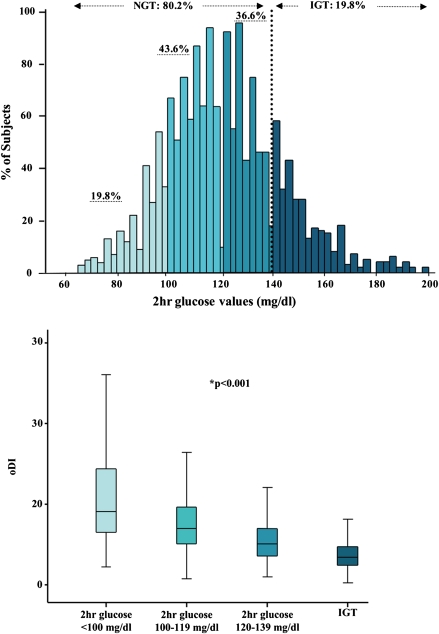
As shown in Fig. 1 and the Supplementary Table online, out of 1,601 subjects, 80.2% (n = 1,284) and 19.8% (n = 317) were defined as NGT and IGT, respectively. Within the NGT population, 19.8% (n = 252) had 2-h glucose values lower than 100 mg/dL; while 43.6% (n = 561) and 36.6% (n = 471) had 2-h glucose between 100 and 119 mg/dL and between 120 and 139 mg/dL, respectively. Age, sex, and ethnic distributions were similar across the groups (all P > 0.05), and no difference was documented for BMI Z score. Both IGI and WBISI significantly decreased across the three groups of NGT and IGT.
FIG. 1.
Distribution of 2-h glucose levels in the entire multiethnic cohort and distribution of ODI within each category of NGT (first group: <100 mg/dL; second group: 100–119 mg/dL; third group: 120–139 mg/dL) and in IGT (140 mg/dL ≤2-h glucose ≤199 mg/dL) obese children and adolescents. *ANCOVA test.
ODI decreased significantly (11.30 ± 7.05, 8.04 ± 4.47, 5.75 ± 3.07, and 3.74 ± 1.91) across 2-h glucose NGT categories and IGT, respectively (Fig. 1), while BCDI significantly increased (P < 0.001) (Supplementary Table).
Subgroup analysis: cross-sectional and longitudinal data
Baseline anthropometric and main biochemical parameters and estimates of insulin sensitivity and secretion in the three groups of NGT and the IGT subjects.
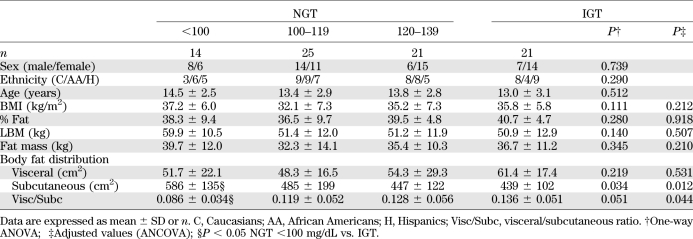
Table 1 shows the main anthropometric parameters of patients recruited for the clamp studies (60 with NGT) divided according to 2-h glucose levels and 21 IGT subjects. Age, sex, distribution in Tanner stage, and ethnicity were equally represented (all P < 0.05) across the three groups of NGT and IGT subjects. Likewise, BMI, percent fat, LBM, and fat mass were similar in all groups (P > 0.05) (Table 1). No significant differences were documented between the four groups in terms of visceral abdominal fat distribution (adjusted P = 0.531), while a significant trend was documented for subcutaneous fat distribution and of visceral/subcutaneous ratio fat distribution.
TABLE 1.
Main anthropometric parameters of patients with NGT and IGT divided according to 2-h glucose levels
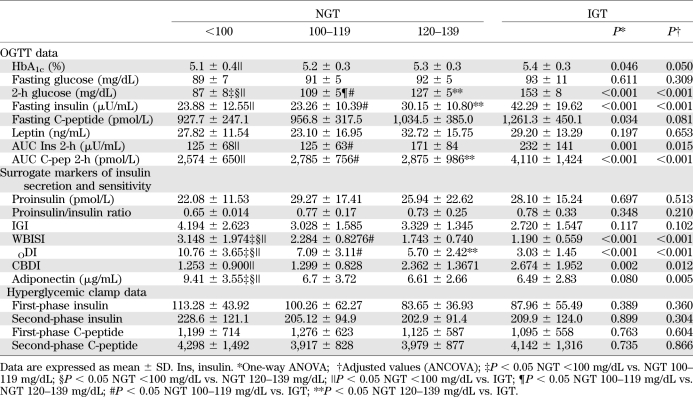
By design, there were significant differences in 2-h glucose levels across the NGT groups and IGT youth (Fig. 1). In contrast, fasting glucose, C-peptide, and leptin were similar across the three categories of 2-h glucose NGT subjects and IGT. Fasting insulin as well as the 2-h AUC for insulin and C-peptide were different among the four groups (P for trend ≤0.001) (Table 2). Of note, however, the NGT group with the highest 2-h glucose was not different from the IGT group for the AUC for insulin (Table 2). HbA1c was significant across all groups (P ≤ 0.05).
TABLE 2.
Main anthropometric parameters of patients with NGT and IGT divided according to 2-h glucose levels
Across the 2-h glucose NGT categories and IGT subjects, the surrogate markers of insulin secretion (proinsulin, proinsulin/insulin ratio, IGI) were not different. Surrogate markers of insulin sensitivity (WBISI and adiponectin) significantly decreased while BCDI significantly increased with the increasing of the 2-h glucose group, thus showing significant differences between the lowest NGT category and the other three groups. In contrast, no significant difference was documented between the IGT group and the middle and the highest NGT category. Similarly, ODI significantly decreased with the increasing of the 2-h glucose group.
Insulin sensitivity and secretion from the clamp studies.
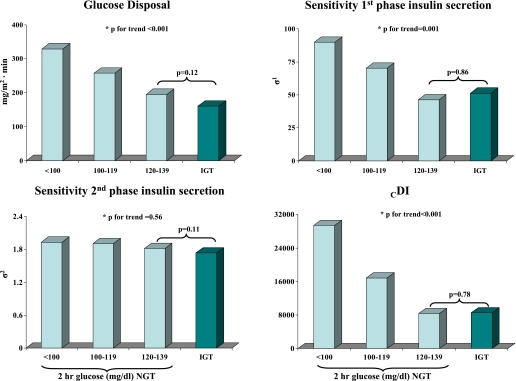
Whole-body insulin sensitivity decreased significantly across the 2-h glucose categories in NGT obese youth (Fig. 2). Although a trend toward lower values was documented in IGT subjects, there was no significant difference when the group with the highest 2-h glucose levels was compared with the IGT group. First- and second-phase absolute insulin and C-peptide levels across the NGT and IGT groups were not significantly different (Table 2). However, differences in insulin secretion emerged using model-derived insulin secretion parameters among the three groups of NGT and the IGT youths, as shown in Fig. 2. The sensitivity of the first-phase insulin secretion significantly and progressively decreased across the NGT categories, while no difference was found between the highest group of NGT and IGT subjects. The booster component of second-phase secretion was similar across all NGT and IGT groups. As previously described (14), this additional component of insulin secretion is a glucose/time-dependent amplifier of second-phase secretion, which significantly improves the description of insulin secretion dynamics in the final part of the study (last 20–40 min) when compared with the previous model (14,17,20).
FIG. 2.
Hyperinsulinemic-euglycemic clamp–derived insulin sensitivity (glucose disposal), model-derived insulin secretion parameters (sensitivity first-phase insulin secretion and sensitivity second-phase insulin secretion), and CDI (glucose disposal · sensitivity first-phase insulin secretion) among the three groups of NGT and the IGT youth. *ANCOVA test.
Figure 2 also displays CDI calculated by multiplying the glucose disposal and the model-derived insulin secretion (sensitivity first-phase insulin secretion). CDI significantly and progressively decreased across the NGT categories, while no significant difference was documented between the highest group of NGT and IGT subjects.
Longitudinal data: predicting glucose at 2 h on the second OGTT.
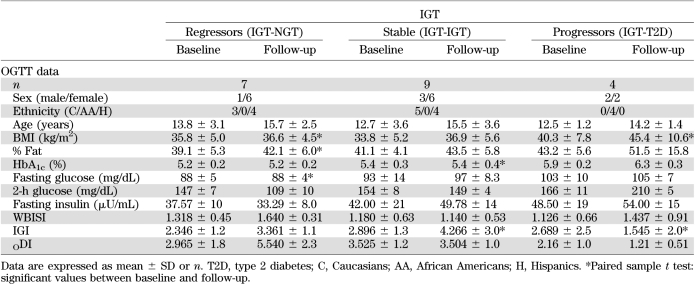
Among the NGT and IGT groups, 55 (n = 12, NGT <100; n = 24, NGT 100–119; n = 19, NGT 120–139 mg/dL) and 20 subjects, respectively, were longitudinally followed for an average period of 2.1 ± 1.2 years (Δ of follow-up: 2.09 ± 0.7, 2.2 ± 1.06, 2.1 ± 0.6, respectively, P for trend across the three groups, P = 0.72) and 2.2 ± 1.08 years, respectively (Tables 3 and 4). Of the NGT groups, 42 (76%) maintained the same status during the second OGTT (n = 12, NGT <100; n = 19, NGT 100–119; n = 11, NGT 120–139) while 13 (24%) progressed to IGT (n = 5, NGT 100–119, 20.8%; n = 8, NGT 120–139, 42.1%) (Table 3). Of the IGT group, nine subjects remained IGT (45%), seven regressed to NGT (35%), and four progressed to type 2 diabetes (20%) (Table 4).
TABLE 3.
Main anthropometric parameters of the 55 patients with NGT divided according to 2-h glucose levels, who performed the follow-up study
TABLE 4.
Main anthropometric parameters of the 20 patients with IGT who performed the follow-up study
The main clinical characteristics of the NGT and IGT subjects who performed the longitudinal follow-up are reported in Tables 3 and 4. As shown in the tables, after dividing the NGT and IGT groups according to changes in category over the follow-up, NGT subjects who progressed to IGT or type 2 diabetes (progressors) tended to present at baseline higher HbA1c and lower WBISI and DI values compared with those in the same group who did not change (nonprogressors). Similarly, in the IGT group, subjects who progressed to type 2 diabetes or regressed to NGT (progressors and regressors, respectively) tended to have different values at baseline in terms of HbA1c and WBISI values compared with those in the same group who do not change (nonprogressors).
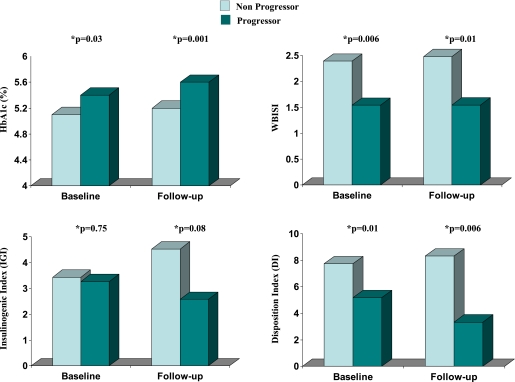
In addition, after combining NGT subjects from all three categories, NGT subjects who progressed to IGT (progressors) tended to present higher HbA1c and lower WBISI and ODI values at baseline and follow-up compared with those in the same group who did not change (nonprogressors) (Fig. 3); IGI was lower but did not reach significant values. Therefore, these results confirmed pre-existing impaired β-cell function in those NGT subjects who developed IGT during follow-up.
FIG. 3.
Baseline and follow-up values for HbA1c, WBISI, IGI, and ODI in NGT subjects divided according to development of IGT at follow-up (progressors [dark green bars] vs. nonprogressors [light green bars]). *ANCOVA test.
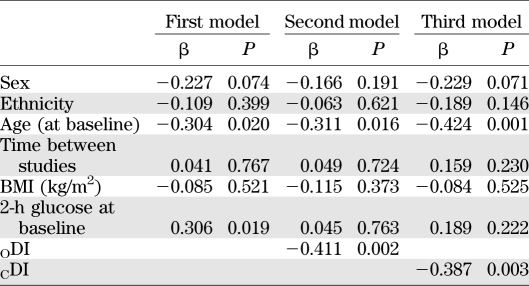
We used a multiple stepwise regression analysis to evaluate predictors of the follow-up 2-h glucose using age, baseline BMI, time interval, sex, ethnicity, and the baseline 2-h glucose as independent variables, and then added ODI or CDI to the model (Table 5). As shown in Table 5, 2-h glucose at baseline significantly predicted 2-h glucose on follow-up. When ODI (second model) or CDI (third model) were added to the analysis, these two factors were significantly and indirectly associated to 2-h glucose at follow-up. The highest was DI at baseline, while the lowest was the 2-h glucose at follow-up. Age was a significant predictor in all three models. Similar results were observed when using a logistic regression analysis for both age (P = 0.03, β = −0.798, SE = 0.374) and CDI (P = 0.04, β = −0.00045, SE = −0.00022).
TABLE 5.
Linear regression model for predicting 2-h glucose on the second OGTT in NGT subjects
DISCUSSION
Our results demonstrate that a high percent of adolescent obese subjects (82%) present 2-h glucose values above 100 mg/dL. In addition, we observed significant declines of insulin sensitivity and secretion across rising categories of 2-h glucose concentration, both of which were associated with the risk of progressing to IGT later in life. Thus, the present findings indicate that β-cell function relative to insulin sensitivity is impaired even in youth classified as NGT but with high 2-h glucose levels, highlighting the fact that the 2-h glucose spectrum reflects declining β-cell function.
By analyzing data from a multiethnic cohort of obese youth, we showed that 36.6% and 43.6% of the study population had 2-h glucose levels within the higher category, while only a small percent (19.8%) of the entire cohort had 2-h glucose lower than 100 mg/dL. Characterization of β-cell function in these different groups of obese youth reveals a hidden high percentage of subjects who, although classified as NGT, are apparently at high risk for developing glucose intolerance or diabetes. These results are important when we consider that the unabated rise in childhood obesity has led to the emergence and progression of IGT and type 2 diabetes at younger ages (21).
Recent results in adult subjects have shown defects in β-cell function relative to insulin sensitivity already within the normal 2-h glucose. In fact, a 41% decrease of DI derived from OGTT data have been documented in adult males with 2-h glucose levels below the accepted normal cut-off range of 140 mg/dL (22,23). In addition, a significant decrease of the acute insulin response in relation to the severity of insulin resistance has been documented in subjects with 2-h glucose levels ≥100 mg/dL in NGT adult subjects (24). Similar findings in obese NGT children and adolescents were previously reported by our group (4), showing the presence of impaired OGTT-derived DI values already in childhood. In contrast to past studies in which only surrogate markers of β-cell function were used, our study confirmed these findings using state-of-art techniques. After dividing the study population into three categories of 2-h glucose tolerance, we showed a progressive and significant decline of insulin sensitivity, insulin secretion, and DI across the categories of 2-h glucose in NGT subjects. Of note, by comparing the highest category of 2-h glucose levels in the NGT group and IGT youth, we documented no significant differences in terms of both insulin sensitivity measured by the hyperinsulinemic-euglycemic clamp and model-derived insulin secretion defined by the sensitivity first phase. Similarly, CDI was similar between the highest group of NGT and IGT subjects. We have shown impaired β-cell function within the high-normal 2-h glucose levels reminiscent of IGT subjects.
In a previous longitudinal study, Weiss et al. (8) showed that changes in insulin sensitivity derived from an OGTT and not fasting samples can serve as predictors of changes in glucose tolerance. However, indexes of insulin sensitivity (WBISI) and early insulin responses to oral glucose (IGI) that were derived from baseline and follow-up OGTTs did not appear to be significant predictors for the development of type 2 diabetes when viewed in isolation. Our current study is consistent with the finding reported by Cali et al. (3) showing that obese NGT adolescents who progress to IGT manifest primary defects in β-cell function defined by the oral minimal model. Additionally, the current study provides new data on the pre-existing defects in both insulin sensitivity and secretion by using measures that allowed the calculation of β-cell function relative to insulin sensitivity (CDI). Importantly, the current study allows, for the availability of longitudinal data evaluating changes in glucose tolerance over a follow-up period, to firmly characterize the risk of development of abnormalities in glucose metabolism in all the different categories. Specifically, the key finding emerging from the longitudinal follow-up is that after an average follow-up period of 2.1 years, none of the subjects within the lower categories of 2-h glucose progressed to IGT, while the percent of progressors gradually rose with increasing 2-h glucose levels, reaching a percentage of 20.8% and 42.1% in the middle and higher groups, respectively. In addition, the baseline DI, which significantly assesses β-cell function in the context of insulin sensitivity, predicts the risk of deteriorating glucose tolerance. In fact, DI obtained from OGTT and the clamp was significantly associated to the 2-h glucose on the second OGTT independent of baseline 2-h glucose. Furthermore, both regression analyses showed that age has a negative effect on the 2-h glucose on the longitudinal follow-up.
Our findings highlight that obese youth with a 2-h (OGTT) plasma glucose concentration within the seemingly normal range of glucose tolerance (particularly those with a 2-h plasma glucose concentration >120 mg/dL) are not entirely “normal” with respect to glucose metabolism and risk of developing diabetes. Taken collectively, observations in subjects with a 2-h plasma glucose concentration <140 mg/dL argue against the notion that all young obese subjects below the standard cut-off value are safe from the risks associated with glucose intolerance. Rather, glucose intolerance, insulin resistance, and β-cell dysfunction should be considered continuous parameters that increase the likelihood of developing type 2 diabetes.
The strength of the current study stems from both indirect and direct measures of insulin sensitivity and secretion which allowed us to test differences in β-cell function within the 2-h glucose categories in NGT youth, and between IGT and the highest group of 2-h glucose in NGT. The availability of longitudinal data allowed us to determine the risk of glucose intolerance development later in life. The study may be limited by its use of a clinic-based sample of obese children and adolescents, which may not be truly representative of the general population.
In summary, a high percentage of obese youth with NGT have 2-h glucose values slightly below of the cut-off values of 140 mg/dL. Across the categories of normal 2-h glucose concentrations, those individuals in the higher 2-h glucose group manifest greater insulin resistance, reduced insulin secretion, and DI compared with those whose plasma glucose concentration is in the lower category. Thus, in obese youth classified as NGT but with 2-h glucose levels in the higher range, reduced β-cell function relative to insulin sensitivity has already developed, increasing the future risk of impaired glucose tolerance.
ACKNOWLEDGMENTS
This work was supported by the National Institutes of Health (NIH) (grants R01-HD-40787, R01-HD-28016, and K24-HD-01464 to S.C.), the National Center for Research Resources, NIH (Clinical and Translational Science Award grant UL1-RR-024139), and the Stephen I. Morse Pediatric Diabetes Research Fund.
A.C. is employed by Eli Lilly and Company. No other potential conflicts of interest relevant to this article were reported.
C.G. analyzed the data and wrote the manuscript. R.B. performed the mathematical modeling of insulin secretion and reviewed the manuscript. A.C. and N.S. contributed to discussion and reviewed the manuscript. B.P. and M.S. performed all OGTT studies. R.W. and S.C. conceived the study and contributed to the analysis and writing of the manuscript. S.C. is the guarantor of this work and, as such, had full access to all the data in the study and takes responsibility for the integrity of the data and the accuracy of the data analysis.
The authors are particularly grateful to all the adolescents who participated in the study and thank the nursing staff for the excellent care given to our subjects during the studies. The authors also thank Mikhail Smolgovsky, Aida Groszmann, Andrea Belous, and the staff of the Yale–New Haven Hospital General Clinical Research Center for expert technical assistance with the studies. The authors are indebted to Dr. Linda Boselli (Department of Medicine, University of Verona, Verona, Italy) for performing the model bases assessment of β-cell function.
Footnotes
This article contains Supplementary Data online at http://diabetes.diabetesjournals.org/lookup/suppl/doi:10.2337/db11-1111/-/DC1.
See accompanying commentary, p. 562.
REFERENCES
- 1.American Diabetes Association Diagnosis and classification of diabetes mellitus. Diabetes Care 2010;33(Suppl. 1):S62–S69 [DOI] [PMC free article] [PubMed] [Google Scholar]
- 2.Weiss R, Caprio S, Trombetta M, Taksali SE, Tamborlane WV, Bonadonna R. Beta-cell function across the spectrum of glucose tolerance in obese youth. Diabetes 2005;54:1735–1743 [DOI] [PubMed] [Google Scholar]
- 3.Cali AM, Man CD, Cobelli C, et al. Primary defects in beta-cell function further exacerbated by worsening of insulin resistance mark the development of impaired glucose tolerance in obese adolescents. Diabetes Care 2009;32:456–461 [DOI] [PMC free article] [PubMed] [Google Scholar]
- 4.Yeckel CW, Taksali SE, Dziura J, et al. The normal glucose tolerance continuum in obese youth: evidence for impairment in beta-cell function independent of insulin resistance. J Clin Endocrinol Metab 2005;90:747–754 [DOI] [PubMed] [Google Scholar]
- 5.Burns SF, Bacha F, Lee SJ, et al. Declining β-cell function relative to insulin sensitivity with escalating OGTT 2-h glucose concentrations in the nondiabetic through the diabetic range in overweight youth. Diabetes Care 2011;34:2033–2040 [DOI] [PMC free article] [PubMed] [Google Scholar]
- 6.Sinha R, Fisch G, Teague B, et al. Prevalence of impaired glucose tolerance among children and adolescents with marked obesity. N Engl J Med 2002;346:802–810 [DOI] [PubMed] [Google Scholar]
- 7.Cali AM, Bonadonna RC, Trombetta M, Weiss R, Caprio S. Metabolic abnormalities underlying the different prediabetic phenotypes in obese adolescents. J Clin Endocrinol Metab 2008;93:1767–1773 [DOI] [PMC free article] [PubMed] [Google Scholar]
- 8.Weiss R, Taksali SE, Tamborlane WV, Burgert TS, Savoye M, Caprio S. Predictors of changes in glucose tolerance status in obese youth. Diabetes Care 2005;28:902–909 [DOI] [PubMed] [Google Scholar]
- 9.Expert Committee on the Diagnosis and Classification of Diabetes Mellitus Report of the Expert Committee on the Diagnosis and Classification of Diabetes Mellitus. Diabetes Care 2003;26(Suppl. 1):S5–S20 [DOI] [PubMed] [Google Scholar]
- 10.Matsuda M, DeFronzo RA. Insulin sensitivity indices obtained from oral glucose tolerance testing: comparison with the euglycemic insulin clamp. Diabetes Care 1999;22:1462–1470 [DOI] [PubMed] [Google Scholar]
- 11.Yeckel CW, Weiss R, Dziura J, et al. Validation of insulin sensitivity indices from oral glucose tolerance test parameters in obese children and adolescents. J Clin Endocrinol Metab 2004;89:1096–1101 [DOI] [PubMed] [Google Scholar]
- 12.Phillips DI, Clark PM, Hales CN, Osmond C. Understanding oral glucose tolerance: comparison of glucose or insulin measurements during the oral glucose tolerance test with specific measurements of insulin resistance and insulin secretion. Diabet Med 1994;11:286–292 [DOI] [PubMed] [Google Scholar]
- 13.Weiss R, Cali AM, Dziura J, Burgert TS, Tamborlane WV, Caprio S. Degree of obesity and glucose allostasis are major effectors of glucose tolerance dynamics in obese youth. Diabetes Care 2007;30:1845–1850 [DOI] [PubMed] [Google Scholar]
- 14.Weiss R, Dufour S, Taksali SE, et al. Prediabetes in obese youth: a syndrome of impaired glucose tolerance, severe insulin resistance, and altered myocellular and abdominal fat partitioning. Lancet 2003;362:951–957 [DOI] [PMC free article] [PubMed] [Google Scholar]
- 15.DeFronzo RA, Tobin JD, Andres R. Glucose clamp technique: a method for quantifying insulin secretion and resistance. Am J Physiol 1979;237:E214–E223 [DOI] [PubMed] [Google Scholar]
- 16.Mari A, Camastra S, Toschi E, et al. A model for glucose control of insulin secretion during 24 h of free living. Diabetes 2001;50(Suppl. 1):S164–S168 [DOI] [PubMed] [Google Scholar]
- 17.Mari A, Tura A, Gastaldelli A, Ferrannini E. Assessing insulin secretion by modeling in multiple-meal tests: role of potentiation. Diabetes 2002;51(Suppl. 1):S221–S226 [DOI] [PubMed] [Google Scholar]
- 18.Steil GM, Rebrin K, Janowski R, Darwin C, Saad MF. Modeling beta-cell insulin secretion—implications for closed-loop glucose homeostasis. Diabetes Technol Ther 2003;5:953–964 [DOI] [PubMed] [Google Scholar]
- 19.Akaike H. A new look at the statistical model identification. IEEE Trans Automat Contr 1974;19:716–723 [Google Scholar]
- 20.Dalla Man C, Caumo A, Cobelli C. The oral glucose minimal model: estimation of insulin sensitivity from a meal test. IEEE Trans Biomed Eng 2002;49:419–429 [DOI] [PubMed] [Google Scholar]
- 21.Rosenbloom AL, Joe JR, Young RS, Winter WE. Emerging epidemic of type 2 diabetes in youth. Diabetes Care 1999;22:345–354 [DOI] [PubMed] [Google Scholar]
- 22.Stancáková A, Javorský M, Kuulasmaa T, Haffner SM, Kuusisto J, Laakso M. Changes in insulin sensitivity and insulin release in relation to glycemia and glucose tolerance in 6,414 Finnish men. Diabetes 2009;58:1212–1221 [DOI] [PMC free article] [PubMed] [Google Scholar]
- 23.Bonadonna RC, Stumvoll M, Fritsche A, et al. Altered homeostatic adaptation of first- and second-phase beta-cell secretion in the offspring of patients with type 2 diabetes: studies with a minimal model to assess beta-cell function. Diabetes 2003;52:470–480 [DOI] [PubMed] [Google Scholar]
- 24.Ferrannini E, Gastaldelli A, Miyazaki Y, Matsuda M, Mari A, DeFronzo RA. beta-Cell function in subjects spanning the range from normal glucose tolerance to overt diabetes: a new analysis. J Clin Endocrinol Metab 2005;90:493–500 [DOI] [PubMed] [Google Scholar]


