Abstract
All-trans-retinoic acid (atRA) stimulates neurogenesis, dendritic growth of hippocampal neurons, and higher cognitive functions, such as spatial learning and memory formation. Although astrocyte-derived atRA has been considered a key factor in neurogenesis, little direct evidence identifies hippocampus cell types and the enzymes that biosynthesize atRA. Here we show that primary rat astrocytes, but not neurons, biosynthesize atRA using multiple retinol dehydrogenases (Rdh) of the short chain dehydrogenase/reductase gene family and retinaldehyde dehydrogenases (Raldh). Astrocytes secrete atRA into their medium; neurons sequester atRA. The first step, conversion of retinol into retinal, is rate-limiting. Neurons and astrocytes both synthesize retinyl esters and reduce retinal into retinol. siRNA knockdown indicates that Rdh10, Rdh2 (mRdh1), and Raldh1, -2, and -3 contribute to atRA production. Knockdown of the Rdh Dhrs9 increased atRA synthesis ∼40% by increasing Raldh1 expression. Immunocytochemistry revealed cytosolic and nuclear expression of Raldh1 and cytosol and perinuclear expression of Raldh2. atRA autoregulated its concentrations by inducing retinyl ester synthesis via lecithin:retinol acyltransferase and stimulating its catabolism via inducing Cyp26B1. These data show that adult hippocampus astrocytes rely on multiple Rdh and Raldh to provide a paracrine source of atRA to neurons, and atRA regulates its own biosynthesis in astrocytes by directing flux of retinol. Observation of cross-talk between Dhrs9 and Raldh1 provides a novel mechanism of regulating atRA biosynthesis.
Keywords: Brain Metabolism, Dehydrogenase, Enzyme Kinetics, Retinoid, Retinoid-binding Protein, Cytochrome P450, Retinoic Acid, Retinol
Introduction
Vitamin A (retinol) metabolism produces the autacoid all-trans-retinoic acid (atRA),2 which regulates multiple processes required for vertebrate reproduction, embryonic development, immunity, growth, and systems homeostasis (1–5). atRA regulates proliferation, differentiation, and apoptosis of many cell types, including epithelial, preadipocytes, and neuronal stem cells (6–8). Molecular, cellular, and behavioral studies confirm that central nervous system development and function rely on atRA (9–11). atRA functions in the nervous system via the nuclear RA hormone receptors, to regulate both transcription and translation (12–14). For example, disrupting atRA signaling by knocking out retinoic acid receptor β severely compromises performance in the Morris water maze test, commonly used to evaluate hippocampus-dependent spatial learning in rodents (15). Impairing atRA signaling impairs long-lasting, activity-dependent changes in synaptic efficacy, including long-term potentiation and long-term depression, viewed as potential cellular learning mechanisms (16). atRA enhances hippocampus neuron function by stimulating dendritic growth (17). atRA also induces neurogenesis of adult neural stem cells in culture and in vivo, and neuronal differentiation of embryonal carcinoma cells (18–21).
A complex metabolic pathway, consisting of multiple steps and enzymes, controls atRA homeostasis (22). Depending on cell needs, all-trans-retinol undergoes storage as retinyl esters (RE), catalyzed primarily by lecithin:retinol acyltransferase (LRAT) (23, 24). Alternatively, dehydrogenation into all-trans-retinal, catalyzed by retinol dehydrogenases (Rdh) that belong to the short-chain dehydrogenase/reductase gene family, initiates atRA biosynthesis (25–29). Dehydrogenation of all-trans-retinal, catalyzed by retinal dehydrogenases (Raldh), which belong to the Aldh gene family, produces atRA (30–33). Catabolism by members of the Cyp gene family balances biosynthesis of atRA (34). These steps function collectively to establish the presence and amount of atRA at specific loci. The two dehydrogenation reactions, and the catabolic reaction are each catalyzed by multiple isozymes. Rdh is physiologically active in generating atRA include Rdh2 (rRodh2, mRdh1), Rdh10, and Dhrs9. Knock-out or inadequate expression of each Rdh produces a phenotype associated with impaired retinoid function, including enhanced adiposity (mRdh1), defects in head and body development (Rdh10), or enhanced tumorigenesis (Dhrs9) (35–37). The three Raldh also have been associated with generating atRA physiologically, through modifying adiposity (Raldh1) or supporting embryonic development (Raldh2 and -3) (38–41).
Astrocytes, the predominant glia cell type in the hippocampus, provide structural, metabolic, and functional support to neurons by secreting factors that induce neurogenesis and formation of synaptic networks (42). atRA has been identified as one of the astrocyte-derived factors that instruct neural stem cell differentiation (7, 43–45). Consistent with supplying atRA to neurons, evidence has been generated indicating that astrocytes biosynthesize atRA, including astrocytes from the rat spinal cord, glial cells in the lateral ganglion eminence, Müller cells, and various brain areas (7, 45–48). Expression of Raldh1 and Raldh2 has been detected in glial cells and astrocytes (48, 49). Expression of Raldh also has been detected in human neural cells and rat superior cervical ganglion neurons; the later also express Rdh. These data suggest that neurons also biosynthesize atRA (50, 51). Other research indicates that the cortex meninges and hypothalamus tanycytes secrete atRA to diffuse throughout nearby brain regions (37, 52). Given the complexity of the brain, the specialized functions of brain regions, and the complexity of retinoid homeostasis, conceivably atRA generation may occur in a region-specific manner.
The goals of this research were to determine sources of atRA in the hippocampus, the nature of the Rdh and Raldh that contribute to atRA generation, and provide insight into pathway regulation. We identify astrocytes as the primary, if not sole source, of hippocampus atRA, and show that Rdh2, Dhrs9, Rdh10, and all three Raldh likely contribute to astrocyte atRA biosynthesis. atRA autoregulates its homeostasis in astrocytes by redirecting retinol metabolism to RE biosynthesis and inducing its catabolism. We also report a novel cross-talk between Dhrs9 and Raldh1, indicating a new mechanism of regulating atRA production. These data reveal a complex path with multiple functional isoenzymes for atRA biosynthesis in the hippocampus.
EXPERIMENTAL PROCEDURES
Cell Culture
Primary cultures of astrocytes were prepared as described with some modifications (53). Briefly, hippocampi without meninges from 2-day-old Sprague-Dawley rats were dissected and resuspended in 2 ml of Hanks' balanced salt solution containing 10 mm HEPES, pH 8.0, and 1,000 units/ml of penicillin-streptomycin. Hippocampi were dissociated by 0.05% trypsin and trituration through a series of Pasteur pipettes with gradually reduced diameters. Astrocytes were plated in DMEM supplemented with 10% FBS in 175-cm2 tissue culture flasks, and incubated in a 37 °C incubator with 5% CO2. The medium was changed after 24 h. Astrocytes formed a confluent layer 14 days after plating. Flasks were sealed and shaken at 300 rpm for 6 h to separate oligodendrocytes and microglia cells. Astrocytes were trypsinized and re-cultured in 6-well plates or 22 × 22-mm glass coverslips at a cell density of 2 × 10⁵ cells/well after an additional 2 weeks in culture.
To prepare the pure neuronal cultures, as described (17), hippocampal neurons were dissected and dissociated from E18 Sprague-Dawley rat hippocampus in the same way as astrocytes, and plated in Neurobasal medium containing 2% B27 supplement (Invitrogen) on plates or glass coverslips precoated with poly-d-lysine (Sigma) at a cell density of 2 × 10⁵ cells/well in 24-well plates or 1 × 10⁶ cells/well in 6-well plates. Half the medium was replenished each week. After a 1-week culture, 2 μm Ara-C (Sigma) was added to prevent glia proliferation. The purities of cultured astrocytes and neurons were confirmed by immunostaining with the astrocyte marker glial fibrillary acidic protein (GFAP), the neuron dendrite marker microtubule-associated protein 2 (MAP2), and the neuronal nuclear antigen NeuN.
Retinoid Metabolism Assays
Primary cultured astrocytes, neurons, or co-cultured astrocytes and neurons were incubated with the indicated concentrations of substrates dissolved in DMSO for the indicated times in DMEM containing 3% FBS. The medium was aspirated and saved, cells were lysed with reporter lysis buffer (Promega). atRA in the medium and lysed cells, and RE and retinol in lysed cells were extracted as described (54, 55). atRA was quantified by LC/MS/MS with atmospheric pressure chemical ionization. Retinol and RE were quantified by HPLC (56). Retinoids were handled under yellow lights using only glass/stainless steel containers, pipettes, and syringes. Background was assessed from control incubations without cells. Results are averages of triplicates, normalized to picomole/million cells/4 h or to control groups and shown as fold-change.
RNA Interference
The small interfering RNAs set (siRNA) of Raldh1 (L-093355), Raldh2 (L-095884), Raldh3 (L-098021), Rdh10 (L-098615), Rdh2 (L-095187), Dhrs9 (L-091764), Cyp26B1 (L-093105), and non-targeting control siRNA (D-001810) were obtained from ON-TARGET plus SMART pool of Dharmacon Research (Lafayette, CO). Each siRNA set was designed to target four different regions of the specific gene. Astrocytes were plated in 6-well plates at a density of 2 × 10⁵/well 1 day before the transfection and transfected with 100 nm siRNA using DharmaFECT siRNA transfection reagent I (Dharmacon) following the manufacturer's protocol. 48 to 96 h post-transfection, the level of target gene knockdown was assayed by RT-PCR or Western blot. atRA was assayed 96 h post-transfection.
RNA Extraction, RT-PCR, and Quantitative RT-PCR Analysis
Total RNA was extracted from astrocytes with TRIzol reagent (Invitrogen) following the manufacturer's protocol. RNA concentration was determined by absorption at 260 nm; the 260/280 nm ratio was >1.9. Semi-quantitative reverse transcription-polymerase chain reaction (RT-PCR) was done using oligo(dT)12–18 as primer and Superscript II reverse transcriptase (Invitrogen) in a 20-μl reaction mixture. The cDNA was diluted and amplified with Taq polymerase at the following conditions: initial denaturing step at 93 °C for 3 min followed by 30–35 cycles of denaturation (93 °C, 30 s), annealing (60 °C, 30 s), and extension (72 °C, 30 s), then further extension at 72 °C for 10 min. Exon-specific primers were (forward and reverse, respectively): Raldh1, 5′-GAAGGGGACAAGGCAGATG-3′, 5′-CCACACACCCCAATAGGTTC-3′; Raldh2, 5′-TTCTTCATTGAGCCTACCGTGTTC-3′, 5′-TCTCTCCCATTTCCAGACATCTTG-3′; Raldh3, 5′-CGATAAGCCCGATGTGGAC-3′, 5′-CTGTGGATGATAGGAGATTGC-3′; Rdh10, 5′-ACCTGTGATGTGGGGAAGAG-3′, 5′-CAAGGTAAGGGCAAACCAAA-3′; Rdh2, 5′-GGACCAGACCAGCTCAGAAG-3′, 5′-CAGGCTTTGGAGAAGTCCAG-3′; Dhrs9, 5′-ATGCTGCTTTGGGTGTTGGCCCTC-3′, 5′-TCACACAGCTTGGGGATTGGCCAG-3′; Cyp26A1, 5′-TTCTGCAGATGAAGCGCAGG-3′, 5′-TTTCGCTGCTTGTGCGAGGA-3′; Cyp26B1, 5′-CAGCTAGTGAGCACGGAGTG-3′, 5′-CGGCAGAGAGAAGACATTCTC-3′; Lrat, 5′-AGGAGGCACAGGGAAGAAA-3′, 5′-CACAAGCAGAACGGGATG-3′; β-actin, 5′-GGCATCCTGACCCTGAAGTAC-3′, 5′-ACCCTCATAGATGGGCACAG-3′. PCR products were electrophoresed in 1.5% agarose gels in the presence of ethidium bromide, visualized by ultraviolet fluorescence, and recorded by a digital camera connected to a computer (ChemiImager 4400, Alpha Innotech). The cDNA of rat β-actin was adopted as an intrinsic standard during RT-PCR.
Pre-designed real time PCR primers for Raldh1 (Rn00755484_m1), Raldsh2 (Rn00588079_m1), Raldh3 (Rn00596232_m1), Rdh2 (Rn01505848_g1), Rdh10 (Rn00710727_m1), and Dhrs9 (Rn00590763_m1) were obtained from Applied Biosystems (Foster City, CA). The 20-μl reaction mixture included 10 μl of TaqMan Universal PCR master mixture, 9 μl of diluted cDNA, and 1 μl of 20× TaqMan Gene Expression Assay Mix. Real time PCR was performed in a 7500 real time PCR system (Applied Biosystems). The thermal cycling program consisted of 2 min at 50 °C, 10 min at 95 °C, followed by 40 cycles of 15 s at 95 °C, and 1 min at 60 °C. Reactions were quantified by selecting the amplification cycle when the PCR product was first detected (threshold cycle, Ct). Each reaction was performed in triplicate and the average Ct values were used in analyses. To account for variability in total RNA input, expression was normalized to β-actin and shown as (target gene/β-actin) × 105.
Western Blot Analysis
Astrocytes were lysed with reporter lysis buffer following the manufacturer's protocol; protein content was normalized using protein assay kits (Bio-Rad). Protein was subjected to SDS-polyacrylamide gel electrophoresis and transferred onto nitrocellulose membrane via standard protocol. The Odyssey Western blotting system (LI-COR Bioscience) was used for quantification. The membrane was incubated in Odyssey blocking buffer (1:1 dilution in PBS) for 1 h and then incubated with rabbit anti-Raldh1 antibody (1:200, Abcam) overnight at 4 °C. After incubation with IRDye infrared secondary antibodies (1:10,000 for IRDye800 goat anti-rabbit; 1:15,000 for IRDye680 goat anti-mouse), the fluorescent signal was visualized and density was measured by the Odyssey Infrared Imaging System. Results are fold-change compared with controls. Values are at least two independent reactions.
Construction of Plasmid and Transfection
To obtain a mammalian expression vector, the full-length open reading frame of rat Dhrs9 (NM_130819) was obtained by PCR amplification from a rat brain cDNA library using forward primer, 5′-CGCGAATTCGCCACCATGCTGCTTTGGGTGTTGGCC-3′, containing an EcoRI site, and reverse primer, 5′-CCGGGATCCCACAGCTTGGGGATTGGCCAG-3′, containing a BamHI site. To obtain a FLAG-tagged Dhrs9(Dhrs9-FLAG), the gel-purified PCR product was ligated into pFLAG-CMV-5.1 (Sigma) vector, which appends the FLAG tag to the C terminus of the protein. The sequence of the expression vector was confirmed by sequencing. COS cell or primary cultured astrocytes were transfected with Dhrs9-FLAG using Lipofectamine 2000 (Invitrogen) for 24 h. Expression of FLAG-tagged Dhrs9 was detected by immunofluorescent staining with anti-FLAG antibody.
Immunofluorescent Staining
Primary cultured neurons and astrocytes or transfected COS cells and astrocytes grown on coverslips were fixed with 4% paraformaldehyde for 15 min, permeabilized with 0.2% Triton X-100 for 5 min, and blocked with PBS containing 10% goat serum or chicken serum for 1 h at room temperature. Cells were incubated with mouse anti-MAP2 (1:500, Millipore), mouse anti-GFAP (1:500, Millipore), mouse monoclonal anti-FLAG M2 (1:500, Sigma), rabbit polyclonal anti-Raldh1 (1:200, Abcam), and goat polyclonal anti-Raldh2 (1:10, Santa Cruz) overnight at 4 °C, washed three times for 5 min each with PBST (1× PBS + 0.25% Tween 20) followed by incubation with goat anti-mouse Alexa 555, goat anti-rabbit Alexa 488, donkey anti-mouse Alexa 555, or chicken anti-goat Alexa 488 secondary antibody (Invitrogen) for 1 h. After washing three times for 5 min each with PBST, coverslips were mounted on slides by Vectashield mounting medium (with DAPI, Vector Laboratories Inc., Burlingame, CA). Images were captured with a LSM 510 Meta UV/visual confocal microscope.
Statistical Analysis
Statistical significance was assessed with two-tailed, unpaired Student's t tests. Data are mean ± S.E.
RESULTS
Retinoids in Adult Rat Hippocampus
We have reported concentrations of atRA in adult mouse hippocampus using a sensitive liquid chromatography-tandem mass spectrometry assay (54, 56). Here we used the method to quantify retinoids in adult rat hippocampus. The atRA concentration was ∼3 ± 0.9 pmol/g of tissue in hippocampus of 2-month-old male Sprague-Dawley rats. Retinol and RE concentrations were ∼56 ± 7.7 and ∼539 ± 62 pmol/g of tissue (n = 8).
Hippocampus Astrocytes Biosynthesize atRA
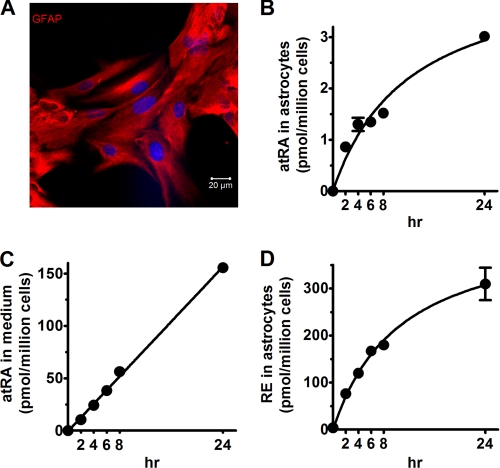
To test directly whether hippocampus astrocytes metabolize retinol, we prepared primary cultures. Astrocyte purity was assessed by assaying for expression of GFAP, an astrocyte marker (57). Immunostaining showed that >98% of the cultured cells were GFAP positive (Fig. 1A). No signals from the neuron marker NeuN were detected in cultured astrocytes (supplemental Fig. S1A).
FIGURE 1.
Time course of atRA and RE biosynthesis from retinol by primary astrocytes. A, astrocyte purity was determined by visualization with GFAP. atRA concentrations were quantified in cells (B) and medium (C), and RE (D) concentrations were quantified in cells after incubation with 2 μm retinol for the times indicated. Error bars, means ± S.E.
Rates of atRA and RE biosynthesis from retinol by primary astrocytes were determined as a function of incubation time. The rates of total atRA produced, measured in medium and cells, increased over 24 h (Fig. 1, B and C). At each time, astrocytes secreted most atRA into the medium, resulting in a linear increase of atRA in the medium, with the proportion remaining in the cells deceasing with incubation time. This linear increase of atRA in the medium indicates a lack of feedback inhibition of synthesis and secretion. RE increases were linear during the first 4 h of incubation, but continued to increase over 24 h (Fig. 1D). Four h incubation was selected as the incubation time in the following experiments to remain in the linear range of rate versus time.
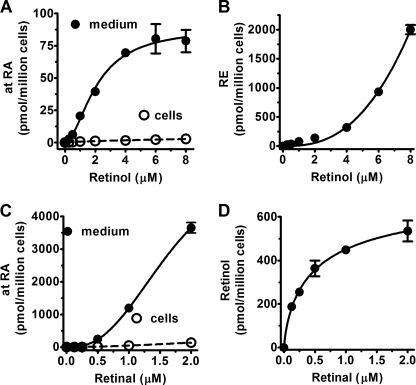
Rates of astrocytes converting retinol into atRA and RE depended on the retinol concentration (Fig. 2, A and B). Once again, astrocytes secreted the majority of the synthesized atRA into their medium, with the proportion reaching ∼96% with retinol concentrations >1 μm. The substrate-rate curve of atRA biosynthesis (total atRA in cells plus medium) had sigmoidal kinetics with an apparent K0.5 of ∼2.1 μm and a Hill coefficient of ∼1.8. In contrast, RE synthesis was not saturated with retinol concentrations as high as 8 μm, and no RE was detected in the medium. RE biosynthesis was much faster than atRA biosynthesis, consistent with the much higher RE than atRA concentrations in serum and tissues. The rate of retinal dehydrogenation into atRA was not saturated at substrate concentrations up to 2 μm (Fig. 2C). In contrast, reduction of retinal into retinol had an apparent K0.5 value of 0.3 μm (Fig. 2D). The rate of retinal reduction into retinol exceeded the rate of dehydrogenation into atRA, at the lower concentrations of retinal normally found in vivo (≤100 nm). This rate of reduction may contribute to the sigmoidal kinetics observed during the production of atRA from retinol, rather than reflecting a cooperative process. In other words, at the lower concentrations of retinol the reduction of newly formed retinal would compete with the dehydrogenation of retinal into atRA, reducing the overall rate of atRA biosynthesis. As the retinal concentrations increases, however, the rate of dehydrogenation would exceed the rate of reduction. Based on these data, we selected 2 μm retinol, 1 μm retinal, and 4 h incubation to monitor atRA biosynthesis in astrocytes, as reflecting the forward reactions for both steps.
FIGURE 2.
Effects of substrate concentrations on retinoid metabolism in primary astrocytes. Primary astrocytes were cultured for 1 month and incubated 4 h with graded concentrations of retinol or retinal. atRA concentrations in the medium (solid line) and cells (dashed line) were quantified by LC/MS/MS: retinol (A) and retinal (C). B, RE biosynthesis from esterification of retinol; and D, retinol biosynthesis from reduction of retinal in cells. Error bars, means ± S.E.
Retinoid Metabolism by Hippocampus Neurons
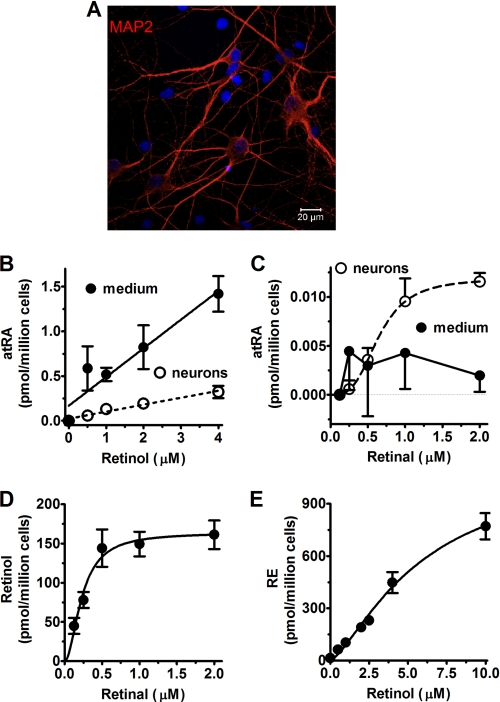
Next, we tested the capacity of neurons to metabolize retinoids. About 95% of the cells in primary cultures of DIV14 neurons expressed the dendritic marker MAP2 (Fig. 3A) or the neuron nuclear marker NeuN (supplemental Fig. S1B). GFAP positive cells contribute no more than 5% to primary neuron cultures (supplemental Fig. S1C). Although atRA was detected in a retinol concentration-dependent manner with the LC/MS assay, the amounts were linear with substrate concentration, and the values were close to the limit of quantification of the assay (Fig. 3B). Therefore, they are not as reliable as the data with astrocytes. Neurons produced even less atRA from retinal, and atRA was at the limit of detection (Fig. 3C). These data do not support the conclusion that neurons generate atRA. In contrast, neurons showed a relatively robust rate of retinal reduction into retinol (Fig. 3D). Retinal reduction by neurons was sigmoidal with an apparent K0.5 of 0.23 μm and a Hill coefficient of 1.9. This likely reflects true reductase activity in neurons, because the values are well within the capability of the HPLC assay used to quantify retinal, and are too high relative to astrocytes to result solely from astrocyte contamination. Neurons generated RE from retinol in a sigmoidal relationship with an apparent K0.5 of 5.9 μm and a Hill coefficient of 1.4 (Fig. 3E). These data indicate that rat hippocampus neurons have fairly robust retinal reductase and retinol acyltransferase activities, but low if any retinol and retinal dehydrogenase activities.
FIGURE 3.
Retinoid metabolism catalyzed by primary hippocampus neurons. A, the purity of neurons (DIV14) was determined by MAP2 visualization. Primary cultured neurons were incubated 4 h with retinol or retinal. atRA accumulation in the medium (solid line) and in cells (dashed line) from retinol (B) or retinal (C) was quantified by LC/MS/MS. D, retinol biosynthesis from retinal, and E, RE production from retinol was quantified by HPLC. Error bars, means ± S.E.
Neurons Sequester atRA Secreted by Astrocytes
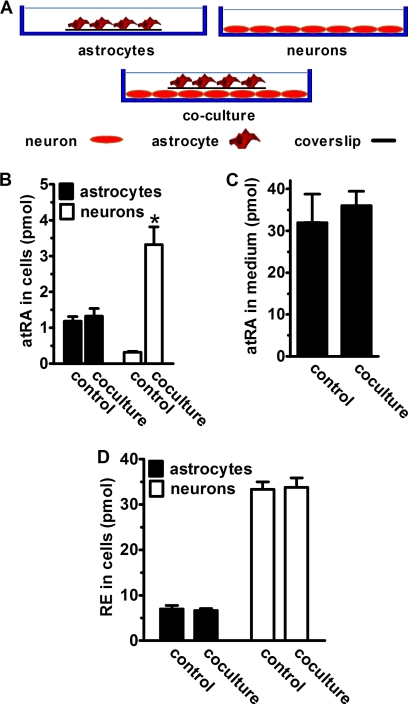
Because hippocampus neurons do not seem to generate atRA, or do so at a relatively low rate, secretion of atRA by astrocytes might serve as a source of atRA for neurons. To test this hypothesis, we co-cultured astrocytes and neurons (Fig. 4A). Primary neurons were cultured on the surfaces of poly-d-lysine-coated plates and astrocytes were cultured on glass coverslips. A third configuration involved placing the coverslips on the tops of neurons with the astrocytes facing up. The coverslips prevented direct cell-cell contact between neurons and astrocytes, and allowed easy separation of the neurons and astrocytes to quantify atRA and RE after incubation with retinol. The coverslips covered about half the surface area of the neurons, which ensured that at least half of the cultured neurons were exposed directly to the medium.
FIGURE 4.
Neurons sequester atRA secreted by astrocytes. A, astrocytes (2 × 10⁵) were cultured on 22 × 22-mm glass coverslips and neurons (6 × 10⁵) were cultured directly in plates. In co-cultures, coverslips were placed on the top of neurons with astrocytes facing up to avoid direct contact between neurons and astrocytes. Cells were incubated 4 h with 2 μm retinol. atRA in the medium was quantified. Neurons and astrocytes in co-cultures were separated and analyzed individually for atRA and RE in the cells. B, intracellular atRA in astrocytes, neurons, and co-cultures of astrocytes and neurons: *, p = 0.0005, n = 3. C, atRA in the medium of astrocyte cultures or co-cultures of astrocytes and neurons. D, intracellular RE in astrocytes, neurons, and co-cultures of astrocytes and neurons. Error bars, means ± S.E.
Individual cultures revealed less atRA in neurons relative to astrocytes, and co-culture did not change the amount of atRA in astrocytes, but increased the amount of atRA in neurons ∼10-fold, relative to neurons cultured in the absence of astrocytes (Fig. 4B). The amount of atRA in the medium did not change significantly, as expected given the disparity between medium and cell atRA concentrations (Fig. 4C). We also quantified RE, because both neurons and astrocytes synthesize, but do not secrete RE. Consistent with the intracellular retention of RE, independent culture versus co-culture made no difference in the intracellular concentrations of RE in neurons or astrocytes (Fig. 4D). These results indicate that neurons can sequester atRA secreted by astrocytes without requiring cell-cell contact.
Raldh Contribute to atRA Production in Astrocytes
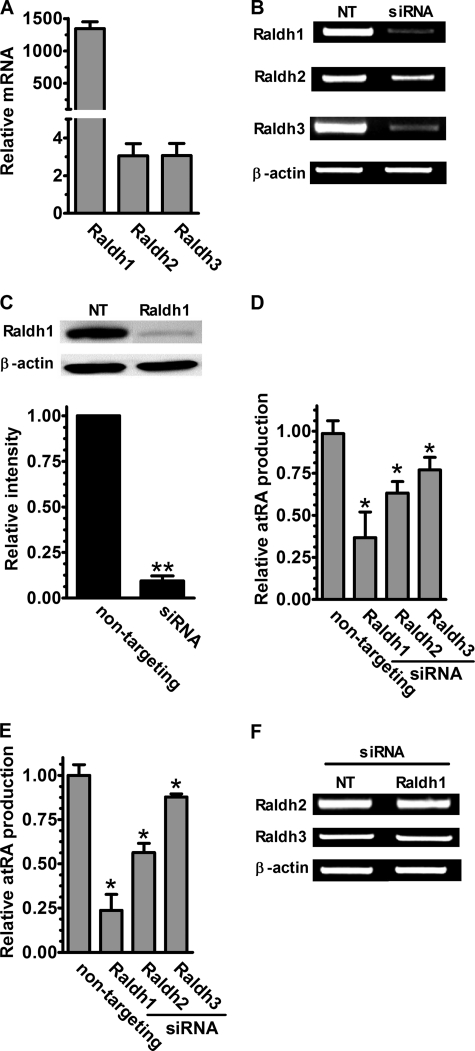
Raldh catalyze the second dehydrogenation step in the pathway of atRA biosynthesis. Q-PCR revealed that astrocytes express three Raldh (Raldh1, -2, and -3) (Fig. 5A). Expression varied greatly, with ∼500-fold higher expression of Raldh1 than Raldh2 or -3. To determine which of these Raldh participate in astrocyte atRA biosynthesis, we used siRNA to sequentially knockdown each mRNA. siRNA transfection reduced Raldh1 and -3 mRNA ∼80%, and Raldh2 mRNA ∼60% after 3 days (Fig. 5B) and reduced Raldh1 protein ∼90% after 4 days (Fig. 5C). Each Raldh knockdown occurred without affecting β-actin expression (mRNA and protein), verifying the specificities of the siRNAs. Astrocytes transfected with Raldh1 siRNA had a 64% reduction in atRA production from retinol and a 77% reduction from retinal (Fig. 5, D and E). Raldh2 knockdown also caused significant reduction of atRA production: ∼37% from retinol and ∼44% reduction from retinal. These results indicate that both Raldh1 and -2 contribute to atRA biosynthesis in hippocampus astrocytes. Although the knockdown of Raldh3 mRNA was as efficient as Raldh1, it caused only ∼24 and ∼13% reduction of atRA production from retinol or retinal, respectively. Notably, no complementary up-regulation of Raldh2 or -3 mRNA was observed during Raldh1 knockdown (Fig. 5F); similar results were observed when Raldh2 or -3 were knocked down (data not shown).
FIGURE 5.
Knockdown reveals Raldh that contribute to atRA biosynthesis. A, Q-PCR analysis of Raldh mRNA expression in primary astrocyte cultures normalized to β-actin mRNA. B, results of transfecting primary astrocytes with non-targeting siRNA or with siRNA targeted to Raldh1, -2, or -3. mRNA was detected by RT-PCR 72 h after transfection. C, Raldh1 was quantified by Western blot 96 h after transfection: ***, p < 0.001; D, atRA biosynthesis from 2 μm retinol after 4 h incubation. E, atRA biosynthesis from 1 μm retinal after 4 h incubation. F, 72 h after Raldh1 siRNA transfection, Raldh2 and -3 mRNA were measured by RT-PCR. D and E, data were normalized to non-targeting siRNA transfected groups: *, p < 0.01; n = 3. Four-h incubations with substrates were done 96 h after transfections. NT, non-targeting. Error bars, means ± S.E.
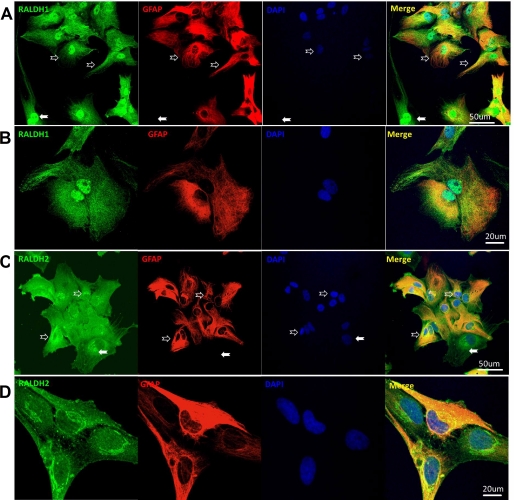
Although Raldh1 and -2 localize to the soluble fraction after differential centrifugation of tissues or after heterologous expression in Escherichia coli, each could occur in different intracellular microenvironments (31, 58, 59). To test this premise, primary astrocytes were immunostained with Raldh1 or -2 antibodies together with the astrocyte marker GFAP. Raldh1 was expressed throughout the cytoplasm (Fig. 6, A and C). In addition, Raldh1 localized strongly to the nuclei of all cultured glia cells. In contrast, Raldh2 expressed most strongly in perinuclear areas relative to the cytoplasm and nuclei (Fig. 6, B and D). All GFAP-positive cells expressed Raldh1 and -2 (Fig. 6, A and C), but GFAP-negative cells (solid arrows) also expressed both, indicating wider expression in glial cells.
FIGURE 6.
Confocal images of Raldh1 and -2 expression. A, primary cultured astrocytes were fixed and stained for Raldh1 (green), GFAP (red), and DAPI (blue). The three channels of each set were merged (merge). B, higher magnification of representative astrocytes with staining as in A. C, astrocytes were fixed and stained for Raldh2 (green), GFAP (red), and DAPI (blue) and the three channels were merged (merged). D, higher magnification of representative astrocytes with staining as in C. Hollow arrows, astrocytes with GFAP expression. Solid arrows, cells without GFAP expression that expressed Raldh1 or -2. No signals were detected in negative controls, which consisted of eliminating primary antibodies (data not shown).
Multiple Rdh Contribute to atRA Biosynthesis in Astrocytes
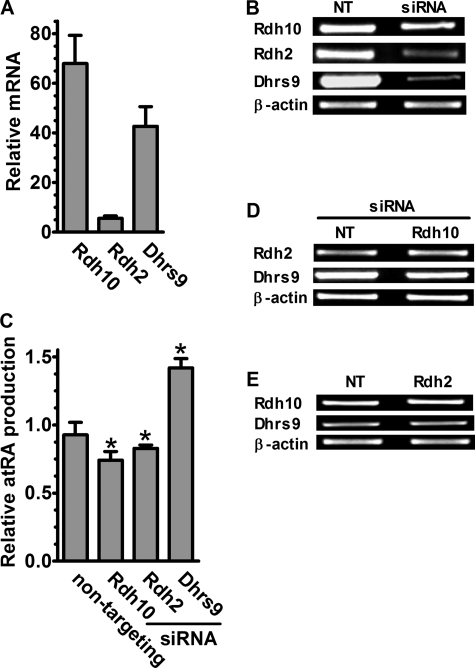
Primary astrocytes express Rdh10 and Dhrs9 much more robustly than Rdh2 (Fig. 7A). We knocked down each using siRNA to evaluate their relative contributions to atRA production. siRNA transfection eliminated ∼50% of Rdh10 and >90% of Rdh2 and Dhrs9 mRNAs without affecting β-actin (Fig. 7B). Knockdown of Rdh10 or Rdh2 caused ∼25 and ∼20% reduction of atRA production from retinol, respectively (Fig. 7C). To exclude one Rdh complementing for the loss of another by increased expression, we assayed the impact of siRNA knockdown on the non-targeted Rdh by RT-PCR. Knockdown of Rdh10 or Rdh2 did not result in marked up-regulation of the non-targeted paralog (Fig. 7, D and E). Knockdown of Dhrs9, surprisingly, caused ∼40% increase of atRA production, indicating its participation in retinoid metabolism in astrocytes, a result seeming inconsistent with its purported function as a retinol dehydrogenase (Fig. 7C).
FIGURE 7.
Multiple Rdh contribute to atRA biosynthesis in astrocytes. A, Q-PCR analysis of Rdh10, Rdh2, and Dhrs9 mRNA expression in astrocytes. B, effects of transfecting astrocytes with non-targeting siRNA or siRNA homologous with Rdh10, Rdh2, and Dhrs9. Rdh mRNA were detected by RT-PCR 72 h after transfection. C, total atRA production from 2 μm retinol in 4 h was quantified 96 h after transfection and was normalized to the non-targeting cultures: *, p < 0.01, n = 4. D, mRNA expression of Rdh2 and Dhrs9 was evaluated by RT-PCR 72 h after Rdh10 siRNA transfection. E, mRNA expression of Rdh10 and Dhrs9 was evaluated by RT-PCR 72 h after Rdh2 siRNA transfection. Error bars, means ± S.E.
Dhrs9 Functions as a Retinol Dehydrogenase
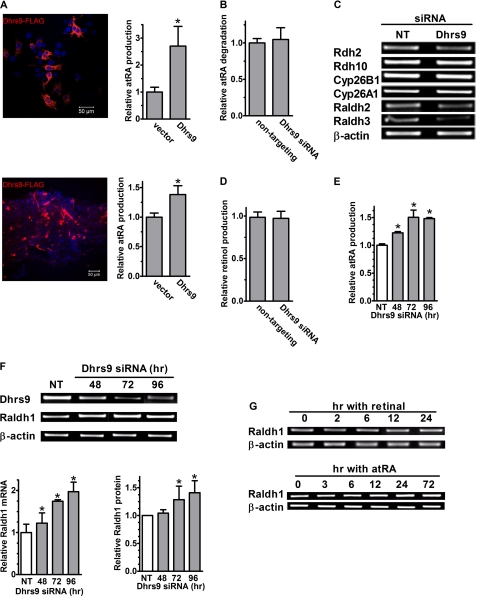
To confirm its function, Dhrs9 was expressed in COS cells and overexpressed in primary astrocytes. We confirmed expression of FLAG-tagged Dhrs9 by immunostaining with an anti-FLAG antibody, and tested the cells for the ability to convert retinol into atRA (Fig. 8A). Expressing Dhrs9 in both COS cells and primary astrocytes increased atRA production from retinol, confirming Dhrs9 function as a dehydrogenase. Next, we tested whether Dhrs9 impacted the rate of atRA catabolism. Knockdown of Dhrs9 in astrocytes did not change the atRA degradation rate (Fig. 8B). Consistent with this result, the mRNA of Cyp26A1 and -26B1, two of the main enzymes that catalyze atRA catabolism, did not decrease with knockdown of Dhrs9 (Fig. 8C). Nor did the mRNA of Rdh10 and Rdh2 increase after Dhrs9 knockdown. These data do not support a decrease in atRA catabolism or an increase in expression of the enzymes in the first dehydrogenation step for the increase in atRA production with knockdown of Dhrs9. To test whether Dhrs9 knockdown enhances dehydrogenation or reduces reduction of retinal, atRA and retinol production from retinal was measured in astrocytes transfected with Dhrs9 siRNA. Knockdown of Dhrs9 did not change the rate of retinal reduction into retinol, confirming that Dhrs9 does not function as a retinal reductase (Fig. 8D). atRA production from retinal, however, increased with time after knockdown up to ∼50% relative to the non-targeting siRNA-transfected cells, indicating an increase in retinal dehydrogenase activity (Fig. 8E). RT-PCR revealed no increase of Raldh2 and -3 mRNA after Dhrs9 knockdown (Fig. 8C), but an increase in Raldh1 mRNA (Fig. 8F, upper panel). Real time PCR confirmed the increase in Raldh1 mRNA with time after Dhrs9 knockdown (Fig. 8F, left lower panel). An increase in protein accompanied the increase in Raldh1 mRNA (Fig. 8F, right lower panel). To determine whether changes in retinal or atRA contribute to the changes in Raldh1 expression, astrocytes were treated with either retinal or atRA, and Raldh1 mRNA was measured by RT-PCR (Fig. 8G). Neither retinal nor atRA caused changes in Raldh1 mRNA expression.
FIGURE 8.
Dhrs9 functions as a retinol dehydrogenase in astrocytes. A, COS cells (top) or primary astrocytes (bottom) were transfected with an empty vector or a vector that expressed FLAG-tagged Dhrs9. Anti-FLAG antibody (red) and nuclei (DAPI, blue) images in cells transfected with the expression vector. Bar graphs show atRA production from 2 μm retinol over 4 h from cells transfected with empty vectors or Dhrs9-expressing vectors: *, p < 0.005, n = 3. B, recovery of atRA was measured in astrocytes transfected with non-targeting or Dhrs9 siRNA and incubated with 4 nm atRA for 6 h. C, mRNA expression was measured by RT-PCR 72 h after transfection with Dhrs9 siRNA. D, retinol production was measured in astrocytes transfected with non-targeting or Dhrs9 siRNA, incubated 4 h with 1 μm retinal. E, atRA production from 1 μm retinal with time after transfection with non-targeting or Dhrs9 siRNA: *, p < 0.0001, n = 3. F, Dhrs9 and Raldh1 mRNAs were detected by RT-PCR (upper panel). Raldh1 mRNA levels were quantified by Q-PCR (left lower panel). Raldh1 protein levels were quantified by Western blot (right lower panel) with time after transfection with Dhrs9 siRNA: *, p < 0.05, n = 3. G, astrocytes were incubated with 1 μm retinal (upper panel) or 1 μm atRA (lower panel). Radlh1 mRNA was measured by RT-PCR. Error bars, means ± S.E.
atRA Autoregulates Its Homeostasis through Cyp26B1 and LRAT
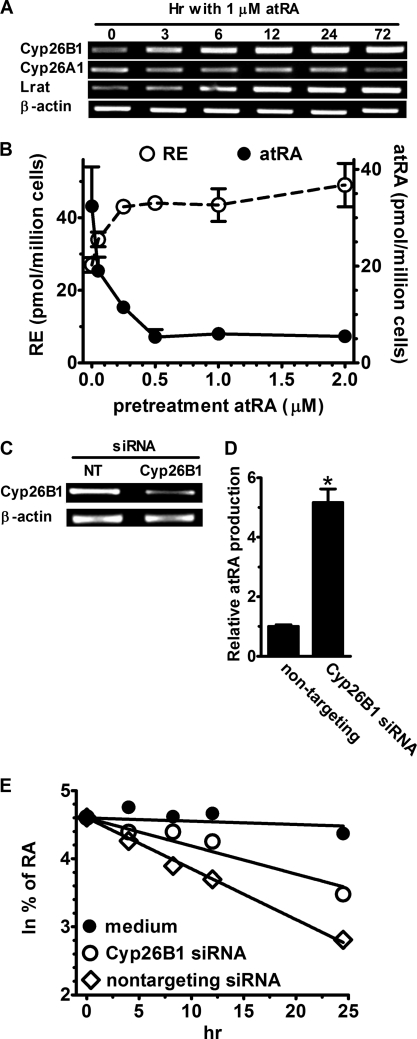
To test the contributions of redirecting retinol metabolism to RE biosynthesis and increasing catabolism on maintaining atRA homeostasis, astrocytes were incubated with 1 μm atRA from 3 h to 3 days. atRA induced Lrat and Cyp26B1 mRNA as early as 6 h after treatment, but did not affect Cyp26A1 mRNA (Fig. 9A). To test whether increases in RE formation and/or decreases in atRA accompany these gene changes, atRA and RE biosyntheses from retinol were measured in astrocytes exposed to graded doses of atRA for 72 h (Fig. 9B). As low as 0.1 μm atRA increased RE formation and decreased atRA accumulation, with 0.3 to 0.5 μm producing maximum effects.
FIGURE 9.
atRA induces Cyp26B1 and Lrat mRNA in astrocytes. A, RT-PCR of Cyp26A1, Cyp26B1, and Lrat mRNAs after incubating primary astrocytes with 1 μm atRA. B, astrocytes were preincubated with graded concentrations of atRA for 72 h. atRA was removed, cells were incubated 4 h with 2 μm retinol, and atRA (solid line) and RE (dashed line) production was quantified. C, astrocytes were transfected with non-targeting or Cyp26B1 siRNA for 72 h and Cyp26B1 mRNA was measured by RT-PCR. D, astrocytes were transfected 96 h with Cyp26B1 siRNA and then incubated 4 h with 2 μm retinol. The amount of atRA produced was normalized to the amount detected in cells transfected with non-targeting siRNA: *, p < 0.0001, n = 3. E, astrocytes were transfected with non-targeting or Cyp26B1 siRNA (96 h) and then incubated with 1 nm atRA. The natural log of the percent atRA remaining was plotted versus incubation time: filled circles, medium without cells; open circles, cells transfected with Cyp26B1 siRNA; open diamonds, cells transfected with non-targeting siRNA. Error bars, means ± S.E.
Because atRA induces Cyp26B1 in astrocytes, we tested whether Cyp26B1 serves as the major catalyst of atRA degradation. Knockdown of Cyp26B1 mRNA by siRNA resulted in a 5-fold increase in atRA recovery after incubating astrocytes with retinol (Fig. 9, C and D). To confirm this insight, the elimination t½ of atRA was measured (Fig. 9E). atRA was relatively stable in medium without cells with a t½ of ∼139 h. Astrocytes transfected with the non-targeting construct catabolized half of the atRA in ∼9 h. Cyp26B1 knockdown increased the t½ of atRA to ∼17 h, confirming a major contribution of Cyp26B1 to atRA catabolism by astrocytes. These data indicate that atRA autoregulates its homeostasis in astrocytes by re-directing retinol use from atRA to RE formation, and by increasing the rate of atRA catabolism.
Rates of Retinol Metabolism Change with Time of Astrocytes in Primary Culture
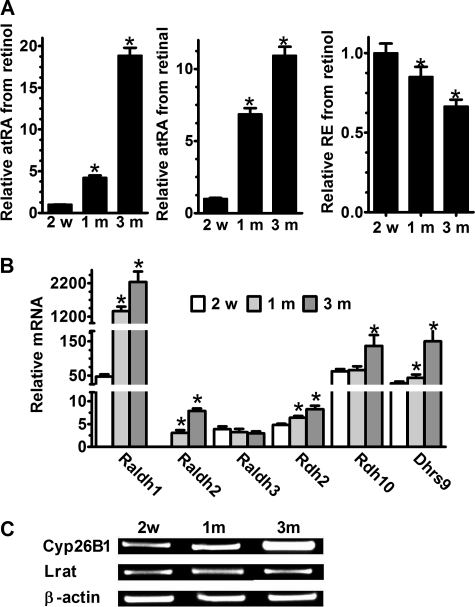
The preceding work was done with primary astrocytes cultured for 1 month. To determine whether length of time in culture alters the ability of astrocytes to metabolize retinol, we compared two additional times in culture to the 1 month cultures: 2 weeks and 3 months (Fig. 10A). Rates of atRA biosynthesis from retinol increased 4-fold after 1 month compared with 2 weeks, and 19-fold after 3 months relative to 2 weeks in culture. Rates of atRA biosynthesis from retinal increased 7-fold after 1 month compared with 2 weeks and 11-fold after 3 months relative to 2 weeks in culture. RE production, in contrast, decreased ∼15% after 1 month of culture relative to 2 weeks, and ∼34% after 3 months of culture relative to 2 weeks. We used Q-PCR to determine gene expression changes that might underlie the changes in metabolic rates. Raldh1 mRNA expression underwent the largest changes with time, with a nearly 30-fold increase from 2 weeks to 1 month in culture. By 3 months, Raldh1 expression increased 47-fold relative to 2 weeks. Increased Raldh1 protein also was observed by Western blot (data not shown). Raldh2 mRNA increased 1000-fold from 2 weeks to 1 month, and 2.6-fold from 1 to 3 months, yet remained far less robustly expressed at all times than Raldh1. Raldh3 did not change markedly with time in culture, and at 1 month was similar in expression to Raldh2, as first observed in Fig. 5A. Rdh2 increased only ∼30% from 2 weeks to 1 month, and ∼70% from 2 weeks to 3 months. Rdh10 mRNA doubled from 2 weeks to 3 months, but did not change from 2 weeks to 1 month. Dhrs9 increased 57% from 2 weeks to 1 month and >5-fold from 2 weeks to 3 months. Cyp26A1 mRNA expression did not change (data not shown), but Cyp26B1 mRNA increased with time in culture (Fig. 10C). No change was detected of Lrat mRNA at 3 months.
FIGURE 10.
Effect of culture duration on retinoid metabolism by primary astrocytes. A, atRA and RE production was quantified from primary astrocytes incubated for 4 h with 2 μm retinol or 1 μm retinal as a function of days in culture: *, p < 0.001 relative to 2 weeks in culture. B, mRNA expression levels of Raldh1, -2, and -3, Rdh2 and -10, and Dhrs9 in primary astrocytes with days in culture were quantified by Q-PCR: *, p < 0.001 relative to 2 weeks in culture. C, Cyp26B1 and Lrat mRNA expression in astrocytes with days in culture were detected by RT-PCR. Error bars, means ± S.E.
DISCUSSION
Hippocampus neurons respond to atRA via retinoic acid receptor α by quickly increasing dendrite outgrowth through a novel mechanism of regulating translation to increase CamKII kinase and GluR1 (12, 17). The source of atRA in the hippocampus had not been established, whether from neurons, astrocytes, or more distance sources (e.g. meninges). Here we applied a sensitive LC/MS/MS assay to specifically quantify atRA biogeneration in astrocytes and neurons. Our results do not support major atRA biosynthesis by hippocampus neurons, suggesting a paracrine source. Astrocytes seemed a likely source. Astrocytes are abundant in the adult CNS, accounting for nearly half of the total cell content of brain (60). Astrocytes occupy a strategic position, interposed between blood vessels and neurons. Astrocyte structures, known as end feet, contact blood vessel walls, enabling capture of retinol from circulation. Astrocytes also extend processes that contact synapses, and regulate synaptic efficacy through modulating uptake and release of neurotransmitters and neurotrophic factors. This cytoarchitecture provides metabolic support for neurons by absorbing glucose from circulation and exporting lactate for neuron use (61–63). Astrocytes or astrocyte-conditioned medium can induce neural fate differentiation of ES cells or adult neural stem cells. atRA, and retinol in the presence of astrocytes, induce neuronal differentiation, but retinol alone cannot induce differentiation (7). Thus, our data considered with these previous reports, support the hypothesis that hippocampus astrocytes absorb retinol from blood vessels and export atRA to neurons to regulate synaptic plasticity. Nevertheless, our data do not exclude the possibility that oligodendrocytes and microglia also synthesize atRA.
Our results show that Rdh2 (mRdh1), Rdh10, and Dhrs9 are all present and active in hippocampus astrocytes. Rdh10 and Dhrs9 were expressed more intensely than Rdh2, yet knockdown of Rdh2 decreased atRA biosynthesis, verifying a contribution. The result with Dhrs9 knockdown also verifies a contribution to retinoid homeostasis, even though its knockdown increased atRA biosynthesis by inducing Raldh1. The knockdowns verify contributions for these Rdh, but do not necessarily reflect relative contribution. Compensatory mechanisms may not be obvious, as illustrated by Dhrs9, or retinol substrate may redirect to an unaffected Rdh. Moreover, these data do not exclude the possibility that additional Rdh participate in retinol dehydrogenation. As for Raldh, astrocytes expressed Raldh1 far more intensely then Raldh2 and -3, but all three catalyzed atRA production in intact cells. These data show that multiple Rdh and Raldh are expressed in and contribute to atRA biosynthesis in astrocytes.
These data stand in contrast to conclusions about sites of atRA biosynthesis in the CNS, and “the essential enzyme” based on localization of one enzyme in one step, as has been attempted for some Raldh, without verifying catalytic activity by quantifying atRA. Such an approach prompts several concerns. Absence of one Rdh or Raldh does not imply absence of the others. On the other hand, the presence of a single enzyme does not define a path: the enzyme may not have access to its substrate and/or it may not function catalytically. Acetylcholine esterase, for example, may have non-classical functions in which it does not hydrolyze acetylcholine, but prompts neurite outgrowth and promotes adhesion during synapse formation (64). Members of the Aldh gene family, including Raldh1, serve as corneal crystallins, which protect the eye from UV damage via both catalytic and non-catalytic mechanisms (65). Thus, it is important to determine loci of multiple enzymes and to verify their function to generate realistic models of atRA homeostasis.
Besides redundancy, other purposes may account for multiple catalytically active Rdh and Raldh in the same cell type. Even though all GFAP positive astrocytes express both Raldh1 and -2, and despite the fact that each isolates with the cytosolic faction upon differential centrifugation, each isolates to distinct subcellular loci when assayed by immunocytochemistry (30, 31). These loci include, but are not restricted to the cytoplasm. The perinuclear locus of Raldh2 and the nuclear locus of Raldh1 imply generation of distinct atRA pools. Distinct isozymes might also provide opportunity for differential regulation. For example, proinflammatory cytokines induce astrocyte Raldh3, but not Raldh1 or 2.3 These insights indicate that the generation of atRA in the astrocyte is far from a simple process, and the complexity involves both steps in generating atRA from retinol.
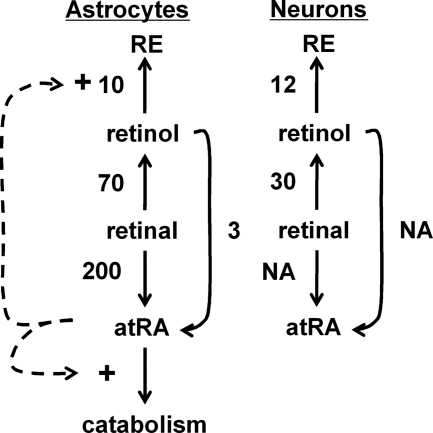
In contrast to differences in atRA biosynthesis, both neurons and astrocytes synthesize RE from retinol and reduce retinal into retinol. In astrocytes, conversion of retinol into RE serves to store retinol for future use and regulate the amount of retinol available to support atRA biosynthesis, whereas neurons may sequester retinol as RE only to prevent atRA biosynthesis. Further insight into the flux of retinol can be deduced by using the kinetic constants (Vm and K0.5 values) to deduce reaction rates at the 60 nm retinol concentration in rat hippocampus (Table 1). Substrate concentrations much lower than apparent K0.5 values, with relatively high Vm values, identify enzymes that react to small increases in substrate with disproportionate increases in reaction rates. Such is the case for the retinoid metabolizing enzymes in astrocytes and neurons, especially so for conversion of retinol into RE. In astrocytes, the rate of RE biosynthesis from retinol exceeds the rate of atRA biosynthesis from retinol (Fig. 11). In the presence of atRA, Lrat induction exacerbates this competition in favor of RE formation, and induction of atRA catabolism further decreases atRA concentrations. These data support a model of atRA controlling its steady-state concentrations by controlling its rate of catabolism and the retinol concentration via LRAT. This model complements previous conclusions that atRA induces Lrat and Cyp26 in liver (2, 66).
TABLE 1.
Rate constants for retinol metabolism, calculated from the data in Figs. 2 and 3
Units are: Vm, pmol/million cells/4 h; K0.5, μm; rate, pmol/million cells/4 h at 60 nm substrate.
| Reaction | Astrocytes (Vm, K0.5, rate) | Neurons (Vm, K0.5, rate) |
|---|---|---|
| Retinol through atRA | 90, 2, 3 | Not applicable |
| Retinal into atRA | 6200, 2, 200 | Not applicable |
| Retinal into retinol | 740, 0.5, 70 | 160, 0.2, 30 |
| Retinol into RE | Very high, 10 | 1200, 6, 12 |
FIGURE 11.
Retinol homeostasis in astrocytes and neurons. The number next to each step designates the rate of the step (pmol/million cells/4 h) at 60 nm substrate, as summarized in Table 1. The dotted lines represent atRA control of Lrat and Cyp26B1 expression. NA, not applicable.
The rate of atRA biosynthesis from retinal exceeds the rate from retinol by a large margin, indicating that conversion of retinol into retinal represents the rate-limiting step (Table 1, Fig. 11). The rate of retinal reduction into retinol also exceeds the rate of retinol dehydrogenation into retinal. This also indicates that the rate of atRA biosynthesis depends on the rate of supplying retinal, i.e. the rates of retinol dehydrogenation and retinal reduction.
Because Dhrs9 had been reported as a retinol dehydrogenase, we were surprised to observe that its knockdown in astrocytes resulted in increased atRA production (28, 67, 68). We excluded the most obvious possibility that Dhrs9 functioned as a reductase, and instead noted that Dhrs9 knockdown causes an increase in Raldh1 expression. This observation confirms function for both Dhrs9 and Raldh1 in astrocyte atRA biosynthesis, and provides the first evidence of communication between the two steps. The mechanism remains unresolved. Neither atRA nor retinal changes atRA production by feedback inhibition, seemingly excluding either as interfering directly with Raldh1 action. It is tempting to speculate that Dhrs9 may regulate Raldh1 expression. Future research will address this possibility. The observation, nevertheless, provides novel insight into regulation of atRA homeostasis.
Neurons and astrocytes increase proliferation and then differentiation during the first month of postnatal CNS development (69, 70). This coincides with the onset of increases in atRA biosynthetic enzymes in primary astrocytes, likely to supply atRA to support rapid postnatal CNS development. The quantitatively largest increase occurred in Raldh1 and seems to account for most, but not all, of the increase in atRA biosynthesis, indicating a primary function for Raldh1 in the adult nervous system.
In summary, our data support multiple Rdh and Raldh constituting a complex metabolic system in astrocytes generating atRA to support neurons. This complexity may reflect redundancy, except overlapping but distinct subcellular expression patterns of Raldh1 and Raldh2 suggests more than redundancy and perhaps generation of distinct atRA pools. Cross-talk between an enzyme in the first step and with an enzyme in the second step provides another layer of complexity of atRA biosynthesis. Age related decreases in relational memory and some neurodegenerative diseases have been related to lower atRA levels in the brain (71, 72). It is probable that impaired expression or regulation of this synthetic and catabolic machinery contribute to the atRA deficit.
Supplementary Material
This work was supported, in whole or in part, by National Institutes of Health Grant DK36870.

The on-line version of this article (available at http://www.jbc.org) contains supplemental Fig. S1.
C. Wang and J. L. Napoli, unpublished data.
- atRA
- all-trans-retinoic acid
- Cyp26A1
- cytochrome P450 26A1
- Cyp26B1
- cytochrome P450 26B1
- Dhrs9
- dehydrogenase/reductase short-chain dehydrogenase/reductase family member 9
- GFAP
- glial fibrillary acidic protein
- LRAT
- lecithin:retinol acyltransferase
- MAP2
- microtubule-associated protein 2
- Raldh
- retinaldehyde dehydrogenase
- RE
- retinyl ester
- Rdh
- retinol dehydrogenase.
REFERENCES
- 1. Napoli J. L. (1999) Biochim. Biophys. Acta 1440, 139–162 [DOI] [PubMed] [Google Scholar]
- 2. Ross A. C., Zolfaghari R. (2004) J. Nutr. 134, 269S–275S [DOI] [PubMed] [Google Scholar]
- 3. Penniston K. L., Tanumihardjo S. A. (2006) Am. J. Clin. Nutr. 83, 191–201 [DOI] [PubMed] [Google Scholar]
- 4. Maden M. (2007) Nat. Rev. Neurosci. 8, 755–765 [DOI] [PubMed] [Google Scholar]
- 5. Mora J. R., Iwata M., von Andrian U. H. (2008) Nat. Rev. Immunol. 8, 685–698 [DOI] [PMC free article] [PubMed] [Google Scholar]
- 6. Cowherd R. M., Lyle R. E., McGehee R. E., Jr. (1999) Semin. Cell Dev. Biol. 10, 3–10 [DOI] [PubMed] [Google Scholar]
- 7. Wuarin L., Sidell N., de Vellis J. (1990) Int. J. Dev. Neurosci. 8, 317–326 [DOI] [PubMed] [Google Scholar]
- 8. Klann R. C., Marchok A. C. (1982) Cell Tissue Kinet. 15, 473–482 [DOI] [PubMed] [Google Scholar]
- 9. Misner D. L., Jacobs S., Shimizu Y., de Urquiza A. M., Solomin L., Perlmann T., De Luca L. M., Stevens C. F., Evans R. M. (2001) Proc. Natl. Acad. Sci. U.S.A. 98, 11714–11719 [DOI] [PMC free article] [PubMed] [Google Scholar]
- 10. Cocco S., Diaz G., Stancampiano R., Diana A., Carta M., Curreli R., Sarais L., Fadda F. (2002) Neuroscience 115, 475–482 [DOI] [PubMed] [Google Scholar]
- 11. Etchamendy N., Enderlin V., Marighetto A., Pallet V., Higueret P., Jaffard R. (2003) Behav. Brain Res. 145, 37–49 [DOI] [PubMed] [Google Scholar]
- 12. Chen N., Onisko B., Napoli J. L. (2008) J. Biol. Chem. 283, 20841–20847 [DOI] [PMC free article] [PubMed] [Google Scholar]
- 13. Mark M., Ghyselinck N. B., Chambon P. (2009) Nucl. Recept. Signal. 7, e002 [DOI] [PMC free article] [PubMed] [Google Scholar]
- 14. Rochette-Egly C., Germain P. (2009) Nucl. Recept. Signal. 7, e005 [DOI] [PMC free article] [PubMed] [Google Scholar]
- 15. Chiang M. Y., Misner D., Kempermann G., Schikorski T., Giguère V., Sucov H. M., Gage F. H., Stevens C. F., Evans R. M. (1998) Neuron 21, 1353–1361 [DOI] [PubMed] [Google Scholar]
- 16. Shapiro M. L., Eichenbaum H. (1999) Hippocampus 9, 365–384 [DOI] [PubMed] [Google Scholar]
- 17. Chen N., Napoli J. L. (2008) FASEB J. 22, 236–245 [DOI] [PubMed] [Google Scholar]
- 18. Takahashi J., Palmer T. D., Gage F. H. (1999) J. Neurobiol. 38, 65–81 [PubMed] [Google Scholar]
- 19. Jones-Villeneuve E. M., Rudnicki M. A., Harris J. F., McBurney M. W. (1983) Mol. Cell. Biol. 3, 2271–2279 [DOI] [PMC free article] [PubMed] [Google Scholar]
- 20. Akita J., Takahashi M., Hojo M., Nishida A., Haruta M., Honda Y. (2002) Brain Res. 954, 286–293 [DOI] [PubMed] [Google Scholar]
- 21. Jacobs S., Lie D. C., DeCicco K. L., Shi Y., DeLuca L. M., Gage F. H., Evans R. M. (2006) Proc. Natl. Acad. Sci. U.S.A. 103, 3902–3907 [DOI] [PMC free article] [PubMed] [Google Scholar]
- 22. Napoli J. L. (2011) in Encyclopedia of Biological Chemistry (Lennarz W. J., Lane M. D. eds) Revised Ed., Elseiver Ltd., in press [Google Scholar]
- 23. Ong D. E., MacDonald P. N., Gubitosi A. M. (1988) J. Biol. Chem. 263, 5789–5796 [PubMed] [Google Scholar]
- 24. Yost R. W., Harrison E. H., Ross A. C. (1988) J. Biol. Chem. 263, 18693–18701 [PubMed] [Google Scholar]
- 25. Chai X., Boerman M. H., Zhai Y., Napoli J. L. (1995) J. Biol. Chem. 270, 3900–3904 [DOI] [PubMed] [Google Scholar]
- 26. Jurukovski V., Markova N. G., Karaman-Jurukovska N., Randolph R. K., Su J., Napoli J. L., Simon M. (1999) Mol. Genet. Metab. 67, 62–73 [DOI] [PubMed] [Google Scholar]
- 27. Zhang M., Chen W., Smith S. M., Napoli J. L. (2001) J. Biol. Chem. 276, 44083–44090 [DOI] [PubMed] [Google Scholar]
- 28. Chetyrkin S. V., Belyaeva O. V., Gough W. H., Kedishvili N. Y. (2001) J. Biol. Chem. 276, 22278–22286 [DOI] [PubMed] [Google Scholar]
- 29. Wu B. X., Chen Y., Fan J., Rohrer B., Crouch R. K., Ma J. X. (2002) Invest. Ophthalmol. Vis. Sci. 43, 3365–3372 [PubMed] [Google Scholar]
- 30. Posch K. C., Burns R. D., Napoli J. L. (1992) J. Biol. Chem. 267, 19676–19682 [PubMed] [Google Scholar]
- 31. Wang X., Penzes P., Napoli J. L. (1996) J. Biol. Chem. 271, 16288–16293 [DOI] [PubMed] [Google Scholar]
- 32. Zhao D., McCaffery P., Ivins K. J., Neve R. L., Hogan P., Chin W. W., Dräger U. C. (1996) Eur. J. Biochem. 240, 15–22 [DOI] [PubMed] [Google Scholar]
- 33. Grün F., Hirose Y., Kawauchi S., Ogura T., Umesono K. (2000) J. Biol. Chem. 275, 41210–41218 [DOI] [PubMed] [Google Scholar]
- 34. Thatcher J. E., Isoherranen N. (2009) Expert Opin. Drug Metab. Toxicol. 5, 875–886 [DOI] [PMC free article] [PubMed] [Google Scholar]
- 35. Jette C., Peterson P. W., Sandoval I. T., Manos E. J., Hadley E., Ireland C. M., Jones D. A. (2004) J. Biol. Chem. 279, 34397–34405 [DOI] [PubMed] [Google Scholar]
- 36. Zhang M., Hu P., Krois C. R., Kane M. A., Napoli J. L. (2007) FASEB J. 21, 2886–2896 [DOI] [PubMed] [Google Scholar]
- 37. Siegenthaler J. A., Ashique A. M., Zarbalis K., Patterson K. P., Hecht J. H., Kane M. A., Folias A. E., Choe Y., May S. R., Kume T., Napoli J. L., Peterson A. S., Pleasure S. J. (2009) Cell 139, 597–609 [DOI] [PMC free article] [PubMed] [Google Scholar]
- 38. Niederreither K., Subbarayan V., Dollé P., Chambon P. (1999) Nat. Genet. 21, 444–448 [DOI] [PubMed] [Google Scholar]
- 39. Dupé V., Matt N., Garnier J. M., Chambon P., Mark M., Ghyselinck N. B. (2003) Proc. Natl. Acad. Sci. U.S.A. 100, 14036–14041 [DOI] [PMC free article] [PubMed] [Google Scholar]
- 40. Halilagic A., Ribes V., Ghyselinck N. B., Zile M. H., Dollé P., Studer M. (2007) Dev. Biol. 303, 362–375 [DOI] [PubMed] [Google Scholar]
- 41. Ziouzenkova O., Orasanu G., Sharlach M., Akiyama T. E., Berger J. P., Viereck J., Hamilton J. A., Tang G., Dolnikowski G. G., Vogel S., Duester G., Plutzky J. (2007) Nat. Med. 13, 695–702 [DOI] [PMC free article] [PubMed] [Google Scholar]
- 42. Markiewicz I., Lukomska B. (2006) Acta Neurobiol. Exp. 66, 343–358 [DOI] [PubMed] [Google Scholar]
- 43. Nakayama T., Momoki-Soga T., Inoue N. (2003) Neurosci. Res. 46, 241–249 [DOI] [PubMed] [Google Scholar]
- 44. Song H., Stevens C. F., Gage F. H. (2002) Nature 417, 39–44 [DOI] [PubMed] [Google Scholar]
- 45. Környei Z., Gócza E., Rühl R., Orsolits B., Vörös E., Szabó B., Vágovits B., Madarász E. (2007) FASEB J. 21, 2496–2509 [DOI] [PubMed] [Google Scholar]
- 46. Edwards R. B., Adler A. J., Dev S., Claycomb R. C. (1992) Exp. Eye Res. 54, 481–490 [DOI] [PubMed] [Google Scholar]
- 47. Toresson H., Mata de Urquiza A., Fagerström C., Perlmann T., Campbell K. (1999) Development 126, 1317–1326 [DOI] [PubMed] [Google Scholar]
- 48. McCaffery P., Koul O., Smith D., Napoli J. L., Chen N., Ullman M. D. (2004) Brain Res. Dev. Brain Res. 153, 233–241 [DOI] [PubMed] [Google Scholar]
- 49. Asson-Batres M. A., Smith W. B. (2006) J. Comp. Neurol. 496, 149–171 [DOI] [PMC free article] [PubMed] [Google Scholar]
- 50. Connor M. J., Sidell N. (1997) Mol. Chem. Neuropathol. 30, 239–252 [DOI] [PubMed] [Google Scholar]
- 51. Chandrasekaran V., Zhai Y., Wagner M., Kaplan P. L., Napoli J. L., Higgins D. (2000) J. Neurobiol. 42, 383–393 [PubMed] [Google Scholar]
- 52. Shearer K. D., Goodman T. H., Ross A. W., Reilly L., Morgan P. J., McCaffery P. J. (2010) J. Neurochem. 112, 246–257 [DOI] [PubMed] [Google Scholar]
- 53. Yang Y., Ge W., Chen Y., Zhang Z., Shen W., Wu C., Poo M., Duan S. (2003) Proc. Natl. Acad. Sci. U.S.A. 100, 15194–15199 [DOI] [PMC free article] [PubMed] [Google Scholar]
- 54. Kane M. A., Folias A. E., Wang C., Napoli J. L. (2008) Anal. Chem. 80, 1702–1708 [DOI] [PMC free article] [PubMed] [Google Scholar]
- 55. Kane M. A., Folias A. E., Wang C., Napoli J. L. (2010) FASEB J. 24, 823–832 [DOI] [PMC free article] [PubMed] [Google Scholar]
- 56. Kane M. A., Chen N., Sparks S., Napoli J. L. (2005) Biochem. J. 388, 363–369 [DOI] [PMC free article] [PubMed] [Google Scholar]
- 57. Rodnight R., Gonçalves C. A., Wofchuk S. T., Leal R. (1997) Braz. J. Med. Biol. Res. 30, 325–338 [DOI] [PubMed] [Google Scholar]
- 58. Brodeur H., Gagnon I., Mader S., Bhat P. V. (2003) J. Lipid Res. 44, 303–313 [DOI] [PubMed] [Google Scholar]
- 59. Labrecque J., Bhat P. V., Lacroix A. (1993) Biochem. Cell Biol. 71, 85–89 [DOI] [PubMed] [Google Scholar]
- 60. Laird M. D., Vender J. R., Dhandapani K. M. (2008) Neurosignals 16, 154–164 [DOI] [PubMed] [Google Scholar]
- 61. Alliot F., Delhaye-Bouchaud N., Geffard M., Pessac B. (1988) Brain Res. Dev. Brain Res. 44, 247–257 [DOI] [PubMed] [Google Scholar]
- 62. Banker G. A. (1980) Science 209, 809–810 [DOI] [PubMed] [Google Scholar]
- 63. Unsicker K., Reichert-Preibsch H., Schmidt R., Pettmann B., Labourdette G., Sensenbrenner M. (1987) Proc. Natl. Acad. Sci. U.S.A. 84, 5459–5463 [DOI] [PMC free article] [PubMed] [Google Scholar]
- 64. Silman I., Sussman J. L. (2005) Curr. Opin. Pharmacol. 5, 293–302 [DOI] [PubMed] [Google Scholar]
- 65. Cooper D. L., Isola N. R., Stevenson K., Baptist E. W. (1993) Adv. Exp. Med. Biol. 328, 169–179 [DOI] [PubMed] [Google Scholar]
- 66. Ross A. C. (2003) J. Nutr. 133, 291S–296S [DOI] [PubMed] [Google Scholar]
- 67. Rexer B. N., Ong D. E. (2002) Biol. Reprod. 67, 1555–1564 [DOI] [PubMed] [Google Scholar]
- 68. Soref C. M., Di Y. P., Hayden L., Zhao Y. H., Satre M. A., Wu R. (2001) J. Biol. Chem. 276, 24194–24202 [DOI] [PubMed] [Google Scholar]
- 69. Levison S. W., de Vellis J., Goldman J. E. (2005) Developmental Neurobiology (Rao M. S., Jacobsen M. eds) 4th Ed., Chapter 7, Kluwer Academic/Plenum Publishers, New York [Google Scholar]
- 70. Vaccarino F. M., Fagel D. M., Ganat Y., Maragnoli M. E., Ment L. R., Ohkubo Y., Schwartz M. L., Silbereis J., Smith K. M. (2007) Neuroscientist 13, 173–185 [DOI] [PubMed] [Google Scholar]
- 71. Etchamendy N., Enderlin V., Marighetto A., Vouimba R. M., Pallet V., Jaffard R., Higueret P. (2001) J. Neurosci. 21, 6423–6429 [DOI] [PMC free article] [PubMed] [Google Scholar]
- 72. Shudo K., Fukasawa H., Nakagomi M., Yamagata N. (2009) Curr. Alzheimer Res. 6, 302–311 [DOI] [PMC free article] [PubMed] [Google Scholar]
Associated Data
This section collects any data citations, data availability statements, or supplementary materials included in this article.


