Abstract
Oxidative damage has been reported in Rett syndrome (RTT), a pervasive developmental disorder caused in up to 95% of cases by mutations in the X-linked methyl-CpG binding protein 2 gene. Herein, we have synthesized F2-dihomo-isoprostanes (F2-dihomo-IsoPs), peroxidation products from adrenic acid (22:4 n-6), a known component of myelin, and tested the potential value of F2-dihomo-IsoPs as a novel disease marker and its relationship with clinical presentation and disease progression. F2-dihomo-IsoPs were determined by gas chromatography/negative-ion chemical ionization tandem mass spectrometry. Newly synthesized F2-dihomo-IsoP isomers [ent-7(RS)-F2t-dihomo-IsoP and 17-F2t-dihomo-IsoP] were used as reference standards. The measured ions were the product ions at m/z 327 derived from the [M–181]− precursor ions (m/z 597) produced from both the derivatized ent-7(RS)-F2t-dihomo-IsoP and 17-F2t-dihomo-IsoP. Average plasma F2-dihomo-IsoP levels in RTT were about one order of magnitude higher than those in healthy controls, being higher in typical RTT as compared with RTT variants, with a remarkable increase of about two orders of magnitude in patients at the earliest stage of the disease followed by a steady decrease during the natural clinical progression. hese data indicate for the first time that quantification of F2-dihomo-IsoPs in plasma represents an early marker of the disease and may provide a better understanding of the pathogenic mechanisms behind the neurological regression in patients with RTT
Keywords: methyl-CpG binding protein 2, adrenic acid, myelin damage, autism spectrum disorders
Oxidative stress (OS) is involved in the pathogenesis of Rett syndrome (RTT) (1), a severe neurological disease affecting about one female newborn in 10,000 and caused in up to 95% by sporadic loss-of-function mutations in the X-linked methyl-CpG binding protein 2 (MeCP2) gene, and for which no definitive cure exists to date.
Affected girls develop complex neurological symptoms with age, and the classical form of the disease (about 76% of all forms) is didactically subdivided into stages from I to IV. Cumulating evidence strongly indicates that RTT is a multisystemic disease not confined to the central nervous system but also affecting muscles (2), bone (3), lung (4), and heart (5). The neurobiological changes in the RTT brain are likely to be complex, and there is increasing evidence that MeCP2 is an important regulator of neuronal plasticity and that synaptopathy is a major component of the Rett phenotype, with recent data supporting the concept that progressive functional synaptic impairment is a key feature in the RTT brain (6). Anatomical studies have shown changes in synaptic connectivity and neuronal structure (7–11), whereas at the network level, there are changes in network excitability (12, 13). Although lack of functional MeCP2 results in a nervous system primed to malfunction at a critical point during postnatal brain development, functions can be restored to a large degree once MeCP2 expression is restored to wild-type levels, raising expectations about the possibility of therapeutic intervention (14).
To date, little is known regarding brain white matter damage in RTT, although a recent neuro-imaging study indicates the importance of a white matter abnormality related to more-severe language compromise. However, in the lack of histological data, it is difficult to reach conclusions about the exact mechanism of the fractional anisotropy decrease observed in this patient population. Past studies have suggested axonal involvement to explain fractional anisotropy reduction, but loss of myelin has not been shown to be a contributing factor (15).
We have previously demonstrated chronic hypoxia and/or enhanced OS in patients with typical RTT (linked to MeCP2 gene mutations) (16), as well as in those with the early-seizure variant (ESV), linked to cyclin-dependent kinase-like 5 (CDKL5) gene mutations).
In the present study, we have examined the potential value of F2-dihomo--isoprostanes (F2-dihomo--IsoPs), oxidation products deriving from radical attack on adrenic acid (AdA) 22:4 n-6, a specific component of myelin, but also present in several organs and tissues, including the kidney and the adrenal glands (17–19), as an early marker of lipid peroxidation in RTT, by using the synthesis (20) of two series of AdA peroxidation products.
PATIENTS AND METHODS
Subjects
The study included a total of 91 female RTT patients with different clinical diagnoses: typical RTT (n = 70; mean age, 11.9 ± 8.0 years; range, 1.0–33; demonstrated MeCP2 mutation), preserved-speech variant (PSV) (n = 11; mean age, 18.5 ± 6.1 years; range, 10–30; demonstrated MeCP2 mutation), and ESV (n = 10; mean age, 9.0 ± 3.5 years; range, 5–13; demonstrated CDKL5 mutation). RTT diagnoses and inclusion/exclusion criteria were based on the recently revised RTT (21).
All patients were admitted to the Rett Syndrome National Reference Centre of the University Hospital of the Azienda Ospedaliera Universitaria Senese. The subjects examined in this study followed a typical Mediterranean diet. The study was restricted to assessment of cases with the nine most frequently reported MeCP2 mutations (22, 23) plus large gene deletions.
Gender-matched healthy control subjects of comparable age (n = 43, all females; age, 13.9 ± 6.0 years; range 1.5–32) were also included. Blood samplings in the control group were carried out during routine health checks or sports checkups, or through blood donations.
The study was conducted with the approval of the Institutional Review Board, and written, informed consents were obtained from either the parents or the legal tutors of the enrolled patients or directly from healthy adults.
Disease stage in typical RTT
Among typical RTT patients, 10 were on stage I (mean age, 1.8 ± 0.6 years; range, 1.2–2.5), 15 on stage II (mean age, 5.7 ± 1.0 years; range, 3.5–8), 20 on stage III (mean age, 12.5 ± 7.2 years; range, 4.5–32), and 25 on stage IV (mean age, 16.3 ± 6.4 years; range, 9–32). Disease stages were evaluated according to Hagberg (24).
Phenotype severity scoring
RTT clinical severity was assessed using the clinical severity score, a validated clinical rating specifically designed for RTT (25), based on 13 individual, ordinal categories measuring clinical features common in RTT. All scores range from 0 to 4 or 0 to 5, with 0 representing the least-severe and 4 or 5 representing the most-severe finding. A series of individual clinical items of interest were also evaluated to compress the ordinal category measures into a binary measurement, with 0 representing “mild” or “retained function” and 1 representing “severe” or “lost/absent function” (25). Mild or retained functions were considered in the case of neurologic regression after 18 months of life, weight decrease <2SD, head circumference greater than the 10th percentile after 24 months of life, sitting maintained, independent walking, hands use at least partially conserved, scoliosis <20°, use of at least single words, maintained eye contact for at least 5 s, presence of minimal respiratory dysfunction (<10% of the time), stereotypy onset after 36 months of life, and seizures absent or less than monthly (26).
Blood sampling
Blood was collected in heparinized tubes, and all manipulations were carried out within 2 h after collection. Blood samples were centrifuged at 2,400 g for 15 min at room temperature. The platelet-poor plasma was saved, and the buffy coat was removed by aspiration. Butylated hydroxytoluene (90 μM) was added to plasma as an antioxidant, and the samples were stored under nitrogen at −70°C until analysis.
F2-dihomo-IsoP syntheses
We have recently developed a new general strategy to rapidly access F-, E-, and D-IsoPs using a common keto-epoxide[3.3.0]octene intermediate 1 (20, 27). Using this precursor, we now report the synthesis of ent-7(RS)-F2t-dihomo-IsoP, and 17-F2t-dihomo-IsoP ( Scheme 1 ).
scheme 1.
The mono-acetate intermediate 4 was obtained in five steps from the keto-epoxide 1 on multigram scale, after successive reductions, protection, and enzymatic regioselective mono-acetylation ( Scheme 2 ) (20, 27).
scheme 2.
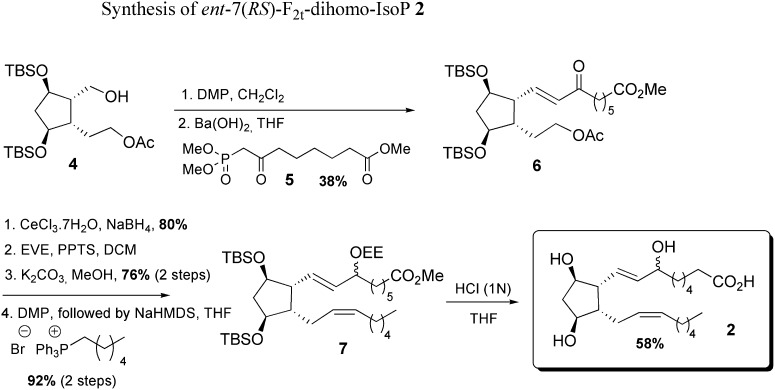
Synthesis of ent-7(RS)-F2t-dihomo-IsoP 2 from mono-acetate 4
Starting from the mono-acetate 4, the introduction of the α chain was performed by a Horner-Wadsworth-Emmons (HWE) reaction with the methyl 8-(dimethyloxyphosphoryl)-7-oxooctanoate 5 obtained by condensation between dimethyl methyl phosphonate anion and dimethyl pimelate. The reduction of the α,β unsaturated ketone 6, protection of the allylic hydroxyl group with ethoxyethyl vinyl ether, followed by successive deprotection of the acetate function in basic conditions, oxidation in mild conditions, and final Wittig reaction using commercial hexylphosphonium bromide led to the formation of the ω chain of 7. The ent-7(RS)-F2t-dihomo-IsoP 2 was obtained after a final one-pot-silylated ether deprotection and methyl ester hydrolysis in the presence of 1 N HCl ( Scheme 3 ).
scheme 3.
Synthesis of 17-F2t-dihomo-IsoP 3 from mono-acetate 4
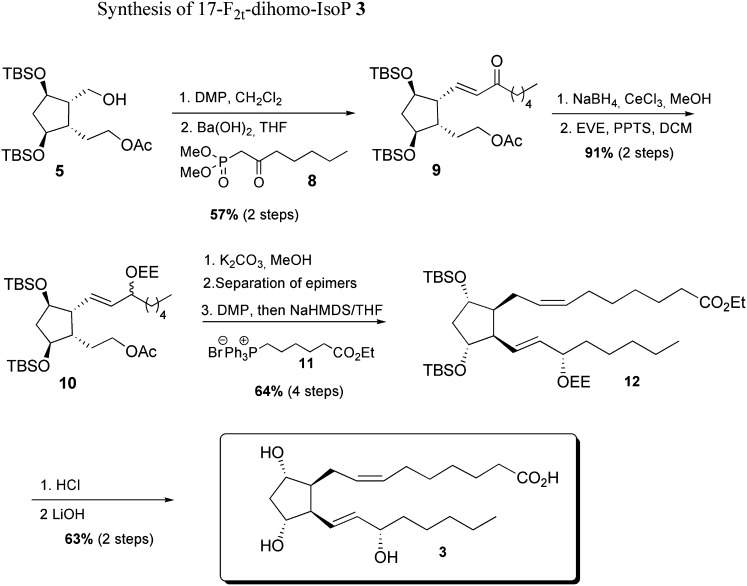
As with the ent-7(RS)-F2t-dihomo-IsoP synthesis, this metabolite was obtained starting from mono-acetate 4 in nine steps, using commercially available dimethyl-2-oxo-heptylphosphonate 8 and (7-ethoxy-7-oxoheptyl)triphenyl phosphonium bromide 11, prepared in one step, and 93% yield from ethyl 7-bromo heptanoate.
As described in Scheme 4 , the enone 9 was obtained with 57% yield after Dess-Martin oxidation of alcohol 5 and HWE olefination with the β-keto phosphonate 8 and barium hydroxide. Enone 9 reduction was realized under Luche conditions, and the corresponding 1:1 epimer mixture was subsequently protected as ethoxy ether 10 with 91% yield over two steps.
scheme 4.
The lower chain was introduced after saponification of the acetate group, followed by oxidation, separation of the two epimers at C17, then a Wittig elongation using the previously synthesized phosphonium salt 11, NaHMDS in THF, in 64% yield after four steps. Final acid cleavage of silylated ether 12, followed by ethyl ester saponification, allowed the access to 17-F2t-dihomo-IsoP 3 with 63% yield after two steps.
Structural determination using one-dimensional 1H- and 13C-NMR spectra
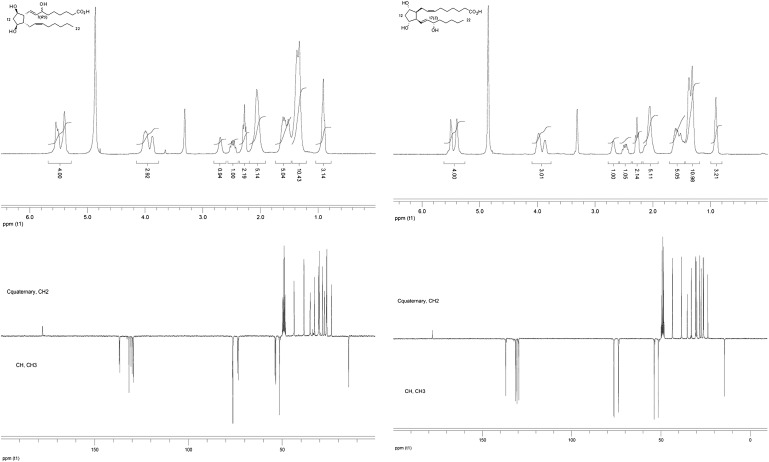
Characterization of the ent-7(RS)-F2t-dihomo-IsoP 2 and the 17-F2t-dihomo-IsoP 3 was realized using 300 MHz one-dimensional 1H- and 13C-NMR, in CD3OD, at room temperature ( Fig. 1 , Table 1 ).
Fig. 1.
One-dimensional 1H- and 13C-NMR of the ent-7(RS)-F2t-dihomo-IsoP 2 and the 17-F2t-dihomo-IsoP 3.
TABLE 1.
One-dimensional 1H- and 13C-NMR analysis of ent-7(RS)-F2t-dihomo-IsoP 2 and the 17-F2t-dihomo-IsoP 3
| Carbon | Ent-7(RS)-F2t-dihomo-IsoP 2 |
17(S)-F2t-dihomo-IsoP 3 |
||
| δ1H (ppm) | δ13C (ppm) | δ1H (ppm) | δ13C (ppm) | |
| 1 | — | 177.8 | — | 178.0 |
| 2 | 1.90–2.20 | 26.2–35.1 | 1.90–2.20 | 26.1–35.2 |
| 3 | 1.20–1.70 | 26.2–35.1 | 1.20–1.70 | 26.1–35.2 |
| 4 | 1.20–1.70 | 26.2–35.1 | 1.20–1.70 | 26.1–35.2 |
| 5 | 1.20–1.70 | 26.2–35.1 | 1.20–1.70 | 26.1–35.2 |
| 6 | 1.20–1.70 | 26.2–35.1 | 1.20–1.70 | 26.1–35.2 |
| 7 | 3.80–4.15 | 76.2–76.4 | 3.80–4.10 | 76.4 |
| 8 | 5.30–5.70 | 136.6–136.8 | 5.25–5.60 | 136.9 |
| 9 | 5.30–5.70 | 129.4–129.9 | 5.25–5.60 | 129.6 |
| 10 | 2.60–2.80 | 53.4–53.8 | 2.60–2.70 | 53.9 |
| 11 | 3.80–4.15 | 73.7 | 3.80–4.10 | 76.3 |
| 12 | 2.20–2. 35 | 43.6–43.7 | 2.20–2. 40 | 43.6 |
| 13 | 3.80–4.15 | 73.3 | 3.80–4.10 | 73.8 |
| 14 | 2.40–2.60 | 51.5 | 2.40–2.60 | 51.5 |
| 15 | 1.90–2.20 | 38.4 | 1.90–2.20 | 38.5 |
| 16 | 5.30–5.70 | 131.7 | 5.25–5.60 | 131.4 |
| 17 | 5.30–5.70 | 130.6 | 5.25–5.60 | 130.6 |
| 18 | 1.20–1.70 | 26.2–35.1 | 1.20–1.70 | 26.1–35.2 |
| 19 | 1.20–1.70 | 26.2–35.1 | 1.20–1.70 | 26.1–35.2 |
| 20 | 1.20–1.70 | 26.2–35.1 | 1.20–1.70 | 26.1–35.2 |
| 21 | 1.20–1.70 | 23.7 | 1.20–1.70 | 23.8 |
| 22 | 0.80–1.00 | 14.5 | 0.80–1.00 | 14.5 |
Plasma F2-dihomo-IsoPs determinations
Plasma F2-dihomo-IsoPs were determined by a gas chromatography/negative-ion chemical ionization tandem mass spectrometry (GC/NICI-MS/MS) analysis after solid-phase extraction and derivatization steps.
Plasma (1 ml) was spiked with tetradeuterated prostaglandin F2α (500 pg in 50 µl ethanol) as an internal standard. To each sample were added 2 ml of acidified water (pH 3). After an equilibration time of 15 min at 4°C, the extraction and purification procedure of the sample (1 ml plasma plus 2 ml H2O, pH 3) was carried out. It consisted of two solid-phase separation steps. Each sample was loaded on an octadecylsilane (C18) cartridge (Sep-Pak® Vac C18, 500 mg). After washing sequentially with 10 ml water (pH 3) and acetonitrile-water (15:85), F2-dihomo-IsoPs were eluted with 5 ml hexane-ethyl acetate-propan-2-ol (30: 65:5). This eluate was then applied to an aminopropyl (NH2) cartridge (Sep-Pak®Vac NH2, 500 mg). The cartridge was sequentially washed with 10 ml hexane-ethyl acetate (30:70), acetonitrile-water (90:10), and acetonitrile. F2-dihomo-IsoPs were then eluted with 5 ml methanol-acetic acid-ethyl acetate (85:5:10). F2-dihomo-IsoPs collected in the final eluate from the NH2 cartridge were derivatized; the carboxylic group was derivatized as the pentafluorobenzyl ester, and the hydroxyl groups were converted to trimethylsilyl ethers. The pentafluorobenzyl esters were prepared by adding 40 μl pentafluorobenzyl bromide (10% in acetonitrile) and 20 µl diisopropylethylamine (DIPEA) (10% in acetronitrile) to the purified dried samples. After a reaction time of 45 min at 40°C, the solvent was removed and the trimethylsilyl ethers were prepared by adding 50 µl N,O-bis(trimethylsilyl)trifluoroacetamide (BSTFA) and 5 µl DIPEA (10% in acetonitrile). The samples were kept at 45°C for 1 h. The solvent was then removed, and the samples were reconstituted in 50 µl of undecane containing 10% BSTFA. The derivatized samples were introduced into the gas chromatograph (Trace GC, ThermoFinnigan; San Jose, CA) in the splitless mode (splitless time 2 min). Sample aliquots of (2 µl) were injected. The gas chromatograph oven was programmed from 175°C (3 min) to 270°C at a rate of 30°C/min. The temperature of the injector was 250°C; the transfer line was heated to 280°C and the ion source to 200°C. The carrier gas was ultrapure helium maintained at a constant flow of 1 ml/min. The GC column enters the ion source of the mass spectrometer. An ion trap was used as mass analyzer (PolarisQ; ThermoFinnigan). Methane was used as reagent gas for NICI at a flow rate of 2.0 ml/min. The precursor ion isolation width was 1.5 Da, the multiplier was set to 1550 V, and the automatic gain control was used.
To rule out a potential generation of F2-dihomo-IsoPs by artifactual oxidation of plasma, samples from three RTT patients (stage IV of the disease) were incubated at 37°C for 1 h with 10 mM-2, 2′ azobis (2-aminopropane) hydrochloride (AAPH), a well-known, commonly used free radical initiator (28, 29)
Data analysis
All variables were tested for normal distribution (D'Agostino-Pearson test), and data were presented as means with 95% confidence intervals (95% CI) for normally distributed variables or medians/means with 95% CI for nonnormally distributed data. Differences between groups were evaluated using independent-sample t-test (continuous normally distributed data), Mann-Whitney rank sum test (continuous nonnormally distributed data), χ2 statistics (categorical variables with minimum number of cases per cell >5) of Fisher's exact test (categorical variables with minimum number of cases per cell <5), one-way ANOVA, Student-Newman-Keuls posthoc test, or Kruskal-Wallis test. Associations between variables were tested by univariate regression analysis, whereas unadjusted odds ratios were determined by univariate logistic regression. The efficiency of plasma F2-dihomo-IsoPs in discriminating RTT patients from healthy controls was evaluated using a receiver operating characteristic curve analysis. Two-tailed P values <0.05 were considered significant if not otherwise specified. Correction for multiple comparisons was made (Bonferroni's correction). The MedCalc version 9.5.2.0 statistical software package (MedCalc Software; Mariakerke, Belgium) was used.
RESULTS
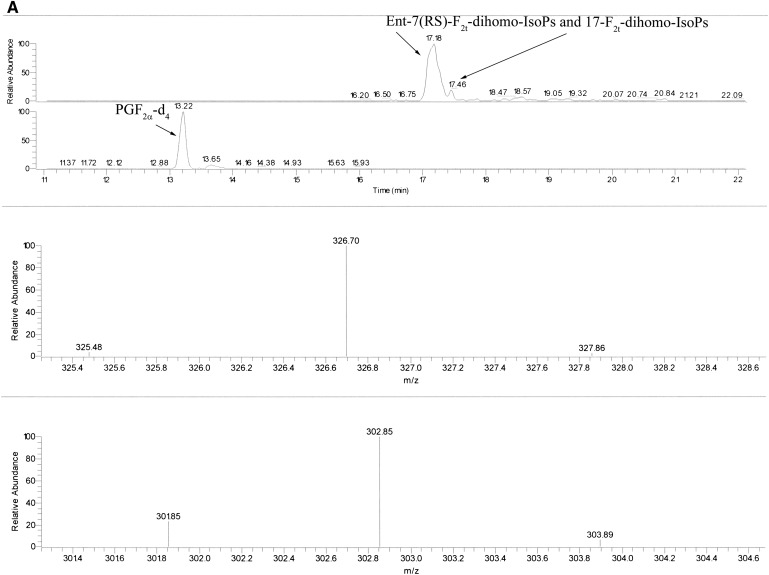
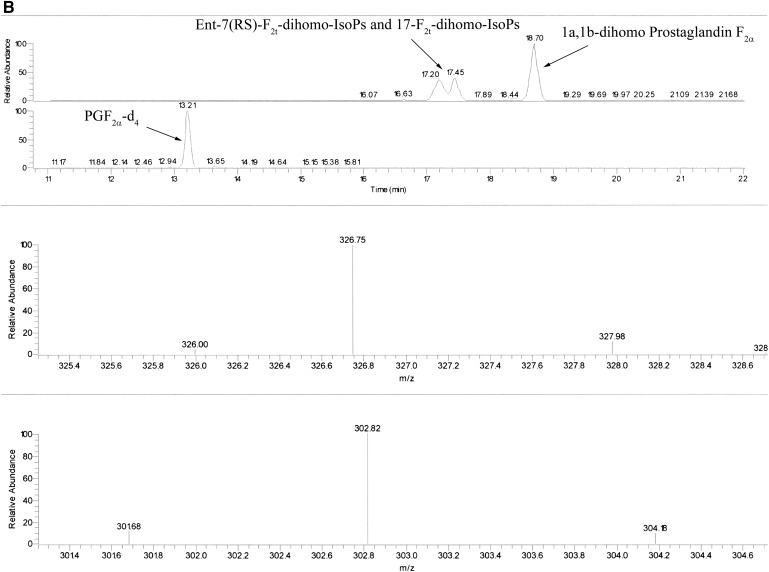
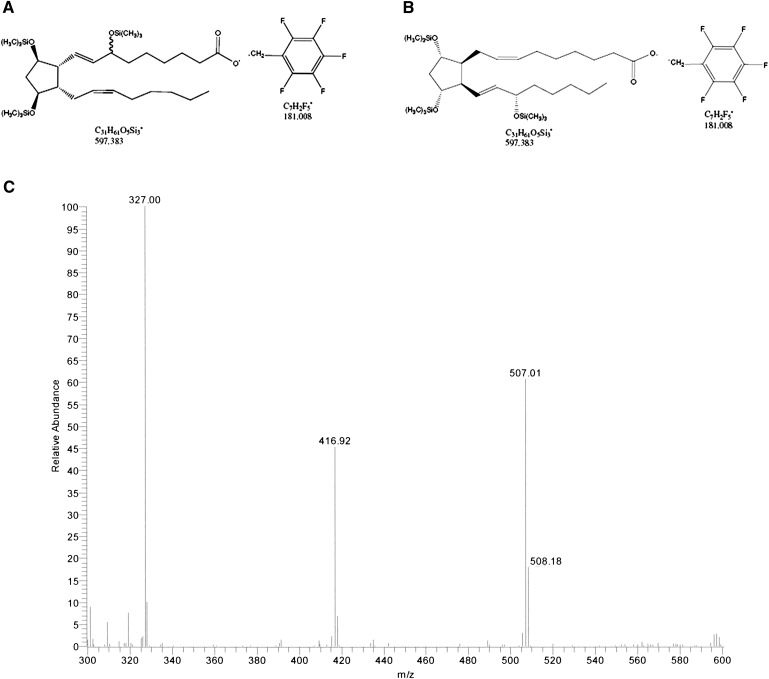
The measured ions were the product ions at m/z 327 and m/z 303 derived from the [M–181]− precursor ions (m/z 597 and m/z 573) produced from the derivatized ent-7(RS)-F2t-dihomo-IsoP and 17-F2t-dihomo-IsoP, and the PGF2α-d4, respectively (see Fig. 2A, B for typical chromatograms). The MS/MS spectrum is dominated by ions produced by loss of trimethylsilyl hydroxide (HOTMS). In fact, ions at m/z 507, 417, and 327 are attributable to the elimination of one, two, or three HOTMS groups, respectively, from ions [M–181]− ( Fig. 3 ). All of these ions are shifted by four units in the PGF2α-d4 (30).
Fig. 2.
Reconstructed ion chromatograms obtained under GC/NICI-MS/MS conditions by selecting the species [M–181]− (m/z 597) of F2-dihomo-IsoP as precursor ion. The detection of product ions was carried out by μscan in the m/z range 326.5–327.5. A: Ion chromatogram and product ion (327 m/z, precursor ion m/z 597 for F2-dihomo-IsoPs and 303 m/z, precursor ion m/z 573 for the internal standard PGF2α-d4) of a stage I RTT patient. B: Ion chromatogram and product ion (327 m/z, precursor ion m/z 597) of ent-7(RS)-F2t-dihomo-IsoP and 17-F2t-dihomo-IsoP (retention time, 17.20 and 17.45 min) and commercial 1a,1b-dihomo prostaglandin F2α (retention time 18.70 min). Ion chromatogram and product ion (303 m/z, precursor ion m/z 73) of the internal standard PGF2α-d4 (retention time, 13.21 min) are also reported. Retention times are indicated. The collision energy was 1.3 eV.
Fig. 3.
GC/NICI-MS/MS product ion mass spectra of F2-dihomo-IsoPs obtained by selecting ions [M–181]− (m/z 597) as precursor ion. The collision energy was 1.3 eV (C). Ent-7(RS)-F2t-dihomo-IsoP and 17-F2t-dihomo-IsoP derivatives (A, B, respectively) are also shown.
Because the most-abundant product ions are at m/z 327, a narrow range scan over m/z 326.5–327.5 for F2-dihomo-IsoPs (m/z 302.5–303.5 for the PGF2α-d4) is enough to ensure high selectivity of the MS/MS method together with good sensitivity.
The intra-assay coefficient of variability, as determined by three replicated measurements of the physiological content of F2-dihomo-IsoPs in biological samples, was 4.33 ± 0.86%. The inter-assay coefficient of variability, measured by comparing three samples containing specific amounts of authentic (i.e., synthesized molecules) F2-dihomo-IsoPs, was 4.47 ± 0.50%. The employed method was shown to be also accurate (i.e., closeness to the actual true quantity value), i.e., 99,2%.
As a consequence, although at this stage of the work, we are not able to fully establish the recovery of the compounds through the assay, the method appears to be sufficiently accurate and precise/reproducible.
Plasma F2-dihomo-IsoP levels in age- and gender-matched healthy controls range between 0.8 and 1.2 pg/ml (mean ± SEM; 1.0 ± 0.11 pg/ml). No statistically significant correlation between age and F2-dihomo-IsoPs in the normal subjects was observed (r = 0.0841, P = 0.40).
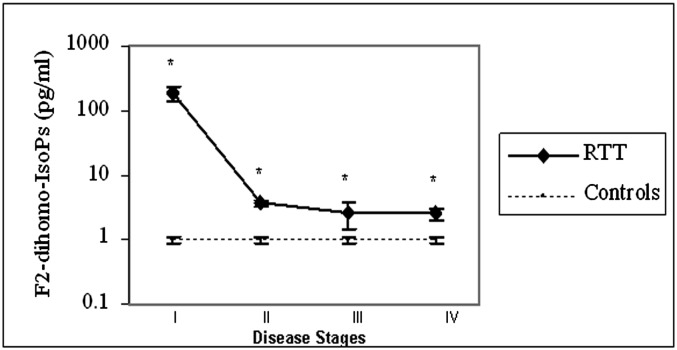
Plasma F2-dihomo-IsoPs were increased by about two orders of magnitude in RTT patients in stage I of the disease (185.9 ± 68.9 pg/ml; stage I vs. controls, P < 0.0001), whereas these values decreased by about 2- to 3-fold higher than in controls in later stages of the natural progression of the disease (stage II: 3.75 ± 0.43 pg/ml; stage III: 2.65 ± 1.15 pg/ml; stage IV: 2.53 ± 0.54 pg/ml) ( Fig. 4 ).
Fig. 4.
Plasma F2-dihomo-IsoPs are related to disease stage for RTT patients with the classical form of the disease. Plasma F2-dihomo-IsoPs were increased by about two orders of magnitude in RTT patients in stage I of the disease, whereas these values decreased by about 2- to 3-fold more than in controls in later stages of the natural progression of the disease. It is clear that control subjects cannot have stages, but they have been matched for gender (all females) and age with patients at stages I (control subjects, n = 10; mean age 1.5 years), II (control subjects, n = 15; mean age 5 years), III (control subjects, n = 20; mean age 12 years), and IV (control subjects, n = 25; mean age 16 years). Plasma F2-dihomo-IsoP values (mean ± SE) are presented in logarithmic scale. Asterisks indicate significant differences (P < 0.001) for RTT values versus those of controls.
In a subsample of 26 RTT patients at different stages (I to IV), no statistically significant relationships were observed between plasma F2-dihomo-IsoP levels and the concentrations of F2-IsoPs, originating from nonenzymatic oxidation of arachidonic acid (r = 0.2939, P = 0.1450), or F4-NeuroPs, originating from nonenzymatic oxidation of docosahexaenoic acid (DHA; 22:6 n-3), (r = 0.3456, P = 0.0838). Although chronic hypoxia is a relevant feature of RTT, no significant correlation between F2-dihomo-IsoP plasma levels and PaO2 was observed (r = −0.1492; P = 0.2078), suggesting that it is not the hypoxia per se that triggers the increase of F2-dihomo-IsoPs.
Patients with the early-onset seizure variant show F2-dihomo-IsoPs levels comparable to those of the late typical (clinical stages II to IV of the disease) form patients, whereas patients with PSV, i.e., the mildest form of RTT with somehow preserved verbal language (phrases and sentences), show levels comparable to those of healthy controls ( Table 2 ).
TABLE 2.
F2-dihomo-IsoPs as a function of RTT form
| Category | F2-dihomo-IsoPs |
| Controls (n = 43) | 1.0 ± 0.11 |
| Classic RTT (stages II–IV) (n = 60) | 3.3 ± 0.31 |
| Early-onset seizures variant (n = 10) | 2.6 ± 0.58 |
| Preserved speech variant (n = 11) | 1.05 ± 0.23 |
F2-dihomo-IsoP levels of patients in clinical stages II to IV of typical RTT and patients with the early-onset seizure variant are significantly (P < 0.0001) higher than those of healthy controls, whereas patients with the preserved-speech variant, i.e., the mildest form of RTT, with preserved verbal language (phrases/sentences), show levels comparable (P = 0.5862) to those of healthy controls. All values are reported as mean ± SEM.
The results of in vitro oxidation of plasma samples from RTT patients with AAPH showed a lack of significant increase in F2-dihomo-IsoP levels, indicating that the presence of F2-dihomo-IsoPs in RTT plasma is not due to artifactual oxidation from plasma sources (from 3.55 ± 0.77 pg/ml to 2.85 ± 0.07 pg/ml).
DISCUSSION
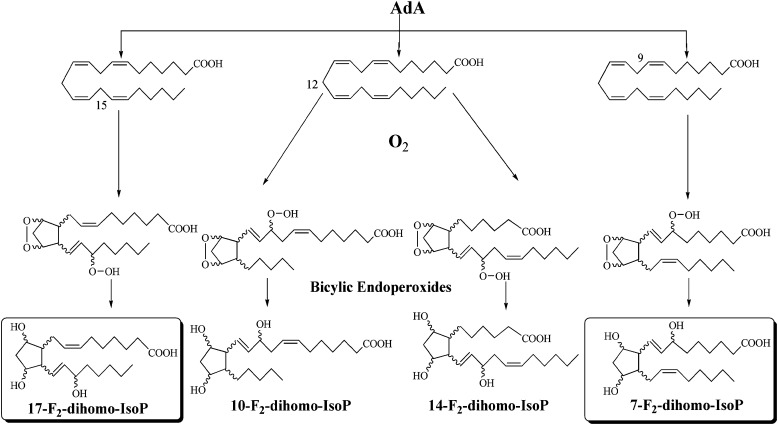
As recently described by VanRollins et al. (18), AdA oxidation products, such as F2-IsoPs, form four series of regioisomeric isoprostanoids, including 7-, 10-, 14-, and 17-series, termed 7-, 10-, 14-, and 17-dihomo-IsoPs ( Fig. 5 ), and show that 7- and 17-series are the most abundant.
Fig. 5.
Formation of the 7-, 10-, 14-, and 17-series F2-dihomo-IsoPs.
Roberts et al. (31) and later FitzGerald et al. (32) reported, after in vitro and in vivo studies, that 5- and 15-series IsoPs are formed in significantly greater amounts than 8- and 12-series IsoPs. Recently, Yin et al. (33) provided experimental evidence that 4- and 20-series NeuroPs are two of the most-abundant NeuroP regioisomers generated from the autoxidation of DHA, both in vitro and in vivo.
In the present study, we described the synthesis of the 7- and 17-series of F2-dihomo-IsoPs and investigated their potential value as biomarkers of lipid peroxidation in RTT.
In this study, for the first time, increased F2-dihomo-IsoP levels in plasma samples from RTT patients were detected. In particular, extremely high plasma levels of these AdA oxidation products were found in RTT girls in stage I of the disease, a stage characterized by a dramatic neurologic regression that represents one of the major hallmarks of this neurologic disease.
At this stage of our research, it is not possible to attribute the demonstrated changes in F2-dihomo-IsoP levels in RTT patients with 100% certainty to white matter oxidative damage only, considering that AdA, the source for F2-dihomo-IsoPs, is known to be present in several organs and tissues, including the kidney and the adrenal glands, from which it has been named (19). The main message of the present work is that although it is certainly true that in RTT, both AdA and DHA undergo a nonenzymatic oxidation, as compared with healthy controls, AdA, whatever the actual origin (brain white matter, adrenal gland, or kidney), is the PUFA that goes through the greatest degree of oxidation in the earliest stage of the typical form of the disease. On the other hand, to demonstrate that the F2-dihomo-IsoP changes observed here are due to brain white matter damage, the measure of F2-dihomo-IsoPs in a MeCP2-central nervous system knock-out animals would be needed in order to confirm or rather rule out our speculated origin of the F2-dihomo-IsoPs from the brain.
Our finding suggests that brain oxidative damage is already occurring during the first two years of the natural evolution of the disease and that this damage is also involving the peroxidation of AdA, a known component of myelin in the primate brain. To date, there is very little information regarding the brain white matter in RTT, although a recent investigation has evidenced a significant relationship between brain white matter damage (particularly of the superior longitudinal fasciculus, one of the main association bundles connecting the external surface of temporo-parieto-occipital regions with the convexity of the frontal lobe and in part associated with phonologic speech) (34, 35) and ability to speak (15).
Our data, based on plasma F2-dihomo-IsoP changes in stage I RTT, would suggest a previously unrecognized role for myelin oxidative damage occurring early during the natural progression of the disease. A prior study has reported an abnormality of white matter in RTT (36). Further supporting the concept of an early white matter damage in RTT, is the observation that some neurological signs (cognitive decline up to dementia, motor impairment, aphasia, apraxia) overlap with those of X-linked adrenoleukodystrophy, a rare inherited disorder leading to progressive brain damage, failure of the adrenal glands and eventually death, and caused by defects in the ATP binding cassette subfamily D member 1 transporter protein encoded by the ABCD1 gene (37). Curiously, the ABCD1 protein is indirectly involved in the breakdown of very long chain fatty acid (VLCFAs) found in the diet, and lack of this protein can give rise to an over-accumulation of VLCFAs which can lead to damage to brain, adrenal glands an peripheral nervous system.
The ophthalmologic involvement, including nystagmus, is more typical for the subacute or chronic demyelinating diseases such as multiple sclerosis, and is usually absent in typical RTT (38). Thus, a component of the symptomatologic picture at the onset for typical RTT could be related to an early brain white matter oxidation.
The process of human myelination has been recently revised by using a new brain NMR technique (i.e., quantitative myelin imaging with mcDESPOT) (39) showing that, at the mean age of neurological regression in RTT (i.e., about 12 months), myelin is already present in the cerebellum, pons, and internal capsule, splenium of the corpus callosum and optic radiations (by age of 5 months); the occipital and parietal lobes (by 5–6 months), and genu of the corpus callosum and frontal and temporal lobes after 8.3 months, thus mirroring the spatiotemporal pattern established by prior histological studies (40, 41).
Thus, an oxidative insult during the typical window of the RTT onset (6 to 18 months) is potentially able to damage myelin and probably corresponds to an increase in F2-dihomo-IsoPs in the bloodstream.
As a corollary, a hypoxic process in the first days of life would not be able to generate an increase in F2-dihomo-IsoPs, because the myelination process is only at the initial stages. Hence, the ideal age for a biochemical screening for typical RTT would be in between 3 and 6 months of age in girl infants with subtle neurologic abnormalities, inasmuch as prior reports have evidenced abnormal neurological behavior already in the first 4 months of life in girls with RTT (42, 43).
During the RTT progression, we observed a dramatic decrease in plasma F2-dihomo-IsoPs, although levels did not reach the normality range, thus strongly indicating that brain white matter must be present throughout all the natural history of the disease. In the present study, an exact matching between synthesized F2-dihomo-IsoPs and measured isomers was found, thus indicating the precise chemical structure of the detected peak in plasma samples. These two major series (7- and 17-F2-dihomo-IsoPs) could become potential therapeutical targets or, at least, early indicators of the onset of the disease, even before the knowledge of gene mutation. In the near future, it will be interesting to evaluate the behavior of F2-dihomo-IsoPs in the existing experimental models of RTT based on MeCP2 dysfunction (44) or rescued (45), although we should always keep in mind that AdA is known to be enriched only in primate and human myelin (17).
The triad of enhanced OS, abnormal mitochondrial metabolism, and dysregulated immune response has been shown to represent the common molecular underpinning of pervasive neurodevelopmental disorders, such as autism spectrum disorder, RTT, and Down syndrome, which, although different in their etiology, share significant overlapping clinical and neuropathological features (46).
In RTT patients, we have previously shown the coexistence of hypoxia (mild chronic hypoxia) and systemic OS (16). The key biological concept, that under hypoxic conditions, OS (i.e., generation of the superoxide radical in the specific case) can paradoxically be generated, had been first established by the work of the Rifkind group (47) by examining the in vitro hemoglobin autoxidation, which has been subsequently confirmed (48, 49).
The findings of our cumulative studies on RTT strongly reinforce the concept that OS is deeply involved in its pathogenesis, and suggest that MeCP2 plays unrecognized roles in the regulation of molecular targets involved in the adaptive response to OS, such as brain-derived neurotrophic factor (50), cAMP-responsive element binding protein (51), and proline dehydrogenase (52), among many others probably not yet recognized. This notion is also in line with previous reports on mitochondrial abnormalities in RTT patients (52) and experimental animal models (53).
These points strongly reinforce the general concept that hypoxia can be linked to OS and vice versa. How and when hypoxia occurs during the natural history of RTT is, of course, a major issue deserving to be addressed in the near future.
In addition, our findings indicate the importance of plasma as a suitable biological fluid for detecting markers of central nervous system oxidative damage in RTT (16, 54, 55) and underline the key role of interaction between organic chemists, OS biochemists, and clinicians in the discovery of new markers of disease and potential targets for new interventional strategies.
In conclusion, our results indicate for the first time that quantification of F2-dihomo-IsoPs in plasma represents an early marker of the disease and may provide a better understanding of the pathogenic mechanisms behind the neurological regression in patients with RTT.
Acknowledgments
This paper is dedicated to professional singer Matteo Setti (Reggio Emilia, Italy, official web site: http://www.matteosetti.it). His valuable collaboration triggered our studies on oxidative stress in Rett syndrome and gave birth to the project “Il Respiro della Musica” (“The Breath of Music”) targeted at the study of the effects of singing and music as exploratory tools on the physiology of Rett syndrome listeners. The authors thank the Azienda Ospedaliera Universitaria Senese Hospital administration for mass spectrometer purchasing, and Roberto Faleri (Central Medical Library, University of Siena, Siena, Italy) for online bibliographic assistance. We acknowledge “Cell Lines and DNA Bank of Rett Syndrome and Other X Mental Retardation” (Prof. Alessandra Renieri, Medical Genetics-Siena) for gene mutations analyses.
Footnotes
Abbreviations:
- AAPH
- 2, 2′ azobis (2-aminopropane) hydrochloride
- AdA
- adrenic acid
- BSTFA
- N,O-bis(trimethylsilyl)trifluoroacetamide
- CDKL5
- cyclin-dependent kinase-like 5
- DHA
- docosahexaenoic acid
- DIPEA
- diisopropylethylamine
- F2-dihomo-IsoPs
- F2-dihomo-isoprostanes
- GC/NICI-MS/MS
- gas chromatography/negative-ion chemical ionization tandem mass spectrometry
- MeCP2
- methyl-CpG binding protein 2
- OS
- oxidative stress
- RTT
- Rett syndrome
This work was partially supported by grants from the Toscana Life Sciences (Orphan_0108 Call; title: “Nuovi approcci terapeutici nella sindrome di Rett”), Siena, Italy. T.D. is grateful to the University of Montpellier I (BQR-2008) and INRA (AlimH-2008-2010) for financial support.
REFERENCES
- 1. Amir R. E., Van den Veyver I. B., Wan M., Tran C. Q., Francke U., Zoghbi H. Y. 1999. Rett syndrome is caused by mutation in X-linked MECP2, encoding methyl-CpG-binding protein 2. Nat. Genet. 23: 185–188. [DOI] [PubMed] [Google Scholar]
- 2. Cardaioli E., Dotti M. T., Hayek G., Zappella M., Federico A. 1999. Studies on mitochondrial pathogenesis of Rett syndrome: ultrastructural data from skin and muscle biopsies and mutational analysis at mtDNA nucleotides 10463 and 2835. J. Submicrosc. Cytol. Pathol. 31: 301–304. [PubMed] [Google Scholar]
- 3. Squillaro T., Hayek G., Farina E., Cipollaro M., Renieri A., Galderisi U. 2008. A case report: bone marrow mesenchymal stem cells from a Rett syndrome patient are prone to senescence and show a lower degree of apoptosis. J. Cell. Biochem. 103: 1877–1885. [DOI] [PubMed] [Google Scholar]
- 4. De Felice C., Guazzi G., Rossi M., Ciccoli L., Signorini C., Leoncini S., Tonni G., Latini G., Valacchi G., Hayek J. 2010. Unrecognized lung disease in classic Rett syndrome: a physiologic and high-resolution CT imaging study. Chest. 138: 386–392. [DOI] [PubMed] [Google Scholar]
- 5. Guideri F., Acampa M., DiPerri T., Zappella M., Hayek Y. 2001. Progressive cardiac dysautonomia observed in patients affected by classic Rett syndrome and not in the preserved speech variant. J. Child Neurol. 16: 370–373. [DOI] [PubMed] [Google Scholar]
- 6. Weng S. M., McLeod F., Bailey M. E., Cobb S. R. 2011. Synaptic plasticity deficits in an experimental model of Rett syndrome: long-term potentiation saturation and its pharmacological reversal. Neuroscience. 180: 314–321. [DOI] [PubMed] [Google Scholar]
- 7. Armstrong D., Dunn J. K., Antalffy B., Trivedi R. 1995. Selective dendritic alterations in the cortex of Rett syndrome. J. Neuropathol. Exp. Neurol. 54: 195–201. [DOI] [PubMed] [Google Scholar]
- 8. Belichenko P. V., Hagberg B., Dahlstrom A. 1997. Morphological study of neocortical areas in Rett syndrome. Acta Neuropathol. 93: 50–61. [DOI] [PubMed] [Google Scholar]
- 9. Armstrong D. D., Dunn K., Antalffy B. 1998. Decreased dendritic branching in frontal, motor and limbic cortex in Rett syndrome compared with trisomy 21. J. Neuropathol. Exp. Neurol. 57: 1013–1017. [DOI] [PubMed] [Google Scholar]
- 10. Armstrong D. D. 2005. Can we relate MeCP2 deficiency to the structural and chemical abnormalities in the Rett brain? Brain Dev. 27 (Suppl.): 72–76. [DOI] [PubMed] [Google Scholar]
- 11. Chao H. T., Zoghbi H. Y., Rosenmund C. 2007. MeCP2 controls excitatory synaptic strength by regulating glutamatergic synapse number. Neuron. 56: 58–65. [DOI] [PMC free article] [PubMed] [Google Scholar]
- 12. Zhang L., He J., Jugloff D. G., Eubanks J. H. 2008. The MeCP2-null mouse hippocampus displays altered basal inhibitory rhythms and is prone to hyperexcitability. Hippocampus. 18: 294–309. [DOI] [PubMed] [Google Scholar]
- 13. D'Cruz J. A., Wu C., Zahid T., El-Hayek Y., Zhang L., Eubanks J. H. 2010. Alterations of cortical and hippocampal EEG activity in MeCP2-deficient mice. Neurobiol. Dis. 38: 8–16. [DOI] [PubMed] [Google Scholar]
- 14. Guy J., Gan J., Selfridge J., Cobb S., Bird A. 2007. Reversal of neurological defects in a mouse model of Rett syndrome. Science. 315: 1143–1147. [DOI] [PMC free article] [PubMed] [Google Scholar]
- 15. Mahmood A., Bibat G., Zhan A. L., Izbudak I., Farage L., Horska A., Mori S., Naidu S. 2010. White matter impairment in Rett syndrome: diffusion tensor imaging study with clinical correlations. Am. J. Neuroradiol. 31: 295–299. [DOI] [PMC free article] [PubMed] [Google Scholar]
- 16. De Felice C., Ciccoli L., Leoncini S., Signorini C., Rossi M., Vannuccini L., Guazzi G., Latini G., Comporti M., Valacchi G., et al. 2009. Systemic oxidative stress in classic Rett syndrome. Free Radic. Biol. Med. 47: 440–448. [DOI] [PubMed] [Google Scholar]
- 17. Sastry P. S. 1985. Lipids of nervous tissue: composition and metabolism. Prog. Lipid Res. 24: 69–176. [DOI] [PubMed] [Google Scholar]
- 18. VanRollins M., Woltjer R. L., Yin H., Morrow J. D., Montine T. J. 2008. F2-dihomo-isoprostanes arise from free radical attack on adrenic acid. J. Lipid Res. 49: 995–1005. [DOI] [PMC free article] [PubMed] [Google Scholar]
- 19. Sprecher H., VanRollins M., Sun F., Wyche A., Needleman P. 1982. Dihomo-prostaglandins and -thromboxane. A prostaglandin family from adrenic acid that may be preferentially synthesized in the kidney. J. Biol. Chem. 257: 3912–3918. [PubMed] [Google Scholar]
- 20. Oger C., Brinkmann Y., Bouazzoui S., Durand T., Galano J-M. 2008. Stereocontrolled access to isoprostanes via a bicyclo[3.3.0]octene framework. Org. Lett. 10: 5087–5090. [DOI] [PubMed] [Google Scholar]
- 21. Neul J. L., Kaufmann W. E., Glaze D. G., Christodoulou J., Clarke A. J., Bahi-Buisson N., Leonard H., Bailey M. E., Schanen N. C., Zappella M., et al. 2010. Rett syndrome: revised diagnostic criteria and nomenclature. Ann. Neurol. 68: 944–950. [DOI] [PMC free article] [PubMed] [Google Scholar]
- 22. Christodoulou J., Grimm A., Maher T., Bennetts B. 2003. RettBASE: the IRSA MECP2 variation database—a new mutation database in evolution. Hum. Mutat. 21: 466–472. [DOI] [PubMed] [Google Scholar]
- 23. Sampieri K., Meloni I., Scala E., Ariani F., Caselli R., Pescucci C., Longo I., Artuso R., Bruttini M., Mencarelli M. A., et al. 2007. Italian Rett database and biobank. Hum. Mutat. 28: 329–335. [DOI] [PubMed] [Google Scholar]
- 24. Hagberg B. 2002. Clinical manifestations and stages of Rett syndrome. Ment. Retard. Dev. Disabil. Res. Rev. 8: 61–65. [DOI] [PubMed] [Google Scholar]
- 25. Neul J. L., Fang P., Barrish J., Lane J., Caeg E. B., Smith E. O., Zoghbi H., Percy A., Glaze D. G. 2008. Specific mutations in methyl-CpG-binding protein 2 confer different severity in Rett syndrome. Neurology. 70: 1313–1321. [DOI] [PMC free article] [PubMed] [Google Scholar]
- 26. Monrós E., Armstrong J., Aibar E., Poo P., Canós I., Pineda M. 2001. Rett syndrome in Spain: mutation analysis and clinical correlations. Brain Dev. 23 (Suppl. 1): 251–253. [DOI] [PubMed] [Google Scholar]
- 27. Oger C., Marton S., Brinkmann Y., Bultel-Poncé V., Durand T., Grabber M., Galano J-M. 2010. Lipase-catalyzed regioselective monoacetylation of unsymmetrical 1,5-primary diols. J. Org. Chem. 75: 1892–1897. [DOI] [PubMed] [Google Scholar]
- 28. Asha Devi S., Shiva Shankar Reddy C. S., Subramanyam M. V. 2011. Peroxyl-induced oxidative stress in aging erythrocytes of rat. Biogerontology. 12: 283–292. [DOI] [PubMed] [Google Scholar]
- 29. Tomida H., Fujii T., Furutani N., Michihara A., Yasufuku T., Akasaki K., Maruyama T., Otagiri M., Gebicki J. M., Anraku M. 2009. Antioxidant properties of some different molecular weight chitosans. Carbohydr. Res. 344: 1690–1696. [DOI] [PubMed] [Google Scholar]
- 30. Signorini C., Comporti M., Giorgi G. 2003. Ion trap tandem mass spectrometric determination of F2-isoprostanes. J. Mass Spectrom. 38: 1067–1074. [DOI] [PubMed] [Google Scholar]
- 31. Waugh R. J., Morrow J. D., Roberts L. J., II, Murphy R. C. 1997. Identification and relative quantitation of F2-isoprostane regioisomers formed in vivo in the rat. Free Radic. Biol. Med. 23: 943–954. [DOI] [PubMed] [Google Scholar]
- 32. Li H., Lawson J. A., Reilly M., Adiyaman M., Hwang S. W., Rokach J., FitzGerald G. A. 1999. Quantitative high performance liquid chromatography tandem/mass spectrometric analysis of the four classes of F(2)-isoprostanes in human urine. Proc. Natl. Acad. Sci. USA. 96: 13381–13386. [DOI] [PMC free article] [PubMed] [Google Scholar]
- 33. Yin H., Musiek E. S., Gao L., Porter N. A., Morrow J. D. 2005. Regiochemistry of neuroprostanes generated from the peroxidation of docosahexaenoic acid in vitro and in vivo. J. Biol. Chem. 280: 26600–26611. [DOI] [PubMed] [Google Scholar]
- 34. Tanabe H., Sawada T., Inoue N., Ogawa M., Kuriyama Y., Shiraishi J. 1987. Conduction aphasia and arcuate fasciculus. Acta Neurol. Scand. 76: 422–427. [DOI] [PubMed] [Google Scholar]
- 35. Boatman D., Gordon B., Hart J., Selnes O., Miglioretti D., Lenz F. 2000. Transcortical sensory aphasia: revisited and revised. Brain. 123: 1634–1642. [DOI] [PubMed] [Google Scholar]
- 36. Pan J. W., Lane J. B., Hetherington H., Percy A. K. 1999. Rett syndrome: 1H spectroscopic imaging at 4.1 Tesla. J. Child Neurol. 14: 524–528. [DOI] [PubMed] [Google Scholar]
- 37. Cappa M., Bizzarri C., Vollono C., Petroni A., Banni S. 2011. Adrenoleukodystrophy. Endocr. Dev. 20: 149–160. [DOI] [PubMed] [Google Scholar]
- 38. Saunders K. J., McCulloch D. L., Kerr A. M. 1995. Visual function in Rett syndrome. Dev. Med. Child Neurol. 37: 496–504. [DOI] [PubMed] [Google Scholar]
- 39. Deoni S. C., Mercure E., Blasi A., Gasston D., Thomson A., Johnson M., Williams S. C., Murphy D. G. 2011. Mapping infant brain myelination with magnetic resonance imaging. J. Neurosci. 31: 784–791. [DOI] [PMC free article] [PubMed] [Google Scholar]
- 40. Yakovlev P. I., Leours A. R. 1967. The myelogenetic cycles of regional maturation of the brain. Regional Development of the Brain in Early Life. Minkowski A., editor Blackwell, Oxford: 3–70. [Google Scholar]
- 41. Kinney H. C., Brody B. A., Kloman A. S., Gilles F. H. 1988. Sequence of central nervous system myelination in human infancy. II. Patterns of myelination in autopsied infants. J. Neuropathol. Exp. Neurol. 47: 217–234. [DOI] [PubMed] [Google Scholar]
- 42. Einspieler C., Kerr A. M., Prechtl H. F. 2005. Abnormal general movements in girls with Rett disorder: the first four months of life. Brain Dev. 27 (Suppl.): 8–13. [DOI] [PubMed] [Google Scholar]
- 43. Einspieler C., Kerr A. M., Prechtl H. F. 2005. Is the early development of girls with Rett disorder really normal? Pediatr. Res. 57: 696–700. [DOI] [PubMed] [Google Scholar]
- 44. Calfa G., Percy A. K., Pozzo-Miller L. 2011. Experimental models of Rett syndrome based on Mecp2 dysfunction. Exp. Biol. Med. (Maywood). 236: 3–19. [DOI] [PMC free article] [PubMed] [Google Scholar]
- 45. Cobb S., Guy J., Bird A. 2010. Reversibility of functional deficits in experimental models of Rett syndrome. Biochem. Soc. Trans. 38: 498–506. [DOI] [PubMed] [Google Scholar]
- 46. Lintas C., Sacco R., Persico A. M. 2011. Genome-wide expression studies in Autism spectrum disorder, Rett syndrome, and Down syndrome. Neurobiol. Dis. In press. [DOI] [PubMed] [Google Scholar]
- 47. Balagopalakrishna C., Manoharan P. T., Abugo O. O., Rifkind J. M. 1996. Production of superoxide from hemoglobin-bound oxygen under hypoxic conditions. Biochemistry. 35: 6393–6398. [DOI] [PubMed] [Google Scholar]
- 48. Nagababu E., Ramasamy S., Rifkind J. M. 2002. Site-specific cross-linking of human and bovine hemoglobins differentially alters oxygen binding and redox side reactions producing rhombic heme and heme degradation. Biochemistry. 41: 7407–7415. [DOI] [PubMed] [Google Scholar]
- 49. Ciccoli L., Rossi V., Leoncini S., Signorini C., Blanco-Garcia J., Aldinucci C., Buonocore G., Comporti M. 2004. Iron release, superoxide production and binding of autologous IgG to band 3 dimers in newborn and adult erythrocytes exposed to hypoxia and hypoxia-reoxygenation. Biochim. Biophys. Acta. 1672: 203–213. [DOI] [PubMed] [Google Scholar]
- 50. Wang H., Yuan G., Prabhakar N. R., Boswell M., Katz D. M. 2006. Secretion of brain-derived neurotrophic factor from PC12 cells in response to oxidative stress requires autocrine dopamine signaling. J. Neurochem. 96: 694–705. [DOI] [PubMed] [Google Scholar]
- 51. Pugazhenthi S., Phansalkar K., Audesirk G., West A., Cabell L. 2006. Differential regulation of c-jun and CREB by acrolein and 4-hydroxynonenal. Free Radic. Biol. Med. 40: 21–34. [DOI] [PubMed] [Google Scholar]
- 52. Urdinguio R. G., Lopez-Serra L., Lopez-Nieva P., Alaminos M., Diaz-Uriarte R., Fernandez A. F., Esteller M. 2008. Mecp2-null mice provide new neuronal targets for Rett syndrome. PLoS ONE. 3: e3669. [DOI] [PMC free article] [PubMed] [Google Scholar]
- 53. Kriaucionis S., Paterson A., Curtis J., Guy J., Macleod N., Bird A. 2006. Gene expression analysis exposes mitochondrial abnormalities in a mouse model of Rett syndrome. Mol. Cell. Biol. 26: 5033–5042. [DOI] [PMC free article] [PubMed] [Google Scholar]
- 54. Pecorelli A., Ciccoli L., Signorini C., Leoncini S., Giardini A., D'Esposito M., Filosa S., Hayek J., De Felice C., Valacchi G. 2011. Increased levels of 4HNE-protein plasma adducts in Rett syndrome. Clin. Biochem. 44: 368–371. [DOI] [PubMed] [Google Scholar]
- 55. Signorini C., De Felice C., Leoncini S., Giardini A., D'Esposito M., Filosa S., Della Ragione F., Rossi M., Pecorelli A., Valacchi G., et al. 2011. F(4)-neuroprostanes mediate neurological severity in Rett syndrome. Clin. Chim. Acta. 412: 1399–1406. [DOI] [PubMed] [Google Scholar]


