

Abstract
The M2 protein of the influenza A virus acts both as a drug-sensitive proton channel and mediates virus budding through membrane scission. The segment responsible for causing membrane curvature is an amphipathic helix in the cytoplasmic domain of the protein. Here, we use 31P and 13C solid-state NMR to examine M2-induced membrane curvature. M2(22–46), which includes only the transmembrane (TM) helix, and M2(21–61), which contains an additional amphipathic helix, are studied. 31P chemical shift lineshapes indicate that M2(21–61) causes a high-curvature isotropic phase to both cholesterol-rich virus-mimetic membranes and 1,2-dimyristoyl-sn-glycero-3-phosphocholine bilayers, whereas M2(22–46) has minimal effect. The lamellar and isotropic domains have distinct 31P isotropic chemical shifts, indicating perturbation of the lipid headgroup conformation by the amphipathic helix. 31P- and 13C-detected 1H T2 relaxation and two-dimensional peptide-lipid correlation spectra show that M2(21–61) preferentially binds to the high-curvature domain. 31P linewidths indicate that the isotropic vesicles induced by M2(21–61) are 10–35 nm in diameter, and the virus-mimetic vesicles are smaller than the 1,2-dimyristoyl-sn-glycero-3-phosphocholine vesicles. A strong correlation is found between high membrane curvature and weak drug-binding ability of the TM helix. Thus, the M2 amphipathic helix causes membrane curvature, which in turn perturbs the TM helix conformation, abolishing drug binding. These NMR experiments are applicable to other curvature-inducing membrane proteins such as fusion proteins and antimicrobial peptides.
Introduction
Many membrane peptides and proteins cause curvature to the phospholipid bilayer as their mechanism of action. Examples include viral fusion proteins (1–3), antimicrobial peptides (4–6), cell penetrating peptides (7), and proteins that pinch off newly assembled viruses from host cells (8). Protein-induced membrane curvature can be examined by small-angle x-ray scattering (6,9) and electron microscopy (EM) (10,11), which, however, cannot detect the protein structure. Solid-state NMR spectroscopy is a unique tool to simultaneously investigate membrane curvature and the high-resolution structures of membrane proteins (12). 31P chemical shifts depend sensitively on the phase and dynamics of the lipid membrane (13). Lamellar bilayers with uniaxially mobile lipids give rise to static 31P powder patterns with a motionally narrowed span of ∼45 ppm, with the maximum intensity at the low-frequency edge of the powder pattern. Lipid morphologies with isotropic symmetry, including micelles, small isotropic vesicles, and cubic phases, manifest a narrow peak at the 31P isotropic shift of ∼0 ppm. The width of the isotropic peak depends on the size of the isotropic domain: the smaller the assembly, the faster the lipid reorientation over the surface of the isotropic domain, and the sharper the 31P signal (14). Hexagonal phases exhibit a powder pattern that is inverted from the lamellar phase powder pattern around the isotropic shift, and the chemical shift span is halved (15). 31P NMR has been used to study membrane curvature induced by antimicrobial peptides (16–19), fusion peptides (20), and other membrane-active peptides (21,22). However, few studies have investigated protein partitioning into membrane domains with different curvatures. Knowledge of protein partitioning is important, because membrane protein conformation and dynamics can be sensitive to membrane curvature, in addition to other environmental factors (23).
The M2 protein of influenza A viruses have been extensively studied for its drug-sensitive proton channel activity (24,25). M2 assembles into a tetrameric bundle that opens at low pH to conduct protons (26). Endocytosis of the virus into the acidic endosome of the host cell opens the channel, acidifies the virion, and releases the viral ribonucleoprotein complex into the cell. The channel is inhibited by the adamantane class of antiviral drugs. Mutagenesis and electrophysiological experiments suggested the drug-binding site to lie in the transmembrane (TM) pore (27–29). This is supported by a high-resolution x-ray crystal structure (30) of the M2 TM peptide (M2TM), which showed amantadine (Amt) electron densities in the N-terminal pore. However, a solution NMR structure of a longer M2 construct containing both the TM domain and an amphipathic cytoplasmic helix did not detect drug in the pore, but instead found drug-protein crosspeaks for residues on the C-terminal lipid-facing surface of the TM helix (31). A subsequent solid-state NMR study revealed that this surface site results from nonspecific association of excess drugs from the membrane, whereas the pore site near residue S31 is the high-affinity binding site (32,33).
In addition to the proton channel function, M2 also mediates membrane scission of the newly assembled virus from the host cell (8). Electron and immunofluorescence microscopy data showed that the wild-type protein causes membrane curvature to large unilamellar vesicles, whereas amphipathic helix mutants abolish this effect in vitro and arrest virus budding in vivo (8). A peptide corresponding to the amphipathic helix reproduced the membrane budding effect of the full-length protein. The curvature-inducing effect of M2 is moderated by cholesterol. In phase-separated giant unilamellar vesicles composed of sphingomyelin (SM), polyunsaturated phosphocholine, and cholesterol, M2 resides at the boundary between the liquid-ordered and liquid-disordered phases.
In this study, we use 31P NMR to characterize the curvature-inducing effect of M2 and 1H relaxation and 1H-31P correlation NMR to determine the location of M2 in membrane domains with different curvatures. We investigate the interactions of M2(22–46) and M2(21–61) with 1,2-dimyristoyl-sn-glycero-3-phosphocholine (DMPC) bilayers and with a cholesterol-rich virus-envelope-mimetic membrane. Our data reveal the effect of membrane curvature on the conformation and drug-binding capability of the TM domain.
Materials and Methods
Membrane sample preparation
M2(22–46) and M2(21–61) were synthesized using Fmoc chemistry by PrimmBiotech (Cambridge, MA) and purified to >95% purity. M2(22–46) spans only the TM domain, whereas M2(21–61) contains both the TM and amphipathic helices. Both peptides were 13C, 15N-labeled at V27, S31, G34, and D44.
DMPC bilayers and a mixed membrane (VM) mimicking the virus envelope lipid composition were used to reconstitute the peptides. The VM membrane is composed of 1,2-dipalmitoyl-sn-glycero-3-phosphocholine, 1,2-dipalmitoyl-sn-glycero-3-phosphoethanolamine, egg SM with predominantly 16:0 acyl chains, and cholesterol at a mole ratio of 21:21:28:30%. The lipids were codissolved in chloroform and methanol, dried under a stream of nitrogen, redissolved in cyclohexane, and lyophilized to obtain a homogeneous dry powder. The powder was suspended in pH 7.5 phosphate buffer (10 mM Na2HPO4/NaH2PO4, 1 mM EDTA, 0.1 mM NaN3) and freeze-thawed six times to produce a uniform suspension. The peptides were solubilized in octylglucoside solution and incubated with the lipid vesicle solution at room temperature overnight, followed by dialysis for 3 days at 4°C (34). 1H solution NMR spectra confirmed the quantitative removal of octylglucoside from the membrane at the end of the dialysis (Table S1 in the Supporting Material). No freeze-thawing was applied after dialysis, to prevent formation of small isotropic vesicles unrelated to the effect of M2. The proteoliposomes were centrifuged at 150,000 × g for 4 h to give membrane pellets with ∼40 wt% hydration, which were packed into 4 mm magic-angle-spinning (MAS) rotors for NMR experiments. The peptide/lipid molar ratio was 1:8 for M2(22–46) and 1:15 for M2(21–61), both of which correspond to mass ratios of ∼1:2. Many samples contain Amt at 5:1 drug/tetramer mole ratio, which corresponds to 2.0–3.8% of the lipid mass (see the Supporting Material), to monitor drug dynamics in separate studies (33).
As controls, peptide-free DMPC and VM lamellar membranes were prepared by freeze-thawing the vesicle suspension three times for DMPC and eight times for VM membranes. Small isotropic DMPC vesicles were prepared by 10 cycles of freeze-thawing followed by 40 min of sonication.
Solid-state NMR experiments
NMR experiments were carried out on a Bruker DSX-400 MHz spectrometer at 9.4 Tesla and an AVANCE 600 MHz spectrometer at 14.1 Tesla using 4 mm MAS probes. Typical radiofrequency pulse lengths were 3.5–5.0 μs for 1H and 5 μs for 31P and 13C. 13C chemical shifts were referenced to the 13CO signal of α-Gly at 176.49 ppm on the tetramethylsilane scale, and 31P chemical shifts were referenced to the 31P peak of hydroxyapatite at 2.73 ppm.
One-dimensional static and MAS 31P spectra were measured at 298 or 303 K to distinguish lamellar bilayers from small isotropic vesicles. All temperatures were measured by a thermocouple placed a few millimeters from the MAS rotor. At the near-ambient temperature, moderate spinning speeds and air flows used in our experiments, the temperature gradient over the samples is small and the sample temperature is within 2°C of the thermocouple reported value based on calibrations using 207Pb NMR of lead nitrate. 31P and 13C-detected 1H T2 decays were measured using the pulse sequence in Fig. S1 a at 298 K under 7 kHz MAS. By comparing peptide 13C-detected and lipid 31P-detected 1H T2 decays, we determine whether M2 is preferentially bound to the lamellar or the isotropic domain. 31P-detected 1H T2 relaxation decays of peptide-free control membranes were measured under 5 kHz MAS. 1H spin diffusion mixing times varied from 25 to 100 ms.
Two-dimensional (2D) 1H-31P and 1H-13C heteronuclear correlation (HETCOR) spectra were measured at 14.1 Tesla at 297 K under 7.5 kHz MAS. 1H homonuclear decoupling during the evolution period was achieved using the FSLG sequence (35) (Fig. S1 b) with a transverse field strength of 62.5 kHz. 1H chemical shift was calibrated using N-formyl-Met-Leu-Phe-OH, whose 1H isotropic shifts are known (36). Lee-Goldburg cross-polarization was used to suppress 1H spin diffusion. The cross-polarization contact time was 3 ms for 1H-31P and 300 μs for 1H-13C HETCOR. A mixing time of 300 μs was used after the t1 period to equilibrate the peptide and lipid 1H magnetization.
Results
M2(21–61) causes high-curvature isotropic membrane domains
To investigate the curvature-inducing effect of M2, we measured the static 31P spectra of DMPC and VM membranes without and with peptides (Fig. 1). All spectra show a 43–48 ppm wide powder pattern with a uniaxial lineshape, as expected for liquid-crystalline lamellar bilayers. In addition, several samples exhibit a significant isotropic peak near 0 ppm. All membranes containing M2(21–61) show this isotropic peak (bottom row), whereas M2(22–46) does not cause the isotropic peak to the VM membrane and only a small isotropic peak to the DMPC membrane (middle row). The isotropic linewidth varies from 6.0 ppm for the M2(21–61)-DMPC sample to 2.2 ppm for the M2(21–61)-VM sample. For control samples without the peptide (top row), the DMPC bilayer does not show any isotropic peak, consistent with the absence of intrinsic curvature strain of phosphocholine, whereas the VM membrane shows a strong isotropic peak when Amt is present (see Fig. 1 d) but a weak one when the drug is absent (see Fig. 1 g).
Figure 1.
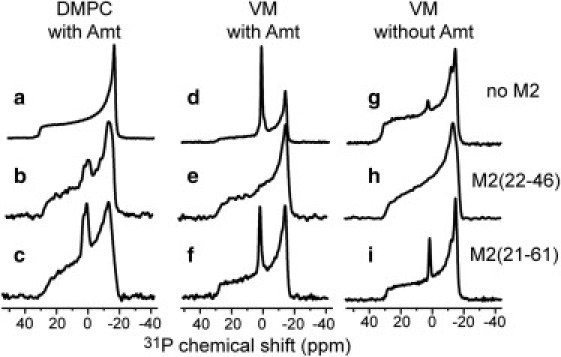
Static 31P spectra of DMPC (a–c) and VM (d–i) membranes in the absence and presence of M2 at 303 K. (a, d, and g) Protein-free lipid bilayers. (b, e, and h) M2TM-containing membranes. (c, f, and i) M2(21–61)-containing membranes. The DMPC spectra (a–c) and the VM spectra (d–f) were measured on samples with Amt, whereas the VM spectra (g, h, and i) were measured on samples without Amt.
A narrow isotropic peak in static 31P spectra indicates the presence of lipids that undergo fast isotropic reorientation on the NMR timescale. This motion can be tumbling of small vesicles in solution, or lateral diffusion of lipids over the highly curved membrane domain. The isotropic phase can be small vesicles, cubic phases, or even micelles. Given the hydration level of ∼40% for our samples, fast tumbling is unlikely, thus we attribute the isotropic peak primarily to lipid lateral diffusion. Regardless of the mechanism of line narrowing, the isotropic peak indicates the presence of a high-curvature membrane domain with isotropic symmetry, distinct from the lamellar phase.
Both M2(21–61) and the drug induce the isotropic phase. In the absence of M2 and Amt, the DMPC and VM membranes exhibit no or very little isotropic peak. However, when Amt is present, the VM membrane shows a strong isotropic peak while DMPC does not (Fig. 1, a and d). Thus, Amt and cholesterol synergistically exert curvature strain to the membrane. Cholesterol is known to be inserted into the glycerol and acyl chain regions of the lipid bilayer (37), thus the curvature strain is negative, as indicated by x-ray diffraction, EM, and NMR studies of various cholesterol-containing membranes (38–40). Solid-state NMR data and molecular dynamics simulations indicate that Amt also partitions to the glycerol region of the membrane (41), thus it should enhance the negative curvature. The fact that M2(22–46) completely suppressed this isotropic phase in the VM membrane (Fig. 1, e and h), indicates that it counters the action of Amt and cholesterol by inducing positive curvature. Independent of the effect of the drug, M2(21–61) causes membrane curvature, as shown by the drug-free VM spectrum containing the peptide (Fig. 1 i).
Although 31P anisotropic shift indicates the phase and morphology of the membrane, isotropic 31P chemical shift measured under MAS indicates the chemical environment and headgroup conformation of the lipids. Fig. 2 superimposes the static and MAS spectra of DMPC and VM membranes with and without M2. For the M2(21–61)-DMPC sample, the MAS spectrum resolved two isotropic peaks (Fig. 2 a): the +1.9 ppm peak matches the isotropic peak in the static spectrum, whereas the −1.1 ppm peak matches the average of the three principal values of the lamellar powder pattern reported recently (32). The different isotropic shifts indicate that the isotropic lipids adopt a different headgroup conformation from the lamellar lipids, suggesting peptide perturbation. The isotropic shift difference is not caused by membrane curvature, because a peptide-free DMPC small vesicle sample showed a −1.0 ppm isotropic shift (Fig. 2 b), identical to the isotropic shift of the lamellar lipids.
Figure 2.
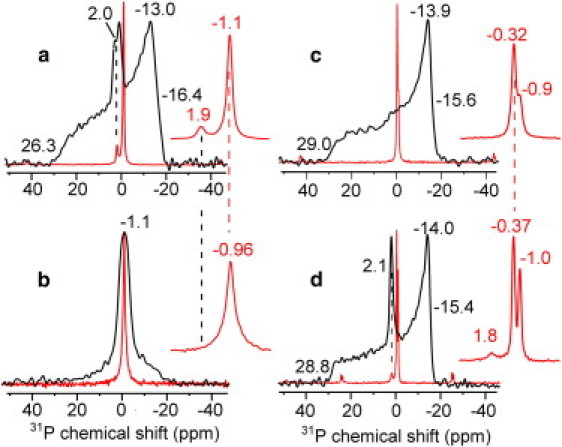
Static (black) and MAS (red) 31P spectra of lipid membranes without and with M2. Inset expands the MAS spectra. (a) M2(21–61)-DMPC membranes at 303 K. (b) DMPC isotropic vesicles at 298 K. (c) M2TM-VM membranes at 303 K. (d) M2(21–61)-VM membrane at 303 K. An isotropic peak at about +2 ppm is observed in a and d.
For the M2TM-VM sample free of the isotropic phase (Fig. 2 c), 31P isotropic shifts of −0.90 and −0.32 ppm are observed that can be attributed to lamellar 1,2-dipalmitoyl-sn-glycero-3-phosphocholine, 1,2-dipalmitoyl-sn-glycero-3-phosphoethanolamine, and SM lipids. In comparison, the M2(21–61)-VM sample has an additional isotropic peak at +1.8 ppm (Fig. 2 d), in good agreement with the +2.1 ppm isotropic peak in the static spectrum. Thus, for both DMPC and VM membranes, the high-curvature phase caused by M2(21–61) exhibit 31P isotropic shifts that are 2–3 ppm larger than the isotropic shift of the lamellar lipids.
31P and 13C detected 1H T2 relaxation
The resolution of the 31P isotropic shifts between the high-curvature domain and the lamellar domain allows us to use high-sensitivity MAS experiments to determine M2 partitioning. The peptide-enriched domain should exhibit similar 1H relaxation properties between peptide 13C detection and lipid 31P detection. The peptide-rich domain has stronger 1H-1H dipolar couplings and thus should exhibit faster 1H T2 decay than the lipid-rich domain. Lipid dynamic differences between the two domains should cause further relaxation differences (see below). In the experiment, no 1H homonuclear decoupling is applied during the spin-echo period (Fig. S1 a), to maximize the relaxation difference between the more rigid, peptide-rich, domain, and the more mobile, peptide-poor, domain. A moderate spin diffusion time is applied to equilibrate the 1H magnetization within each domain.
Fig. 3 compares the 31P and 13C-detected 1H T2 relaxation decays for three membrane samples. The M2(21–61)-DMPC sample (Fig. 3 a) has both isotropic and lamellar phases. The 1H T2 decay detected from the −1.1 ppm lamellar 31P signal is slower than the decay of the isotropic lipid peak at +1.9 ppm: at an echo delay of 4 ms, the lamellar signal decayed to 66% while the isotropic signal decayed to 31%. The peptide 13C-detected 1H T2 relaxation superimposes almost completely with the T2 decay of the high-curvature lipid domain. Thus, M2(21–61) partitions preferentially into the high-curvature phase, experiencing the same 1H dynamics as the isotropic lipids. All 1H T2 decays are double exponential, with decay constants of 0.3 and 14 ms (15% and 85%) for the lamellar lipids and 0.12 and 6 ms (40% and 60%) for the isotropic lipids (Table S2). The initial fast decay is most likely due to the rigid peptide protons. The faster relaxation of the isotropic lipids is a result of both a higher percentage of the initial decay and the shorter relaxation time of the slow component. The 13C-detected curves gave 1H T2 values of 0.2 and 6.1 ms, in quantitative agreement with the isotropic lipid data. The T2 values are largely independent of the spin diffusion mixing time between 25 and 225 ms (Table S2), indicating that at 25 ms, the 1H T2-values already report the average property of the lipids, protein, and water at equilibrium.
Figure 3.
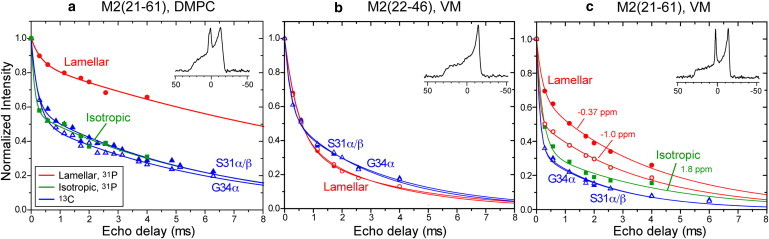
31P- and 13C-detected 1H T2 relaxation of M2-containing membranes at 298 K under 7 kHz MAS. Red: 31P-detected 1H T2 decay of lamellar lipids. Green: 31P-detected 1H T2 decay of isotropic lipids. Blue: 13C-detected 1H T2 decay of the peptide. Solid triangles: S31 Cα/Cβ. Open triangles: G34 Cα. (a) M2(21–61)-DMPC membranes with 1H spin diffusion times of 25 ms for 31P and 49 ms for 13C. (b) M2(22–46)-VM membranes. Solid circles: −0.37 ppm lamellar 31P peak. Open circles: −1.0 ppm lamellar 31P peak. 1H spin diffusion mixing times: 100 ms for 31P and 25 ms for 13C. (c) M2(21–61)-VM membranes with a 25 ms 1H spin diffusion mixing time.
Fig. 3 b shows the 1H T2 decays of the M2TM-VM membrane, which does not exhibit an isotropic phase and the peptide must therefore bind entirely to the lamellar phase. The 13C-detected 1H T2 decays exhibit time constants of 0.2 ms (45%) and 3 ms (55%), similar to the 13C data of the M2(21–61)-DMPC sample. However, the two lamellar 31P signals now decay much faster than the lamellar signal in the M2(21–61)-DMPC sample: the decay constants are 0.45 ms (60%) and 3.5 ms (40%). Thus, the 13C and 31P-detected 1H T2 decays are similar in this purely lamellar membrane, verifying the ability of this indirectly detected 1H T2 experiment to report the dynamic environment of the protein and lipids. The two 31P isotropic peaks of this mixed membrane have the same 1H T2 decays, confirming that 1H T2 relaxation is influenced by curvature-dependent lipid motion rather than by the chemical structure of the lipid headgroup.
Fig. 3 c shows the 1H T2 relaxation of the M2(21–61)-VM sample. The 31P MAS spectrum resolves two lamellar peaks at −0.37 and −1.0 ppm and an isotropic-lipid peak at +1.8 ppm (Fig. 2 d). Similar to the DMPC sample, the lamellar lipids show slower T2 relaxation than the isotropic lipids. The 13C-detected T2 relaxation is even faster than that of the isotropic lipids, indicating that M2(21–61) preferentially binds to the high-curvature membrane domain.
To examine the effect of the peptide on the 31P-detected 1H relaxation of the lipids, we compared the T2 decays of membranes without and with M2 (Fig. 4). For the DMPC membrane, peptide-free isotropic lipids have similar relaxation as peptide-bound isotropic lipids (Fig. 4 a). In comparison, peptide-free lamellar lipids have slower T2 decay than peptide-containing lamellar lipids, indicating that the presence of M2 in the lamellar phase speeds up relaxation due to the rigid protons. The VM membrane shows the same trend: the lamellar lipids have longer T2 relaxation times in the absence of M2 than in its presence (Fig. 4, b and c).
Figure 4.
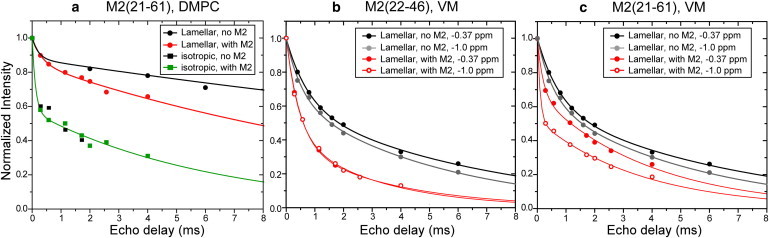
31P-detected 1H T2 relaxation decays without (black) and with (red and green) M2 at 298 K. (a) DMPC bilayers with and without M2(21–61). (b) VM membranes with and without M2(22–46). (c) VM membranes with and without M2(21–61).
1H-31P and 1H-13C HETCOR
The indirectly detected 1H T2 relaxation experiment probes the location of the peptide by comparing the dynamic environment of the lipids and the peptide. To determine peptide-lipid contact directly, we measured 2D 1H-31P and 1H-13C HETCOR spectra. We look for 31P crosspeaks with peptide amide protons, which resonate in the 5–10 ppm range, well separated from the lipid and water 1H signals. Fig. 5, a and b, shows the 2D 1H-13C HETCOR spectra of M2(21–61) in DMPC bilayers without and with 1H spin diffusion. Cα crosspeaks with HN at ∼8 ppm are observed even without spin diffusion and are enhanced with a 200 μs 1H spin diffusion period (Fig. 5, d and e). In the 1H-31P HETCOR spectrum, the same HN chemical shift shows a crosspeak with the high-curvature lipid signal (+1.9 ppm) but not with the lamellar signal (−1.1 ppm) (Fig. 5, c, f, and g), even though the latter is five times higher than the isotropic peak. This proves unambiguously that M2(21–61) preferentially binds the high-curvature membrane domain.
Figure 5.
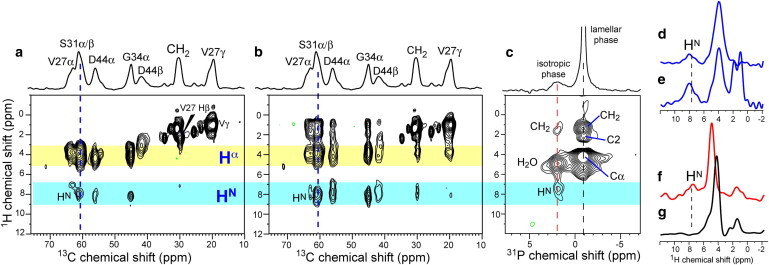
1H-13C and 1H-31P 2D HETCOR spectra of M2(21−61)-DMPC membranes. (a) 1H-13C HETCOR spectrum without 1H spin diffusion. The S31 Cα/Cβ1H cross section is shown in d. (b) 1H-13C HETCOR spectrum with 200 μs 1H spin diffusion. The S31 cross section is shown in e. (c) 1H-31P HETCOR spectrum with 250 μs 1H spin diffusion and 3 ms Lee-Goldburg cross-polarization. The 1H cross sections at +1.9 ppm and −1.1 ppm are shown in f and g, respectively. All spectra were measured at 297 K with 1H homonuclear decoupling under 7.5 kHz MAS.
In the VM membrane, M2(21–61) also shows an HN crosspeak with the isotropic lipid (Fig. S2). However, the sphingosine backbone of SM also contains an amide proton, which gives rise to an HN-P crosspeak even in the absence of the peptide. Thus, the HN crosspeak with the +1.8 ppm 31P signal cannot be definitively assigned to M2, unless SM can be ascertained to be excluded from the isotropic domain.
Discussion
Electron and fluorescence microscopy data showed that M2 plays important roles in influenza virus filament formation, virus budding, and release (8,10,42). The common underlying mechanism for these functions is the ability of the protein to cause membrane curvature, which occurs in a cholesterol-dependent manner (8). However, molecular details of this curvature induction and M2-cholesterol interaction are still scarce. The current 31P, 1H, and 13C NMR data, detecting membrane morphology and peptide-lipid interactions on the 1–50 nm length scale, provide useful insight into the relationship between M2 structure and membrane curvature generation. The static 31P NMR lineshapes show unequivocally that M2(21–61) causes an isotropic phase while M2(22–46) does not, and the curvature is higher for the cholesterol-rich VM membrane than for the DMPC membrane. The isotropic phase can in principle be small vesicles, cubic phases, or even micelles, and EM or x-ray diffraction experiments would be required to determine the morphology definitively. However, a large body of literature on cholesterol-containing membranes suggests that the cubic phase is much less likely than small vesicles under our experimental conditions. Cubic phases in phosphocholine and cholesterol-containing membranes are mostly found for polyunsaturated lipids (39,40) under very high hydration and temperature (∼60°C above the phase transition temperature), whereas our VM membranes contain saturated lipids at ∼40% hydration and experiments were conducted at moderate temperatures of 297–303 K. Cubic phases are usually observed in association with the inverse hexagonal phase (40), which is absent in our samples (43). Various cationic membrane peptides incur cubic phases when the membrane contains a high level of negative-curvature phosphatidylethanolamine lipids (6,7), but the VM membrane contains equimolar phosphatidylethanolamine and phosphatidylcholine lipids. Therefore, the high-curvature phase caused by M2(21–61) most likely corresponds to small isotropic vesicles or isotropic domains in the lamellar phase. These isotropic lipids are not completely separated from the lamellar lipids, because 2D 31P-31P correlation spectra show crosspeaks between the lamellar and isotropic peaks within 50 ms (Fig. S4). A partial association of the isotropic phase with the lamellar phase is consistent with EM images showing M2-containing small vesicles budding off of large unilamellar vesicles (8). A similar example of protein-induced membrane budding is reported for the myelin basic protein, which also causes an isotropic peak in the 31P NMR spectra, and whose cryoelectron microscopy images show small daughter vesicles pinching off of large parent vesicles (44).
Whereas the 31P spectra reveal the presence of an isotropic phase, 1H T2 relaxation and HETCOR experiments show that M2(21–61) is preferentially bound to the high-curvature domain. The 1H T2 relaxation rates are influenced by both the membrane curvature and the presence of rigid protein protons. In the lamellar domain, the main lipid motions are trans-gauche isomerization and uniaxial diffusion. Both motions significantly average the 1H-1H dipolar couplings under MAS (45), making it inefficient for driving T2 relaxation. As a result lamellar lipids show relatively slow 1H T2 relaxation under MAS. In the isotropic phase, an additional reorientational motion, lateral diffusion over the surface of the isotropic domain, is present. This motion has a much longer rotational correlation time (τL). Based on a lateral diffusion coefficient DL of 3–10 × 10−8 cm2/s, which spans the values reported for a wide range of membrane compositions (46–49), τL= r2/6 DL is 2–6 μs for a vesicle diameter of ∼10 nm. Such microsecond motion is much more efficient in driving T2 relaxation, thus causing faster T2 decays even in the absence of the peptide (Fig. 4 a). In addition to the lipid dynamic difference, the rigidity of the peptide also speeds up 1H T2 relaxation and likely accounts for the fast initial decay in the M2-containing samples. Indeed, peptide-free control membranes show a much smaller fraction of the initial decay (Fig. 4).
Curvature induction and peptide partitioning are coupled, as they should, because M2(21–61) cannot continue to create the high-curvature lipid phase while remaining in the lamellar phase without depleting the latter completely. 31P spectral integration (Figs. 1 and 2) indicates that the isotropic domain accounts for 10–20% of the total lipids. Because the peptide/lipid mass ratio in the samples is ∼1:2, if we assume a conservative upper limit of 20% for lamellar-phase M2 that is undetected by our experiments, then the peptide should represent at least 67 wt% of the isotropic domain, which suggests that each M2(21–61) tetramer would be solvated by ∼14 lipid molecules. This high peptide density should significantly perturb lipid packing, thus explaining the 3-ppm 31P isotropic shift difference between the isotropic and the lamellar lipids.
Assuming that the isotropic domain corresponds to small vesicles, we can estimate the vesicle size or radius of curvature using the static 31P linewidths. The higher the curvature, the narrower the isotropic peak. 31P spectral simulation as a function of vesicle diameter has been reported where motional narrowing by both vesicle tumbling and lipid lateral diffusion was considered (14). We modify that analysis to exclude vesicle tumbling due to the moderate hydration of our samples, and consider only lateral diffusion. Using a DL range of 3–10 × 10−8 cm2/s to span the literature values for both protein-containing and protein-free membranes of varying viscosity, we find a mean diameter of ∼26 nm for the isotropic DMPC vesicles, which has a 6-ppm linewidth for the isotropic peak, and a diameter of ∼10 nm for the VM vesicles, which have a 2.2-ppm linewidth (see the Supporting Material). Future experiments using dynamic light scattering and electron microscopy will be useful to verify these size estimates.
Fig. 6 depicts the different curvatures of the three types of M2-containing membranes. Isolated vesicles are assumed in these models, but the trend also applies to intralamellar isotropic domains. M2TM causes no or little curvature to DMPC and VM membranes (Fig. 6 a), both of which support drug binding based on previous peptide-drug distance measurements and 2D correlation spectra (33,50). Thus, formation of drug-sensitive tetrameric TM channels requires low membrane curvature. In contrast, M2(21–61) causes strong curvature to the VM membrane (Fig. 6 b), in which it does not bind drug at all (32), and moderate curvature to the DMPC membrane (Fig. 6 c), in which it partially binds drug. The estimated 10 nm diameter for the isotropic VM vesicles is about the minimum size of small unilamellar vesicles (51,52) before entering the realm of ultrasmall unilamellar vesicles (5–10 nm diameter) and micelles, whereas the 26-nm DMPC isotropic vesicle would correspond to two bilayers separated by a water layer. These results suggest that the high curvature of the small vesicles perturb the TM helix packing, thus abolishing drug binding. In the smallest unilamellar vesicles, the amphipathic helix (53) likely resides on the outer surface, with the N-terminus of the TM domain facing the vesicle interior, which should further reduce drug binding (Fig. 6 b).
Figure 6.
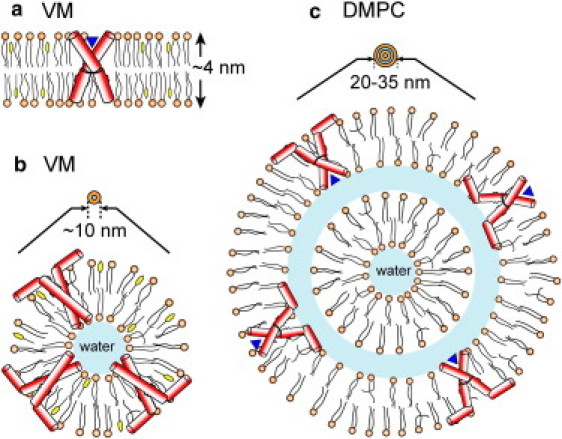
Models of the effects of M2 peptides on membrane curvature. (a) M2TM does not cause curvature to the VM membrane and adopts a conformation competent to bind drug (blue triangle) in the lamellar bilayer. (b) M2(21–61) causes strong curvature to the VM membrane and binds the resulting small unilamellar vesicles, in which it adopts a conformation incompetent to bind drug. (c) M2(21–61) causes moderate curvature to DMPC bilayers, and the TM helix conformation is partially able to bind drug.
The strong correlation between high membrane curvature and weak drug binding also suggests the reason for the absence of pore-bound drug in the 1,2-dihexanoyl-sn-glycero-3-phosphocholine-micelle solubilized M2(18–60) (31). The aggregation number of 1,2-dihexanoyl-sn-glycero-3-phosphocholine is 84, which gives a micelle diameter that is about twofold smaller than the 10-nm isotropic VM vesicles. In this highly curved micelle, the conformation of the TM pore should be even more perturbed than in small bilayer vesicles, thus preventing drug binding.
The curvature of the VM membrane is caused by the combined action of the amphipathic helix and cholesterol: the removal of either, by using DMPC lipids or by using M2TM, moderates or suppresses the curvature. Wild-type M2 has been shown to bind cholesterol (10,54), possibly between residues 47 and 55 of the amphipathic helix. In real virus envelopes and host plasma membranes, where the lipid distribution is spatially heterogeneous and temporally dynamic and where other viral proteins exist, M2 is thought to cluster at the boundary between the raft and nonraft domains in the former but associated with the nonraft domain in the latter (8,54). Either environment has lower cholesterol levels, thus the membrane curvature should be more moderate than observed here in the synthetic lipid mixtures, which would shift the protein conformation equilibrium toward the drug-bound state.
Acknowledgments
We thank Professor Schmidt-Rohr for useful discussions.
This work was supported by National Institutes of Health grant GM088204.
Supporting Material
References
- 1.Han X., Bushweller J.H., Tamm L.K. Membrane structure and fusion-triggering conformational change of the fusion domain from influenza hemagglutinin. Nat. Struct. Biol. 2001;8:715–720. doi: 10.1038/90434. [DOI] [PubMed] [Google Scholar]
- 2.Harrison S.C. Viral membrane fusion. Nat. Struct. Mol. Biol. 2008;15:690–698. doi: 10.1038/nsmb.1456. [DOI] [PMC free article] [PubMed] [Google Scholar]
- 3.Yin H.S., Wen X., Jardetzky T.S. Structure of the parainfluenza virus 5 F protein in its metastable, prefusion conformation. Nature. 2006;439:38–44. doi: 10.1038/nature04322. [DOI] [PMC free article] [PubMed] [Google Scholar]
- 4.Tang M., Hong M. Structure and mechanism of beta-hairpin antimicrobial peptides in lipid bilayers from solid-state NMR spectroscopy. Mol. Biosyst. 2009;5:317–322. doi: 10.1039/b820398a. [DOI] [PMC free article] [PubMed] [Google Scholar]
- 5.Hong M., Su Y. Structure and dynamics of cationic membrane peptides and proteins: insights from solid-state NMR. Protein Sci. 2011;20:641–655. doi: 10.1002/pro.600. [DOI] [PMC free article] [PubMed] [Google Scholar]
- 6.Schmidt N.W., Mishra A., Wong G.C. Criterion for amino acid composition of defensins and antimicrobial peptides based on geometry of membrane destabilization. J. Am. Chem. Soc. 2011;133:6720–6727. doi: 10.1021/ja200079a. [DOI] [PMC free article] [PubMed] [Google Scholar]
- 7.Schmidt N., Mishra A., Wong G.C. Arginine-rich cell-penetrating peptides. FEBS Lett. 2010;584:1806–1813. doi: 10.1016/j.febslet.2009.11.046. [DOI] [PubMed] [Google Scholar]
- 8.Rossman J.S., Jing X., Lamb R.A. Influenza virus M2 protein mediates ESCRT-independent membrane scission. Cell. 2010;142:902–913. doi: 10.1016/j.cell.2010.08.029. [DOI] [PMC free article] [PubMed] [Google Scholar]
- 9.Mishra A., Gordon V.D., Wong G.C. HIV TAT forms pores in membranes by inducing saddle-splay curvature: potential role of bidentate hydrogen bonding. Angew. Chem. Int. Ed. Engl. 2008;47:2986–2989. doi: 10.1002/anie.200704444. [DOI] [PubMed] [Google Scholar]
- 10.Rossman J.S., Jing X., Lamb R.A. Influenza virus m2 ion channel protein is necessary for filamentous virion formation. J. Virol. 2010;84:5078–5088. doi: 10.1128/JVI.00119-10. [DOI] [PMC free article] [PubMed] [Google Scholar]
- 11.Gidalevitz D., Ishitsuka Y., Lee K.Y. Interaction of antimicrobial peptide protegrin with biomembranes. Proc. Natl. Acad. Sci. USA. 2003;100:6302–6307. doi: 10.1073/pnas.0934731100. [DOI] [PMC free article] [PubMed] [Google Scholar]
- 12.Hong M. Structure, topology, and dynamics of membrane peptides and proteins from solid-state NMR spectroscopy. J. Phys. Chem. B. 2007;111:10340–10351. doi: 10.1021/jp073652j. [DOI] [PubMed] [Google Scholar]
- 13.Smith I.C.P., Ekiel I.H. 31P NMR of phospholipids in membranes. In: Gorenstein I.C., editor. Phosphorus-31 NMR: Principles and Applications. Academic Press; New York: 1984. pp. 447–475. [Google Scholar]
- 14.Traikia M., Warschawski D.E., Devaux P.F. Formation of unilamellar vesicles by repetitive freeze-thaw cycles: characterization by electron microscopy and 31P NMR. Eur. Biophys. J. 2000;29:184–195. doi: 10.1007/s002490000077. [DOI] [PubMed] [Google Scholar]
- 15.Thayer A.M., Kohler S.J. Phosphorus-31 nuclear magnetic resonance spectra characteristic of hexagonal and isotropic phospholipid phases generated from phosphatidylethanolamine in the bilayer phase. Biochemistry. 1981;20:6831–6834. doi: 10.1021/bi00527a014. [DOI] [PubMed] [Google Scholar]
- 16.Mani R., Buffy J.J., Hong M. Solid-state NMR investigation of the selective disruption of lipid membranes by protegrin-1. Biochemistry. 2004;20:13839–13848. doi: 10.1021/bi048650t. [DOI] [PubMed] [Google Scholar]
- 17.Yamaguchi S., Hong T., Hong M. Solid-state NMR investigations of peptide-lipid interaction and orientation of a beta-sheet antimicrobial peptide, protegrin. Biochemistry. 2002;41:9852–9862. doi: 10.1021/bi0257991. [DOI] [PubMed] [Google Scholar]
- 18.Hallock K.J., Lee D.K., Ramamoorthy A. MSI-78, an analogue of the magainin antimicrobial peptides, disrupts lipid bilayer structure via positive curvature strain. Biophys. J. 2003;84:3052–3060. doi: 10.1016/S0006-3495(03)70031-9. [DOI] [PMC free article] [PubMed] [Google Scholar]
- 19.Wi S., Kim C. Pore structure, thinning effect, and lateral diffusive dynamics of oriented lipid membranes interacting with antimicrobial peptide protegrin-1:31P and 2H solid-state NMR study. J. Phys. Chem. B. 2008;112:11402–11414. doi: 10.1021/jp801825k. [DOI] [PubMed] [Google Scholar]
- 20.Gabrys C.M., Yang R., Weliky D.P. Nuclear magnetic resonance evidence for retention of a lamellar membrane phase with curvature in the presence of large quantities of the HIV fusion peptide. Biochim. Biophys. Acta. 2010;1798:194–201. doi: 10.1016/j.bbamem.2009.07.007. [DOI] [PMC free article] [PubMed] [Google Scholar]
- 21.van Duyl B.Y., Meeldijk H., Killian J.A. A synergistic effect between cholesterol and tryptophan-flanked transmembrane helices modulates membrane curvature. Biochemistry. 2005;44:4526–4532. doi: 10.1021/bi047937n. [DOI] [PubMed] [Google Scholar]
- 22.Afonin S., Frey A., Ulrich A.S. The cell-penetrating peptide TAT(48-60) induces a non-lamellar phase in DMPC membranes. Chem. Phys. Chem. 2006;7:2134–2142. doi: 10.1002/cphc.200600306. [DOI] [PubMed] [Google Scholar]
- 23.Cross T.A., Sharma M., Zhou H.X. Influence of solubilizing environments on membrane protein structures. Trends Biochem. Sci. 2011;36:117–125. doi: 10.1016/j.tibs.2010.07.005. [DOI] [PMC free article] [PubMed] [Google Scholar]
- 24.Cady S.D., Luo W.B., Hong M. Structure and function of the influenza A M2 proton channel. Biochemistry. 2009;48:7356–7364. doi: 10.1021/bi9008837. [DOI] [PMC free article] [PubMed] [Google Scholar]
- 25.Pinto L.H., Lamb R.A. The M2 proton channels of influenza A and B viruses. J. Biol. Chem. 2006;281:8997–9000. doi: 10.1074/jbc.R500020200. [DOI] [PubMed] [Google Scholar]
- 26.Pinto L.H., Holsinger L.J., Lamb R.A. Influenza virus M2 protein has ion channel activity. Cell. 1992;69:517–528. doi: 10.1016/0092-8674(92)90452-i. [DOI] [PubMed] [Google Scholar]
- 27.Jing X., Ma C., Lamb R.A. Functional studies indicate amantadine binds to the pore of the influenza A virus M2 proton-selective ion channel. Proc. Natl. Acad. Sci. USA. 2008;105:10967–10972. doi: 10.1073/pnas.0804958105. [DOI] [PMC free article] [PubMed] [Google Scholar]
- 28.Ohigashi Y., Ma C., Lamb R.A. An amantadine-sensitive chimeric BM2 ion channel of influenza B virus has implications for the mechanism of drug inhibition. Proc. Natl. Acad. Sci. USA. 2009;106:18775–18779. doi: 10.1073/pnas.0910584106. [DOI] [PMC free article] [PubMed] [Google Scholar]
- 29.Wang C., Takeuchi K., Lamb R.A. Ion channel activity of influenza A virus M2 protein: characterization of the amantadine block. J. Virol. 1993;67:5585–5594. doi: 10.1128/jvi.67.9.5585-5594.1993. [DOI] [PMC free article] [PubMed] [Google Scholar]
- 30.Stouffer A.L., Acharya R., DeGrado W.F. Structural basis for the function and inhibition of an influenza virus proton channel. Nature. 2008;451:596–599. doi: 10.1038/nature06528. [DOI] [PMC free article] [PubMed] [Google Scholar]
- 31.Schnell J.R., Chou J.J. Structure and mechanism of the M2 proton channel of influenza A virus. Nature. 2008;451:591–595. doi: 10.1038/nature06531. [DOI] [PMC free article] [PubMed] [Google Scholar]
- 32.Cady S.D., Wang T., Hong M. Membrane-dependent effects of a cytoplasmic helix on the structure and drug binding of the influenza virus M2 protein. J. Am. Chem. Soc. 2011;133:11572–11579. doi: 10.1021/ja202051n. [DOI] [PMC free article] [PubMed] [Google Scholar]
- 33.Cady S.D., Schmidt-Rohr K., Hong M. Structure of the amantadine binding site of influenza M2 proton channels in lipid bilayers. Nature. 2010;463:689–692. doi: 10.1038/nature08722. [DOI] [PMC free article] [PubMed] [Google Scholar]
- 34.Cady S.D., Mishanina T.V., Hong M. Structure of amantadine-bound M2 transmembrane peptide of influenza A in lipid bilayers from magic-angle-spinning solid-state NMR: the role of Ser31 in amantadine binding. J. Mol. Biol. 2009;385:1127–1141. doi: 10.1016/j.jmb.2008.11.022. [DOI] [PMC free article] [PubMed] [Google Scholar]
- 35.Bielecki A., Kolbert A.C., Levitt M.H. Frequency-switched pulse sequences: homonuclear decoupling and dilute spin NMR in solids. Chem. Phys. Lett. 1989;155:341–346. [Google Scholar]
- 36.Li S., Su Y., Hong M. Water-protein interactions of an arginine-rich membrane peptide in lipid bilayers investigated by solid-state nuclear magnetic resonance spectroscopy. J. Phys. Chem. B. 2010;114:4063–4069. doi: 10.1021/jp912283r. [DOI] [PMC free article] [PubMed] [Google Scholar]
- 37.Villalaín J. Location of cholesterol in model membranes by magic-angle-sample-spinning NMR. Eur. J. Biochem. 1996;241:586–593. doi: 10.1111/j.1432-1033.1996.00586.x. [DOI] [PubMed] [Google Scholar]
- 38.Chen Z., Rand R.P. The influence of cholesterol on phospholipid membrane curvature and bending elasticity. Biophys. J. 1997;73:267–276. doi: 10.1016/S0006-3495(97)78067-6. [DOI] [PMC free article] [PubMed] [Google Scholar]
- 39.Epand R.M., Hughes D.W., Wachtel E. Novel properties of cholesterol-dioleoylphosphatidylcholine mixtures. Biochim. Biophys. Acta. 2003;1616:196–208. doi: 10.1016/j.bbamem.2003.08.006. [DOI] [PubMed] [Google Scholar]
- 40.Tenchov B.G., MacDonald R.C., Siegel D.P. Cubic phases in phosphatidylcholine-cholesterol mixtures: cholesterol as membrane “fusogen”. Biophys. J. 2006;91:2508–2516. doi: 10.1529/biophysj.106.083766. [DOI] [PMC free article] [PubMed] [Google Scholar]
- 41.Li C., Yi M., Cross T.A. Solid-state NMR and MD simulations of the antiviral drug amantadine solubilized in DMPC bilayers. Biophys. J. 2008;94:1295–1302. doi: 10.1529/biophysj.107.112482. [DOI] [PMC free article] [PubMed] [Google Scholar]
- 42.Chen B.J., Leser G.P., Lamb R.A. The influenza virus M2 protein cytoplasmic tail interacts with the M1 protein and influences virus assembly at the site of virus budding. J. Virol. 2008;82:10059–10070. doi: 10.1128/JVI.01184-08. [DOI] [PMC free article] [PubMed] [Google Scholar]
- 43.Luo W., Cady S.D., Hong M. Immobilization of the influenza A M2 transmembrane peptide in virus envelope-mimetic lipid membranes: a solid-state NMR investigation. Biochemistry. 2009;48:6361–6368. doi: 10.1021/bi900716s. [DOI] [PMC free article] [PubMed] [Google Scholar]
- 44.Nezil F.A., Bayerl S., Bloom M. Temperature-reversible eruptions of vesicles in model membranes studied by NMR. Biophys. J. 1992;61:1413–1426. doi: 10.1016/S0006-3495(92)81947-1. [DOI] [PMC free article] [PubMed] [Google Scholar]
- 45.Rothwell W.P., Waugh J.S. Transverse relaxation of dipolar coupled spin systems under rf irradiation: detecting motions in solids. J. Chem. Phys. 1981;74:2721–2732. [Google Scholar]
- 46.Frey S., Tamm L.K. Membrane insertion and lateral diffusion of fluorescence-labelled cytochrome c oxidase subunit IV signal peptide in charged and uncharged phospholipid bilayers. Biochem. J. 1990;272:713–719. doi: 10.1042/bj2720713. [DOI] [PMC free article] [PubMed] [Google Scholar]
- 47.Köchy T., Bayerl T.M. Lateral diffusion coefficients of phospholipids in spherical bilayers on a solid support measured by 2H-nuclear-magnetic-resonance relaxation. Phys. Rev. E. 1993;47:2109–2116. doi: 10.1103/physreve.47.2109. [DOI] [PubMed] [Google Scholar]
- 48.Lindblom G., Orädd G., Morein S. Regulation of lipid composition in Acholeplasma laidlawii and Escherichia coli membranes: NMR studies of lipid lateral diffusion at different growth temperatures. Biochemistry. 2002;41:11512–11515. doi: 10.1021/bi0263098. [DOI] [PubMed] [Google Scholar]
- 49.Vaz W.L., Clegg R.M., Hallmann D. Translational diffusion of lipids in liquid crystalline phase phosphatidylcholine multibilayers. A comparison of experiment with theory. Biochemistry. 1985;24:781–786. doi: 10.1021/bi00324a037. [DOI] [PubMed] [Google Scholar]
- 50.Cady S.D., Wang J., Hong M. Specific binding of adamantane drugs and direction of their polar amines in the pore of the influenza M2 transmembrane domain in lipid bilayers and dodecylphosphocholine micelles determined by NMR spectroscopy. J. Am. Chem. Soc. 2011;133:4274–4284. doi: 10.1021/ja102581n. [DOI] [PMC free article] [PubMed] [Google Scholar]
- 51.Segota S., Tezak D. Spontaneous formation of vesicles. Adv. Colloid Interface Sci. 2006;121:51–75. doi: 10.1016/j.cis.2006.01.002. [DOI] [PubMed] [Google Scholar]
- 52.Yue B., Huang C.Y., Katsaras J. Highly stable phospholipid unilamellar vesicles from spontaneous vesiculation: a DLS and SANS study. J. Phys. Chem. B. 2005;109:609–616. doi: 10.1021/jp047510q. [DOI] [PubMed] [Google Scholar]
- 53.Sharma M., Yi M., Cross T.A. Insight into the mechanism of the influenza A proton channel from a structure in a lipid bilayer. Science. 2010;330:509–512. doi: 10.1126/science.1191750. [DOI] [PMC free article] [PubMed] [Google Scholar]
- 54.Schroeder C., Heider H., Lin T.I. The influenza virus ion channel and maturation cofactor M2 is a cholesterol-binding protein. Eur. Biophys. J. 2005;34:52–66. doi: 10.1007/s00249-004-0424-1. [DOI] [PubMed] [Google Scholar]
Associated Data
This section collects any data citations, data availability statements, or supplementary materials included in this article.