

Abstract
Intracellular transport is a complex interplay of ballistic transport along filaments and of diffusive motion, reliably delivering material and allowing for cell differentiation, migration, and proliferation. The diffusive regime, including subdiffusive, Brownian, and superdiffusive motion, is of particular interest for inferring information about the dynamics of the cytoskeleton morphology during intracellular transport. The influence of dynamic cytoskeletal states on intracellular transport are investigated in Dictyostelium discoideum cells by single particle tracking of fluorescent nanoparticles, to relate quantitative motion parameters and intracellular processes before and after cytoskeletal disruption. A local mean-square displacement (MSD) analysis separates ballistic motion phases, which we exclude here, from diffusive nanoparticle motion. In this study, we focus on intracellular subdiffusion and elucidate lag-time dependence, with particular focus on the impact of cytoskeleton compartments like microtubules and actin filaments. This method proves useful for binary motion state distributions. Experimental results are compared to simulations of a data-driven Langevin model with finite velocity correlations that captures essential statistical features of the local MSD algorithm. Specifically, the values of the mean MSD exponent and effective diffusion coefficients can be traced back to negative correlations of the motion's increments. We clearly identify both microtubules and actin filaments as the cause for intracellular subdiffusion and show that actin-microtubule cross talk exerts viscosifying effects at timescales larger than 0.2 s. Our findings might give insights into material transport and information exchange in living cells, which might facilitate gaining control over cell functions.
Introduction
Energy-driven dynamics and network-like organization of the cytoskeleton, with cross-linkers and molecular motors, affect intracellular transport, which is of particular interest for theoretical physics, biochemistry, and pathophysiology. A malfunctioning transport system might lead to molecular motor deficiencies in neurodegenerative diseases such as amyotrophic lateral sclerosis (1–3) or Huntington's disease (4). These medical applications motivate a detailed investigation of the underlying processes.
Cellular cytoskeleton components interact to establish multiple functions, including migration (5), division (6,7), deformation (8), and intracellular transport (9,10). In addition, molecular motors of the dynein, kinesin, and myosin families lead to different transport regimes involving directed ballistic motion, in contrast to random subdiffusion (11,12). Although molecular motors and their role in ballistic motion are a major scientific focus, the intricacies of nonballistic motion for relating structures with cell function also remain unclear (13). Subdiffusion is characterized by mean-square displacements (MSDs) obeying a power law at exponents <1 (MSD ∼tα, α < 1) (14). The hindering or confining origins of subdiffusion can be manifold (15,16), including trapping cages, obstruction barriers, crowding, or stalling.
Caged dynamics is the favored model for nanoscale displacements of beads in the living cell cytoskeleton. Directional persistence versus antipersistence of tracer particle motion, characterized by motion angle variations, depends on the investigated timescales (17), yielding antipersistence at small timescales and persistence at larger timescales. Collisions with the cage boundaries generate motion reversal and antipersistence of the direction of motion. Cage-hopping brings about persistent motion on timescales larger than the typical cage exploration time (17). Furthermore, cellular transport behavior in these models depends on the presence of cytoskeleton components (18–20), most notably microtubules (MT), actin filaments (F-actin), and intermediate filaments. The motion type is generally quantified by the nondimensional MSD exponent α, ranging from subdiffusion to ballistic motion. Caspi et al. (9) have observed anomalous subdiffusion using live cell single particle tracking and MSD analysis: Transient α values of 1.5 and 0.75 indicate partly superdiffusive and subdiffusive modes, respectively. Experiments with both externally driven and spontaneous motion of tracer particles anchored to the cytoskeleton lead to another conclusion. A model of soft glassy behavior features both cages and crowding effects: Inspired by typical soft glasses, such as crowded colloidal suspensions (15,16), an analogous interpretation of the cell cytoplasm has been introduced (21). This model is based on scaling laws of the rheological moduli (22), which cannot be interpreted by simple viscoelasticity. Instead, they indicate a continuous distribution of relaxation time constants (23). Characteristics of soft glasses involve disorder and metastability in weakly attractive energy landscapes. The volume of the cage does not affect the degree of subdiffusion (the MSD exponent), but the effective diffusion coefficient. In addition, active intracellular driving forces enhance nonthermal behavior, leading to an increase in diffusion coefficient (24).
In this work, we investigate anomalous subdiffusion phases of intracellular transport in detail, with a particular emphasis on the involved cytoskeleton components and the various timescales on which they act. Our experimental model system, the cytoskeleton in Dictyostelium discoideum cells is composed of MTs and F-actin. Intermediate filaments are absent. Benomyl and Latrunculin A are used as depolymerization agents of MT and F-actin, respectively. To study their influence on subdiffusion, we employ a local MSD algorithm to separate out phases of active transport along filaments and focus on phases of subdiffusion.
In terms of a theoretical description, pure diffusion in a highly viscous medium without active contributions is governed by overdamped Brownian motion corresponding to a simple Langevin equation. Even in this simple situation, the local MSD algorithm at a particular time instant does not yield uniquely determined values of exponent and diffusion coefficient but values that scatter around the expected mean values with characteristic distributions. This is the case because the MSD algorithm at a particular instant in time uses only a small sample of data (otherwise it would not be local in time anymore). It is instructive to compare distributions obtained from simulations of a Langevin equation to those obtained from intracellular particle trajectories. Although the two kinds of distributions are qualitatively similar, we will discuss important differences and we present a simple data-driven extension of the classical Langevin model, which describes the motility of the tracer particle within the living cell under various conditions. In this approach, the common white (uncorrelated) Gaussian noise of the standard overdamped Langevin equation is replaced by a colored (correlated) Gaussian noise accounting for finite temporal correlations of the particle's velocity. The correlation function of this noise (velocity) is taken from the experimental data measured under the respective conditions in living cells. Our results indicate that important aspects of the statistics resulting from the local MSD algorithm (distributions of exponent and diffusion coefficient; their mean values as a function of the MSD algorithm's timescale) can be understood solely based on such a Gaussian model with finite velocity correlations.
We will present results and their implications on intracellular transport in three consecutive steps: First, the transport parameters are introduced for regular diffusion in glycerol and motion in living cells. These parameters are then studied for different cytoskeleton states for depolymerized MT and/or F-actin. Finally, this cytoskeleton analysis is extended to include lag time-dependent effects of MT and F-actin on subdiffusion.
Materials and Methods
Cell culture
D. discoideum cells of the AX2 wild-type (WT) strain (25), provided by the Max-Planck-Institut für Biochemie (Martinsried, Germany), are maintained at 21°C on tissue culture dishes in AX2 medium. Cells are kept in the exponential growth phase and below 50% confluence by addition of fresh nutrient medium every 48 h. To verify cytoskeleton depolymerization agent effects, cells of the LimEΔcc-GFP (26) and α-Tub-GFP (provided by the Max-Planck-Institute for Biochemistry) strains are used. Gentamycin and Blasticidin antibiotics are added for preservation of the mutation. Before experiments, AX2 medium is replaced by nonfluorescent medium, lacking yeast extract and peptone.
Nanoparticles
Nanoscreen MAG-D nanoparticles (ChemiCell, Germany) of 150 nm diameter are added to the cell suspension at a final concentration of 18.25 nM. Before uptake, nanoparticles (NPs) are agitated by vortexing for 10 s and by supersonication for 5 min. The sterile, green-fluorescent magnetic NPs consist of a superparamagnetic iron oxide core (Fe2O3), surrounded by a lipophilic green-fluorescent dye, with excitation wavelength 476 nm and an emission maximum at 490 nm. The dye is surrounded by a hydrophilic outer polymer matrix of polysaccharide starch (C6H10O5). NP uptake is performed by slow centrifugation at 3000 rpm in a Heraeus Biofuge Pico centrifuge in four subsequent legs of 3, 4, 4, and 5 min duration, respectively, each followed by gentle agitation and 5 min at rest to prevent undue stress on the cells. Directly after the final centrifugation, supernatant medium is replaced by nonfluorescent medium. Excess NPs are removed.
Cytoskeleton depolymerization agents
A Benomyl (C14H18N4O3, Sigma-Aldrich, Germany) solution in phosphate buffered saline is added 30 min before MT depolymerization measurements to the NP-cell suspension at a concentration of 100 μM. A diluted Latrunculin A (C22H31NO5S, Invitrogen, Germany) solution in phosphate buffered saline is added 20 min before F-actin depolymerization measurements to the NP-cell suspension at a concentration of 10 μM.
Microscopy
The sample chamber consists of a 24 mm × 40 mm glass coverslip and an 18 mm × 18 mm teflon enclosure and is mounted on an Axiovert 135 TV microscope (Zeiss, Germany) equipped with an EC-Plan Neofluar 100×/1.3NA oil-immersion objective (Zeiss) and an Orca C4880-80 charge-coupled device camera (Hamamatsu, Germany) with a sampling and exposure time of 49 ms per frame of size 384 × 384 pixels, where one pixel corresponds to 0.064 μm × 0.064 μm. The fluorescence intensity distribution is fitted by a two-dimensional Gaussian to determine the particle's position at subpixel resolution using the OpenBox (27) software, version 1.9.
Statistics of the trajectory's increments
We analyze the trajectory in terms of the increments in x and y between consecutive frames (time steps) and . We estimate probability densities of these increments by standard methods and also calculate their correlation coefficient, e.g., the one for increments in x:
| (1) |
where indicates the average that is taken over the index i. We also measure the correlations of the increments in y and those between the increments in x and y. The serial correlation coefficient in Eq. 1 is a measure for the randomization of subsequent steps: vanishing autocorrelation indicates complete independence, whereas unit autocorrelation indicates unchanged increment values from one frame to the next. A negative increment correlation indicates antipersistent behavior and results in a reduced randomness on longer timescales because in the sum of the increments, i.e., in the particle's trajectory, anticorrelated terms partially cancel. This reduced long-term variability may become manifest by an apparent subdiffusive behavior on timescales over which the increment correlations extend.
To estimate the error bar of the correlation coefficient, we use the following equation for the variance of the correlation coefficient (28):
| (2) |
where n is the total number of increments and ν is the maximal lag taken into account, which we set to . The error bar for one measurement is then the square root of the variance.
Local MSD algorithm
The algorithm
A conventional method of analyzing intracellular transport is based on the MSD:
| (3) |
Local MSD analysis has been introduced previously (29), yielding time-resolved motion type information: For each point along the recorded trajectory a local MSD is computed, considering only the neighboring 60 trajectory points. This local MSD is then fitted by a power law (linear regression in a double-logarithmic MSD plot)
| (4) |
yielding the same characteristics as the global MSD, but in a local, time-resolved manner and with additional noise because of the smaller sample. Here is a reference time and A has dimensions of the square of a length. The exponent α is a dimensionless number between 0 and 2, indicating different types of motion: α < 1 being subdiffusive, α ≈ 1 Brownian-like, α > 1 superdiffusive and α ≈ 2 ballistic. The prefactor contains an effective diffusion coefficient (see below) or in the case of ballistic motion the velocity. This analysis and fit are repeated for each point along the trajectory resulting in time series for the parameters α and A. In this work, we study long phases of nonballistic transport (typically subdiffusive behavior) in terms of the statistical distributions of the exponent α and the effective diffusion coefficient D, which is proportional to the parameter A.
Parameter settings
The timescale at which the sample is probed depends on the frame rate and the window size. The window size determines the number of points taken into account for the computation of the local MSD, but does not equal the lag time range over which the power law is fitted to the data. For large lag times of τ ≈ Mw × Δt, only a few MSD data points exist within each window, and the statistics risk to be unreliable. Therefore, the fit data range is chosen to be 0 < τ < 1/4 × Mw × Δt. Thus, the timescale probed by the local MSD is of the order 1/4 × Mw × Δt. We have chosen the values to be Mw = 60 and Δt = 49 ms, which corresponds to 15 MSD points and a probing at 0.735 s. Experimental and simulational data of bead motion in glycerol were collected at Δt = 55 ms and analyzed accordingly at Mw = 60. For the analysis of mean motion parameters as functions of lag time, the window size was varied from Mw = 8 frames to Mw = 200 frames in 4-frame steps, including the 60-frame window as a special case. The 4-frame increases in window size and the MSD fit data range of 1/4 × Mw × Δt amount to a lag time resolution of 49 ms. The power law fit yields reliable results for all investigated window sizes, which was checked using the chi-square measure, which equals χ2 = 0.013 (Mw = 60) and χ2 = 0.05 (Mw = 200).
For Brownian diffusion, the MSD scales linearly with time: and the prefactor A determines the diffusion coefficient: A = 2d D (d is the number of spatial dimensions), which corresponds to D = 〈ΔR2〉/(2dτ). For MSD power laws with other exponents, α ≠ 1, an effective diffusion coefficient (with proper dimension μm2/s) is directly proportional to the prefactor A if we choose the reference time as the time lag, i.e., for we obtain D = A/(2d )—otherwise the diffusion coefficient will depend explicitly on α. This definition permits a volume-explored interpretation of this effective diffusion coefficient, for a characteristic volume measure can be obtained from projecting the two-dimensional MSD into the third dimension.
Models
Langevin models of intracellular motion
The standard overdamped Brownian motion in a viscous medium is described by the Langevin equation:
| (5) |
with D being the spatial diffusion coefficient; is a white Gaussian noise that models the velocity. A numerical simulation of this model at time step Δt is realized by the simple map:
| (6) |
The numbers are independent Gaussian numbers with zero mean and variance . The differences in the trajectory between adjacent time instances, i.e., the increments are thus statistically independent and, in particular, uncorrelated. We used the previous scheme to simulate the tracer particle's diffusion in glycerol.
In this work, we also consider a generalization of the previous equation, in which we replace the white (uncorrelated) Gaussian velocity noise by a colored (correlated) Gaussian velocity noise. We will work exclusively with a discretized version of the Langevin equation and also use a linear map, an autoregressive process (AR) for the generation of the colored noise:
| (7) |
Noise sources in x and y can be correlated but are always uncorrelated in time, i.e., . Note that for (for all k) and , the model reduces to the simple Brownian motion in Eq. 6.
For each data set, we determine the coefficients of the AR process from (see, e.g. (30).)
| (8) |
Here, and give the r.h.s. by and
| (9) |
Once the coefficients have been found from solving Eq. 8, the variances and covariance of the noise sources can be calculated from
| (10) |
To sum up, if we know the covariance, the variances, and the correlation coefficients of the increments in x and y up to lag K, we can determine an AR model, that has Gaussian increments and the same linear correlations as the data. For simulation of all intracellular data, we used Eq. 7 with K = 100 (dimension of the AR process). The large set of correlations coefficients K = 100 is only needed to reproduce correctly the long-term behavior (see Fig. 5) for the mean values as a function of maximum lag time.
Figure 5.
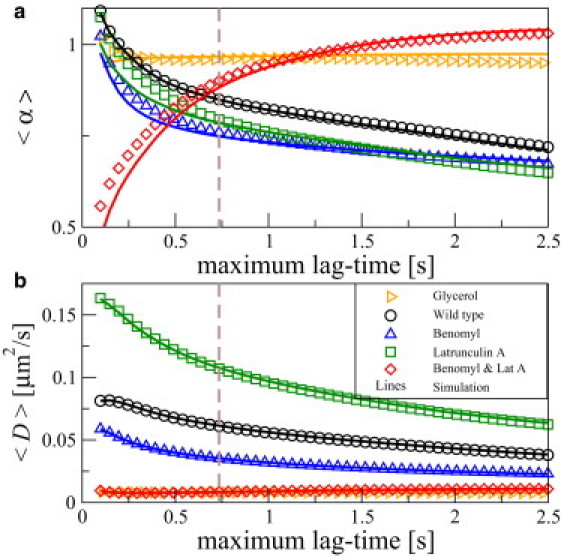
Lag-time dependence of the local MSD exponent (a) and the mean effective diffusion coefficient (b) in various cytoskeleton states: WT cells (experiments as black circles, simulations as black line), Benomyl-assisted MT depolymerization (exp: blue triangles, sim: blue line), Latrunculin A-assisted F-actin depolymerization (green squares, green line), simultaneous MT and F-actin depolymerization (red diamonds, red line), and as reference NP diffusion in glycerol (yellow triangles, yellow line) for both experimental data (symbols) and simulations (solid lines). Data shown in Fig. 4a correspond to a lag time of 0.735 s (vertical dashed line).
Results and Discussion
Our study of the cytoskeletal influence on intracellular subdiffusion draws on the combination of experimental NP trajectories and simulations thereof, which are analyzed using a local MSD algorithm (29). We observe internalized NPs inside living cells using fluorescence microscopy. Frame-by-frame tracking yields NP trajectories, which are evaluated by a local MSD analysis, as laid out in the Methods section and depicted schematically in Fig. 1. Local MSD transport variables are studied in various D. discoideum cytoskeleton environments, including partial or complete depolymerization. In this work, we select diffusive motion states exclusively, disregarding active intracellular transport phases, mediated by motor-driven filament attachment. This distinction is performed by the local MSD analysis (29). In this study, we use only the subdiffusive motion phases to compare the impact of different cytoskeleton depolymerization states for finite size experimental tracks.
Figure 1.
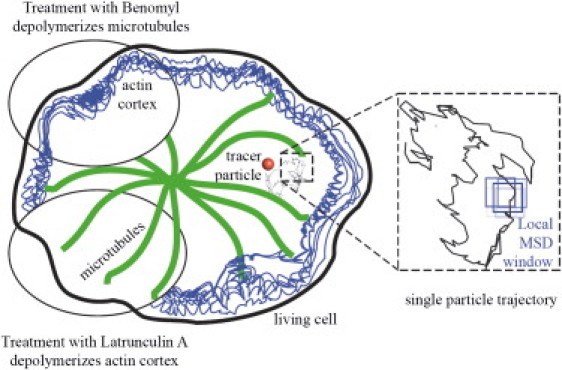
Tracking of single NPs, transported in living D. discoideum cells, yields this type of trajectories. Cytoskeleton depolymerization agents, namely Benomyl and Latrunculin A, are used to discern the influence of particular cytoskeleton constituents, MT and F-actin, on the intracellular transport. Trajectories are analyzed using a local MSD algorithm shifting a rolling window across the NP trajectories.
Increment statistics
We first compare the motion of fluorescent NPs in glycerol and in living WT cells' cytoplasm. This exemplifies the analysis method, highlights the differences between Brownian motion and intracellular motility, and yields insight into the importance of increment statistics. Increment statistics consist of a size distribution and their temporal autocorrelation function, which are shown in Fig. 2, a and b, for trajectories in glycerol and in WT cells' cytoplasm, respectively. Gaussian fits to the experimental data are also shown.
Figure 2.
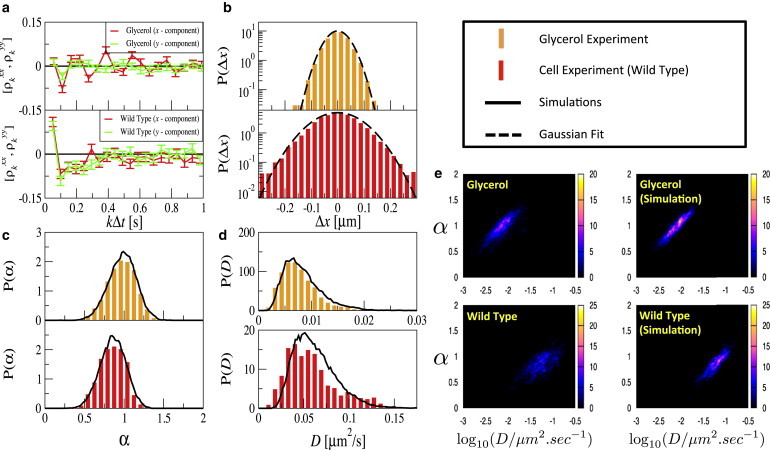
Comparison of NP motion in glycerol and WT D. discoideum cells. (a) The autocorrelation of frame-to-frame increments fluctuates around zero for the glycerol data (upper panel) but shows statistically significant negative correlations for the intracellular data (lower panel). Using the autocorrelation function and the increment's variance, an autoregressive process for the increments with the same correlation statistics can be simulated; increments for this simulated process are distributed according to a Gaussian. (b) The size distribution of frame-to-frame increments can be approximated by Gaussian distributions (lines show fits to the data), with slight deviations at large increment values. (c) Distributions of local mean-square exponent values α and (d) effective diffusion coefficients D (middle panels) for glycerol (upper panel) and the WT cell (lower panel); experimental data (histograms) and simulations (solid lines). (e) Joint distributions of mean-square exponent α and diffusion coefficient D for glycerol (upper panel) and WT cell (lower panel); experimental data (left) and simulations (right).
Increment correlations are mostly close to zero for diffusion in glycerol, as expected from the simple Langevin equation (cf. in Fig. 2 a). However, due to time-dependent drifts in the z direction and limitations in the tracking algorithm, we sometimes observed small-scale oscillations at the first few lags (cf. in Fig. 2 a) or variability of the correlation coefficient at lag one (not shown); this drift effect in the z direction is not as pronounced in cell data. Correlations at higher lags were, however, consistently close to zero. Therefore, we regard only correlations at higher lags as significant. Correlations for NP motion in the WT cells are negative over the first 50–100 lags (except for lag one) corresponding to a timescale of the velocity fluctuations of seconds. The latter result resembles recent experimental findings for the velocity correlations of chromosomal loci and RNA-protein particles in bacteria (31). As outlined previously, negative correlations of the increments are indicative of elastic restoring forces, which are naturally linked to subdiffusion and will lower the mean of the exponent α on small timescales. Trajectories are simulated using the white-noise model Eq. of the Methods section for the NP motion in glycerol and the correlated velocity model Eq. 7 for NP motion in WT cells. The resulting distributions of the local exponent α and the local diffusion coefficient D are compared to those obtained directly from the experimental trajectories. The good agreement of these α (Fig. 2 c) and D (Fig. 2 d) statistics of the experimental and simulated trajectories show, that simple Langevin-based models might be sufficient to explain important features of intracellular subdiffusion, if the autocorrelation of increments is taken into account.
Apart from the marginal distributions of α and D, it is also instructive to consider their joint distribution (Fig. 2 e). For all data (intracellular or glycerol, experiment or simulation), there is a clear positive correlation between the values of α and D. This is a nontrivial consequence of the way in which α and D are determined by the power law fit, which is performed by linear regression in a double-logarithmic plot of data that are subject to a finite sample noise. This noise is positively correlated along the MSD curve. In other words, if the finite-size average estimate of the MSD overestimates the true MSD, for instance, at time , it will be most likely also overestimated at a later time, e.g., at . The positive correlation, in turn, causes a positive correlation of the estimates of slope (yielding the exponent α) and intercept with the log[MSD]-axis (yielding the diffusion coefficient). (Even if the finite-sample noise would be uncorrelated and equal in intensity for each data pair , the estimates of α and D would be positively correlated, although weaker than in the case of positively correlated MSD fluctuations.)
In all cases, probability is distributed along and around a line in the α-D plane, the position and slope of which agrees fairly well for experimental and simulation data. For the glycerol data in Fig. 2 e, also the width of the distribution is in good agreement for experiment and simulation. For the WT data, however, there is a significant difference between model simulations and experimental results: the experimental data exhibit a broader distribution around the aforementioned line. This difference is found for all intracellular data (see Fig. 4 c). The larger width of the experimental distribution may be caused by inhomogeneities within the cytoplasm, not incorporated in our model, such as the weak non-Gaussian statistics of the increments or higher-order correlations (the autoregressive process Eq. 7 reproduces only the second-order statistics). However, we expect slight experimental errors for the glycerol and WT cell experiments.
Figure 4.
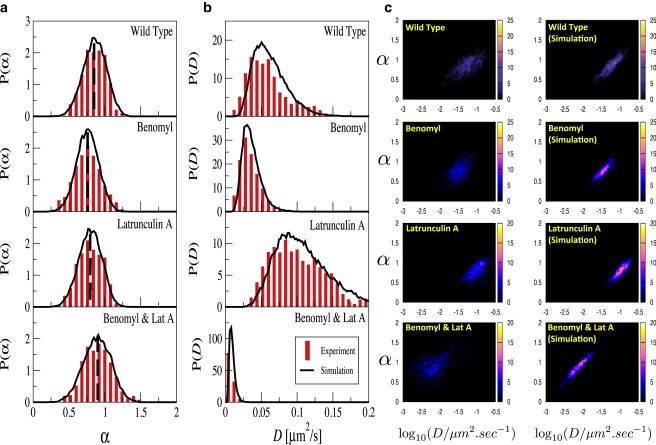
Distributions of α (a), of D (b), and their joint distribution (c) in various cytoskeleton states: WT cells (top row), Benomyl-assisted MT depolymerization (second row), Latrunculin A-assisted F-actin depolymerization (third row), and simultaneous MT and F-actin depolymerization (bottom row) for both experimental data (red bars) and simulations (black lines). In a mean values of α are indicated by vertical dashed lines.
Subdiffusive phenomena after cytoskeleton depolymerization
We extend increment statistics based on the analysis of WT cells to modified cytoskeleton states. D. discoideum cells show the rare capacity to survive despite cytoskeleton depolymerization. The four investigated cytoskeleton states are WT cytoskeleton, depolymerized MT (Benomyl), depolymerized F-actin (Latrunculin A), and simultaneous depolymerization of MT and F-actin (Benomyl and Lat A). Fig. 3 shows the autocorrelation of increments for these four different cytoskeleton states. The former three conditions, characterized by the presence of at least one of the cytoskeleton constituents, show very similar behavior: the increment autocorrelation function is consistently negative at higher time differences. The case of simultaneous depolymerization of both cytoskeleton constituents displays significantly different increment statistics with positive autocorrelation at higher time differences. These findings indicate a fundamental difference between partial and complete cytoskeleton depolymerization, but do not yield direct insight into the consequences on intracellular transport. In addition, increment distributions show in some cases deviations from the fitted Gaussians at large arguments, which can be interpreted as an indication for a nonequilibrium dynamics at work in the cell.
Figure 3.

Increment correlation coefficient in x (a) and histograms of increments in x (b) in three different cytoskeleton states: WT cells (black lines without error bars) as reference, Benomyl-assisted MT depolymerization (first row), Latrunculin A-assisted F-actin depolymerization (second row), and simultaneous MT and F-actin depolymerization (third row). Correlations and histograms were similar for all cases when measured for the increments of y instead of x.
We applied the local MSD analysis algorithm to both, experimental trajectories and simulations using experimental increment statistics. Indeed, the four cases can be well differentiated by their local α and D distributions, as depicted in Fig. 4. Experimental and simulated distributions again show good agreement. The α distributions in Fig. 4 a show various degrees of subdiffusion, quantified by the mean value of the MSD exponent . The experimental mean values for are 0.85 (WT), 0.76 (Benomyl), 0.79 (Latrunculin A), and 0.90 (Benomyl and Latrunculin A). Furthermore, the mean diffusion coefficient shows characteristic behavior for each cytoskeleton state: In total absence of both MT and F-actin, the mean diffusion coefficient equals 0.86 × 10⁻² μm2/s. In contrast, presence of at least one cytoskeleton constituent leads to enhanced diffusion coefficients, with mean values of amounting to 6.10 × 10⁻² μm2/s (WT), 3.53 × 10⁻² μm2/s (Benomyl), and 10.7 × 10⁻² μm2/s (Latrunculin A), as shown in Fig. 4 b.
The joint α-D distributions are shown in Fig. 4 c. As already discussed for the WT data in Fig. 2 e, the widths of the joint distributions are larger in the experiment than in the simulational data, in particular in the case of complete cytoskeleton depolymerization by application of both Benomyl and Latrunculin A. Thus, the increase in the width of the joint distribution can be attributed to an effect, which is not mediated by F-actin or MT. The large spread of the experimental P(α,D) is not accounted for in our model and may be resolved by further intracellular transport studies whose scope extends beyond the influence of the cytoskeletal main players.
Microtubule and F-actin depolymerization
After removal of MT and F-actin, we observe a Brownian-like diffusion characterized by α ≈ 1 and a low D, contrary to enhanced subdiffusion in WT cells, characterized by α < 1 and a high D. In the absence of both, MT sweeping motion and actin cortex rearrangement, no other active cytoskeleton components, driven for example by ATP-consuming molecular motor cross-links, are capable of inducing active behavior or specific forces due to the polymerization of actin or MTs. This result is a strong indicator for the importance of the enhancing effect of actively driven cytoskeleton components on subdiffusion (24). D. discoideum cells survive instantaneous depolymerization of the actin cortex and of MT, as depolymerization of cytoskeleton components in the living cell can never be complete. Small amounts of F-actin and little MT-stumps persist in the cell, enabling the bare survival of the cell by contributing little to active processes. It is thus in concordance with our model with velocity correlations to assume a nonequilibrium system, even in the case of simultaneous MT and F-actin depolymerization.
Microtubule depolymerization
Selective removal of MTs alters cell behavior: ballistic transport via biomotors is impossible (32). However, this effect is filtered from our subdiffusive motion data by analysis with the local MSD algorithm. In the context of subdiffusion, the MT sweeping causes long range effects for the NPs: Active MT sweeping motion renders the cytoplasm more fluid-like and viscous, its absence thus more solid-like. We expect a decrease in spatial extent of the volume probed by the particle. As the effective diffusion constant is directly calculated from local MSD values, it gives an estimate of the volume probed per unit time and our experimental results do show a slight decrease in D in the absence of MTs.
F-actin depolymerization
F-actin mediates migration, so F-Actin-depleted cells show accompanying effects, such as rounding up and immotility, in addition to changes in intracellular transport. We find that depolymerization of F-actin causes a slight drop in α with respect to WT cells, a sign of enhanced elastic properties of the cytoplasm and lack of actin pushing forces. As in the case of MT depletion, this more elastic-like behavior can be attributed to the absence of myosin II motors along actin filaments and actin polymerization dynamics. Second, we find increasing values, which is a sign of a larger volume probed by the tracer particle, in the absence of a densely packed actin network. These seemingly contradictory observations result from the absence of myosin-actin activity.
The closely cross-linked actin cortex undergoes active rearrangements, driven for example by ATP-consuming actomyosin (33). Entangled actin networks, which were reconstituted in vitro, were probed by bead microrheology (34). It was found that viscosity is prevalent at high frequencies, down to 1 Hz, which corresponds to a probing on the 1 s timescale. The scaling of the viscoelastic moduli as ω3/4 yields a MSD exponent of α = 3/4 at these timescales, similar to values observed experimentally for tracer particles (35). At larger times, the elastic properties prevail and the MSD exponent α experiences a drop down to ∼0.32. These data, both in vitro (34) and in living cells, as reported in this work, support the hypothesis of a viscosifying effect of F-actin at timescales smaller than or comparable to 1 s. The exact crossover time depends on filament length (34) and probe size (36). It seems plausible that it also depends on motor presence and ATP concentration, which must be kept in mind when comparing quantitative in vitro and in vivo data.
Lag-time dependence
Up to now, effects of cytoskeleton disruption were investigated at one specific maximal lag time of 0.735 s. We now investigate the lag-time dependence and, in particular, the lag time-dependent α and D statistics by varying the window size from Mw = 8 frames to Mw = 200 frames, always keeping the MSD fit data range at 1/4 × Mw points. This corresponds to a range of the maximal lag times from 0.098 to 2.45 s. The results of these experiments and simulations are shown in Fig. 5, again for the previously studied four cytoskeleton states: WT, MT depolymerization, F-actin depolymerization, and simultaneous depolymerization of MT and F-actin. The α statistics show good agreement between experimental and simulation results at all maximal lag times (Fig. 5 a); for comparison, we show the mean alpha for NP diffusion in glycerol, which remains close to one for all lag times. The cytoskeleton states with only one depolymerized component display qualitatively similar behavior to WT, whereas the case of simultaneous depolymerization of both components is qualitatively different. Here, we find a smaller degree of subdiffusion. This is indicated by larger mean α values at maximal lag times >0.6 s. The respective diffusion coefficients are smaller (Fig. 5 b). At lag times larger than ∼1 s, the mean diffusion coefficients approach plateau values, with actin-depleted cells exceeding WT and MT-depleted cells' plateau values. Overall, the strong variations of the mean alpha versus maximal lag time is another indication that intracellular motility is far more complicated than simple Brownian motion (cf. for the glycerol data, which does not vary much—even if one excludes active transport along filaments and focuses on apparently passive phases of motion. A weak variation of mean alpha versus maximal lag time can be also expected from simple Brownian motion; see our simulation results, which yield close to but slightly smaller than one. This will be studied in detail elsewhere.)
Microtubule and F-actin depolymerization
In cells of simultaneous MT and F-actin depolymerization, response is twofold: At lag times larger than 1.0 s, intracellular motion is nearly Brownian with α ≈ 1 and low diffusion coefficients, consistently below 1.1 × 10⁻² μm2/s, comparable to the glycerol data. This result stresses the active role these cytoskeleton components play in subdiffusion and highlights the importance of the cytoskeleton at these lag times. In this case, subdiffusion can be observed up to lag times of 0.8 s with diffusion constants of 7.6 × 10⁻³ μm2/s at lag times between 0.25 and 0.30 s. This is a sign of near standstill of the tracer particle motion, due to absence of MT and F-actin dynamics. However, remnants of the polymer networks persist, acting as cages on small timescales, in addition to intracellular crowding effects.
In the case of an intact WT cytoskeleton, the drop in α from diffusion to subdiffusion at ≈ 0.75 occurs over a lag time range from hundreds of ms to ∼2 s, as investigated in other cell types in (11). At lag times of tens of seconds, a return to diffusive behavior is expected to occur, which is not investigated in this context.
Microtubule depolymerization
Benomyl-treated cells show a faster transition from diffusion to subdiffusion between t = 100 ms and t = 750 ms than WT cells. The mean value of α decreases from 1 to = 0.75, as investigated in other cell types in (11). In WT cells, the latter value is approached not until a time lag of ∼2 s. For large lag times, the WT and Benomyl-treated cells show similar values, indicating a vanishing contribution of MT sweeping motion at large lag times. The effect of MT seems to be viscosifying, as indicated by consistently higher α values in the presence of MT. A possible explanation for the enhanced viscous properties is given by MT motion actively stirring the cytoplasm. The viscosifying effect is most pronounced at lag times between 0.5 and 1 s, in accordance with previous findings on MT sweeping motion, highlighting their pronounced motion and activity at lag times of ∼1 s (37).
F-actin depolymerization
Latrunculin A-treated cells show a decrease in α from ∼1 to 0.75 in the lag time range from 0.1 to 1.2 s, for shorter lag times than in the WT case and larger than in the Benomyl case. Actin-depleted cells show smaller values than WT cells. This leads us to conclude that F-actin exerts a viscosifying effect on the cytoskeleton, accounting for higher α values and apparently enhancing the motion of tracer particles, possibly by active driving forces generated by actin cortex rearrangements. At the same time, the diffusion coefficient is consistently smaller in the presence of F-actin, resulting from mostly lag time-independent hindrance of tracer particle motion, possibly in a cage-like fashion. Compared to WT cells, this might also indicate that MT motion is hindered by the presence of actin polymerization, as observed in neuronal growth cones (38).
Conclusion
We quantified the influence of MT and F-actin on subdiffusion in living cells and identified typical timescales. Our results clearly show that for a complete description of diffusive and subdiffusive motion phases in intracellular nanoscale transport, we have to consider both, the MSD exponent and the effective diffusion coefficient to understand cooperative and counterbalancing effects of MT and F-actin dynamics. We applied a local MSD analysis to distinguish ballistic from diffusive intracellular motion states, as extracted from NP traces and focused purely on subdiffusive motion states.
Our study revealed that subdiffusive dynamics can be described by a Brownian motion with correlated Gaussian velocity fluctuations. Although the real increments of intracellular motion are Gaussian only to a certain approximation and although we did not incorporate higher order or nonlinear correlations in our model, we were able to reproduce the marginal distributions of local exponent and diffusion coefficient (resulting from the local MSD analysis). Our data-driven Gaussian model helped us to understand which aspects of the parameter distributions are intrinsic to the algorithm (typically, the width of distributions, which is mainly determined by the finite-sample noise) and which are characteristic of intracellular motion (e.g., the mean value of α). We showed that reasonable approximations, i.e., assuming Gaussian increment statistics and neglecting higher-order correlations, allowed for a great simplification. Our aim was not to find a minimal model here. We want to illustrate that for a variety of cytoskeletal states, the more complicated statistics of the local MSD algorithm could be understood as a consequence of the much simpler increment statistics of the random motion, so the second-order statistics of the increments and a Gaussian assumption (the simpler statistics) to a large extent explains the more complicated statistics of the local MSD algorithm (α and D distribution), which is not used as fitting statistics. However, it is worth pointing out that our data-driven model does not give a physical description of intracellular motility. Future modeling of subdiffusive intracellular motion (e.g., in the framework of active gel theory incorporating fluctuations) can nevertheless profit from our simplification because such modeling can be limited to capture the correct linear increment correlation—a task that is certainly more readily accomplished than matching in a model a specific local MSD statistics (joint and marginal distributions of α and D).
To summarize our results on intracellular motion, we found that i), microtubule sweeping liquefies the cytoplasm on all investigated timescales, ii), actin-microtubule cross talk generates a viscosifying effect at timescales larger than 0.2 s, and iii), the F-actin-induced decrease in effective diffusion coefficients occurs at all investigated timescales (50 ms–2.5 s). It is the interplay of these effects, at these particular timescales, which mediates viable transport in living cells. These timescales are of particular interest because they correspond to the typical durations of alternating ballistic and diffusive phases. In the absence of both, MT sweeping motion and actin cortex rearrangement, intracellular motion becomes more similar to Brownian motion, which is an indicator for the major influence of dynamic cytoskeleton components on subdiffusion.
Alternations between subdiffusive and ballistic phases occur when a particle reaches close proximity to a MT. Thus, motor-driven, directed long-distance transport along MT shuttles NPs across the cell, but remains ineffective without well-defined short-range subdiffusion for the binding to targets (24). This brings about major biological implications, mostly for transport-driven cellular processes, such as migration (14): Cellular movements build upon the reliable supply of essential signaling molecules. Actin polymerization-related proteins, most notably PIP3 (phosphatidylinositol (3,4,5)-trisphosphate) accumulate at the cell membrane and lead to enhanced local actin polymerization. In consequence, cell protrusions are generated for migration. This process was shown to be controlled by spatiotemporally controlled, external chemotactic stimuli (39). A detailed understanding of the role of subdiffusion for governing complex cellular functions might promote a wide range of applications, aiming at externally controlling cell functions. This could be accomplished by means of NPs, carrying stimulus drugs, which are then inserted into living cells to controllably induce cell functions, for example directed migration.
Acknowledgments
D.H. acknowledges funding by the Deutsche Forschungsgemeinschaft (fund HE5958/2-1). Furthermore, we thank G. Gerisch (Max Planck Institute for Biochemistry in Martinsried, Germany) for the provision of the cell cultures.
Footnotes
Amitabha Nandi's present address is Department of Molecular, Cellular and Developmental Biology, Yale University, New Haven, CT.
Benjamin Lindner's present address is Bernstein Center for Computational Neuroscience, and Physics Department, Humboldt University, Berlin, Germany.
References
- 1.Sasaki S., Iwata M. Impairment of fast axonal transport in the proximal axons of anterior horn neurons in amyotrophic lateral sclerosis. Neurology. 1996;47:535–540. doi: 10.1212/wnl.47.2.535. [DOI] [PubMed] [Google Scholar]
- 2.Williamson T.L., Cleveland D.W. Slowing of axonal transport is a very early event in the toxicity of ALS-linked SOD1 mutants to motor neurons. Nat. Neurosci. 1999;2:50–56. doi: 10.1038/4553. [DOI] [PubMed] [Google Scholar]
- 3.Hafezparast M., Klocke R., Fisher E.M. Mutations in dynein link motor neuron degeneration to defects in retrograde transport. Science. 2003;300:808–812. doi: 10.1126/science.1083129. [DOI] [PubMed] [Google Scholar]
- 4.Trushina E., Dyer R.B., McMurray C.T. Mutant huntingtin impairs axonal trafficking in mammalian neurons in vivo and in vitro. Mol. Cell. Biol. 2004;24:8195–8209. doi: 10.1128/MCB.24.18.8195-8209.2004. [DOI] [PMC free article] [PubMed] [Google Scholar]
- 5.Parent C.A., Devreotes P.N. A cell's sense of direction. Science. 1999;284:765–770. doi: 10.1126/science.284.5415.765. [DOI] [PubMed] [Google Scholar]
- 6.Insall R., Müller-Taubenberger A., Gerisch G. Dynamics of the Dictyostelium Arp2/3 complex in endocytosis, cytokinesis, and chemotaxis. Cell Motil. Cytoskeleton. 2001;50:115–128. doi: 10.1002/cm.10005. [DOI] [PubMed] [Google Scholar]
- 7.Konopka C.A., Schleede J.B., Bednarek S.Y. Dynamin and cytokinesis. Traffic. 2006;7:239–247. doi: 10.1111/j.1600-0854.2006.00385.x. [DOI] [PMC free article] [PubMed] [Google Scholar]
- 8.Fletcher D.A., Mullins R.D. Cell mechanics and the cytoskeleton. Nature. 2010;463:485–492. doi: 10.1038/nature08908. [DOI] [PMC free article] [PubMed] [Google Scholar]
- 9.Caspi A., Granek R., Elbaum M. Enhanced diffusion in active intracellular transport. Phys. Rev. Lett. 2000;85:5655–5658. doi: 10.1103/PhysRevLett.85.5655. [DOI] [PubMed] [Google Scholar]
- 10.Loverdo C., Bénichou O., Voituriez R. Enhanced reaction kinetics in biological cells. Nat. Phys. 2008;4:134–137. [Google Scholar]
- 11.Caspi A., Granek R., Elbaum M. Diffusion and directed motion in cellular transport. Phys. Rev. E. 2002;66:011916–011927. doi: 10.1103/PhysRevE.66.011916. [DOI] [PubMed] [Google Scholar]
- 12.Hänggi P., Marchesoni F. Artificial Brownian motors: controlling transport on the nanoscale. Rev. Mod. Phys. 2009;81:387–442. [Google Scholar]
- 13.Trepat X., Lenormand G., Fredberg J.J. Universality in cell mechanics. Soft Matter. 2008;4:1750–1759. [Google Scholar]
- 14.Weiss M., Elsner M., Nilsson T. Anomalous subdiffusion is a measure for cytoplasmic crowding in living cells. Biophys. J. 2004;87:3518–3524. doi: 10.1529/biophysj.104.044263. [DOI] [PMC free article] [PubMed] [Google Scholar]
- 15.Kammerer A., Höfling F., Franosch T. Cluster-resolved dynamic scaling theory and universal corrections for transport on percolating systems. Europhys. Lett. 2008;84:66002. [Google Scholar]
- 16.Lenormand G., Chopin J., Butler J.P. Directional memory and caged dynamics in cytoskeletal remodelling. Biochem. Biophys. Res. Commun. 2007;360:797–801. doi: 10.1016/j.bbrc.2007.05.228. [DOI] [PMC free article] [PubMed] [Google Scholar]
- 17.Weihs D., Mason T.G., Teitell M.A. Effects of cytoskeletal disruption on transport, structure, and rheology within mammalian cells. Phys Fluids (1994) 2007;19:103102. doi: 10.1063/1.2795130. [DOI] [PMC free article] [PubMed] [Google Scholar]
- 18.Robert D., Nguyen T.-H., Wilhelm C. In vivo determination of fluctuating forces during endosome trafficking using a combination of active and passive microrheology. PLoS ONE. 2010;5:e10046. doi: 10.1371/journal.pone.0010046. [DOI] [PMC free article] [PubMed] [Google Scholar]
- 19.Weeks E.R., Weitz D.A. Subdiffusion and the cage effect studied near the colloidal glass transition. Chem. Phys. 2002;284:361–367. [Google Scholar]
- 20.Weeks E.R., Weitz D.A. Properties of cage rearrangements observed near the colloidal glass transition. Phys. Rev. Lett. 2002;89:095704. doi: 10.1103/PhysRevLett.89.095704. [DOI] [PubMed] [Google Scholar]
- 21.Bursac P., Lenormand G., Fredberg J.J. Cytoskeletal remodelling and slow dynamics in the living cell. Nat. Mater. 2005;4:557–561. doi: 10.1038/nmat1404. [DOI] [PubMed] [Google Scholar]
- 22.Fabry B., Maksym G.N., Fredberg J.J. Scaling the microrheology of living cells. Phys. Rev. Lett. 2001;87:148102. doi: 10.1103/PhysRevLett.87.148102. [DOI] [PubMed] [Google Scholar]
- 23.Alcaraz J., Buscemi L., Navajas D. Microrheology of human lung epithelial cells measured by atomic force microscopy. Biophys. J. 2003;84:2071–2079. doi: 10.1016/S0006-3495(03)75014-0. [DOI] [PMC free article] [PubMed] [Google Scholar]
- 24.Brangwynne C.P., Koenderink G.H., Weitz D.A. Intracellular transport by active diffusion. Trends Cell Biol. 2009;19:423–427. doi: 10.1016/j.tcb.2009.04.004. [DOI] [PubMed] [Google Scholar]
- 25.Fey P., Kowal A.S., Chisholm R.L. Protocols for growth and development of Dictyostelium discoideum. Nat. Protoc. 2007;2:1307–1316. doi: 10.1038/nprot.2007.178. [DOI] [PubMed] [Google Scholar]
- 26.Prassler J., Murr A., Marriott G. DdLIM is a cytoskeleton-associated protein involved in the protrusion of lamellipodia in Dictyostelium. Mol. Biol. Cell. 1998;9:545–559. doi: 10.1091/mbc.9.3.545. [DOI] [PMC free article] [PubMed] [Google Scholar]
- 27.Schilling J., Sackmann E., Bausch A.R. Digital imaging processing for biophysical applications. Rev. Sci. Instrum. 2004;75:2822–2827. [Google Scholar]
- 28.Cox, D. R., and P. A. W. Lewis. 1966. The Statistical Analysis of Series of Events. Chapman and Hall, London.
- 29.Arcizet D., Meier B., Heinrich D. Temporal analysis of active and passive transport in living cells. Phys. Rev. Lett. 2008;101:248103. doi: 10.1103/PhysRevLett.101.248103. [DOI] [PubMed] [Google Scholar]
- 30.Box, G. E. P., G. M. Jenkins, and G. C. Reinsel. 1994. Time Series Analysis: Forecasting and Control. Prentice-Hall, Upper Saddle River, NJ.
- 31.Weber S.C., Spakowitz A.J., Theriot J.A. Bacterial chromosomal loci move subdiffusively through a viscoelastic cytoplasm. Phys. Rev. Lett. 2010;104:238102. doi: 10.1103/PhysRevLett.104.238102. [DOI] [PMC free article] [PubMed] [Google Scholar]
- 32.Mahowald J., Arcizet D., Heinrich D. Impact of external stimuli and cell micro-architecture on intracellular transport states. ChemPhysChem. 2009;10:1559–1566. doi: 10.1002/cphc.200900226. [DOI] [PubMed] [Google Scholar]
- 33.Bursac P., Fabry B., An S.S. Cytoskeleton dynamics: fluctuations within the network. Biochem. Biophys. Res. Commun. 2007;355:324–330. doi: 10.1016/j.bbrc.2007.01.191. [DOI] [PMC free article] [PubMed] [Google Scholar]
- 34.Liu J., Gardel M.L., Weitz D.A. Microrheology probes length scale dependent rheology. Phys. Rev. Lett. 2006;96:118104. doi: 10.1103/PhysRevLett.96.118104. [DOI] [PubMed] [Google Scholar]
- 35.Tolić-Nørrelykke I.M., Munteanu E.L., Berg-Sørensen K. Anomalous diffusion in living yeast cells. Phys. Rev. Lett. 2004;93:078102. doi: 10.1103/PhysRevLett.93.078102. [DOI] [PubMed] [Google Scholar]
- 36.Gardel M.L., Valentine M.T., Weitz D.A. Microrheology of entangled F-actin solutions. Phys. Rev. Lett. 2003;91:158302. doi: 10.1103/PhysRevLett.91.158302. [DOI] [PubMed] [Google Scholar]
- 37.Heinrich D., Sackmann E. Active mechanical stabilization of the viscoplastic intracellular space of Dictyostelia cells by microtubule-actin crosstalk. Acta Biomater. 2006;2:619–631. doi: 10.1016/j.actbio.2006.05.014. [DOI] [PubMed] [Google Scholar]
- 38.Lowery L.A., Van Vactor D. The trip of the tip: understanding the growth cone machinery. Nat. Rev. Mol. Cell Biol. 2009;10:332–343. doi: 10.1038/nrm2679. [DOI] [PMC free article] [PubMed] [Google Scholar]
- 39.Meier B., Zielinski A., Heinrich D. Chemotactic cell trapping in controlled alternating gradient fields. Proc. Natl. Acad. Sci. USA. 2011;108:11417–11422. doi: 10.1073/pnas.1014853108. [DOI] [PMC free article] [PubMed] [Google Scholar]