

Abstract
To permit access to DNA-binding proteins involved in the control and expression of the genome, the nucleosome undergoes structural remodeling including unwrapping of nucleosomal DNA segments from the nucleosome core. Here we examine the mechanism of DNA dissociation from the nucleosome using microsecond timescale coarse-grained molecular dynamics simulations. The simulations exhibit short-lived, reversible DNA detachments from the nucleosome and long-lived DNA detachments not reversible on the timescale of the simulation. During the short-lived DNA detachments, 9 bp dissociate at one extremity of the nucleosome core and the H3 tail occupies the space freed by the detached DNA. The long-lived DNA detachments are characterized by structural rearrangements of the H3 tail including the formation of a turn-like structure at the base of the tail that sterically impedes the rewrapping of DNA on the nucleosome surface. Removal of the H3 tails causes the long-lived detachments to disappear. The physical consistency of the CG long-lived open state was verified by mapping a CG structure representative of this state back to atomic resolution and performing molecular dynamics as well as by comparing conformation-dependent free energies. Our results suggest that the H3 tail may stabilize the nucleosome in the open state during the initial stages of the nucleosome remodeling process.
Introduction
The basic unit of chromatin, the nucleosome core particle (NCP) (1), consists of 146 DNA bp wrapped in 1.75 superhelical turns around an octamer composed of two copies each of H3, H4, H2A, and H2B histone proteins. Each histone has a positively charged N-terminal tail protruding from a globular core, and histone H2A also has a C-terminal tail. Successive nucleosomes are separated by variable-length DNA linkers to form the chromatin fiber that may form higher-order structures (2). This organization represents a significant barrier for proteins accessing DNA. In most cases, the nucleosomal DNA must be released from the histone core surface to be functional. Although the access of buried DNA sites in the nucleosome can be catalyzed by various ATP-dependent remodeling factors (3), such factors may not always be needed for DNA access. Restriction enzyme accessibility assays of DNA target sites buried in the NCP suggest that the nucleosome possesses an intrinsic mechanism exposing its DNA (4). Further studies, including bulk and single molecule fluorescence energy transfer (FRET), have shown that the nucleosome exists in a dynamic equilibrium between a closed state, in which the DNA is fully wrapped, and open states in which the DNA is partially detached at the edges of the nucleosome (5–9). In agreement with these observations, cryo-electron microscopy studies show that the amount of DNA associated with the histone octamer and the entry/exit angle of the DNA are highly variable (10). All these findings are consistent with spontaneous transient unpeeling of nucleosomal DNA ends from the octamer surface, enabling access to DNA target sites in the nucleosome. This site-exposure process (11) may even render accessible large nucleosomal DNA segments involving dozens of basepairs (12–14).
Histone tails interact with DNA (15,16) and their posttranslational acetylation often correlates with gene activity (17). The tails being highly charged, it is possible that their interaction with the DNA contains an electrostatic component that would be weakened by their acetylation. FRET experiments provided evidence for nucleosomes being more open when the tails were chemically acetylated (5,18), and higher accessibility of buried DNA target sites in nucleosomes from which the histone tails were removed (19,20). In particular, deletion of the H3 tail, which is closest to the DNA entry/exit points, may facilitate nucleosome opening (21). However, the structural changes upon tail acetylation are subtle (22) and the molecular mechanism of DNA site exposure remains unclear.
Knowledge of the high-resolution NCP structure (e.g., Luger et al. (23) and Richmond and Davey (24)) has shed light on the nature of the DNA:histone interactions and enabled computational studies of the nucleosome at atomic detail. All-atom molecular dynamics (MD) simulations have examined various properties of the nucleosome on the 10–200 ns timescale, e.g., the flexibility of nucleosomal DNA (25–27), the dynamics of the histone tails (27), and the organization of mobile ions around the nucleosome (28). However, nucleosomal DNA unwrapping probably occurs on the 10–500 ms timescale (7), i.e., approximately six-orders-of-magnitude above the present timescale limit of all-atom MD. To overcome this limitation, coarse-grained (CG) models of the nucleosome have been developed during the past decade to study various aspects of the NCP, such as the energetics and kinetics of DNA dissociation from the nucleosome (29–31), histone:DNA interactions (32), salt-dependent NCP aggregation (33), and oligonucleosome condensation (34).
Here we examine the molecular mechanism of DNA unwrapping from the histone core and the influence of the histone H3 tails on this process, using our previously published CG model of the nucleosome (35). This model allows simulations on timescales beyond those of all-atom MD, while retaining the structural details necessary to describe nucleosomal DNA unwrapping. Analyzing one 10-μs-long and nine 5-μs-long CG MD trajectories, we find in almost all the simulations multiple spontaneous and reversible short-lived detachments of 9 bp of DNA from the protein core at one end of the nucleosome. Half the simulations show long-lived detachments, irreversible over the simulation timescale, in which the H3 tail is packed onto the protein core surface. The frequency, lifetime, and amplitude of short-lived DNA detachments are quantified and the contacts involved in both short- and long-lived detachments are examined. The physical consistency of the long-lived open conformation is verified by remapping a CG structure representative of this state onto an all-atom model and subjecting this model to MD simulation in explicit solvent. Also to this aim, conformation-dependent free energy calculations were performed. Particular attention is given here to the role of the H3 tail in the rewrapping of nucleosomal DNA; for this purpose, five 5-μs-long CG MD simulations of the nucleosome without the H3 tails were also performed. Our results suggest a mechanism in which the H3 tail locks the nucleosome in the open state by obstructing the rebinding of DNA to the histone core.
Methods
Model structures
The nucleosome simulated contains the eight histones with their tails and 167 bp of DNA: the 147 bp corresponding to the NCP DNA with two 10-bp DNA linkers added at each end. The choice of simulating the NCP with 10-bp DNA linkers is motivated by FRET experiments on a similar structure in which reversible dissociation events were observed (9). An H3-tailless structure was also prepared by removing residues 1–42 of the histones H3 of the model structure. The detailed description of the preparation of the structures is given in the Supporting Material.
Coarse-grained model
The coarse-grained model used here was recently developed and specifically parameterized for the nucleosome (35). It is based on a one-bead-per-residue form that was previously designed for CG simulation of the ribosome and was able to reproduce the experimental ratchetlike motion of the ribosome seen by cryo-EM (36). Here we summarize the main aspects of the model. Amino-acid residues and nucleotides are represented by single spherical beads with the mass of the bead centered on the α-carbon (Cα) for amino-acid residues and on the phosphorus (P) for the nucleotides. The force field is composed of pairwise additive harmonic and Morse terms accounting for pseudobonded interactions and nonbonded interactions respectively, as
| (1) |
with
| (2) |
and
| (3) |
In Eq. 2, pseudobonded interactions are the interactions between a bead i and, respectively, its first, second, third, and fourth nearest neighbor in the DNA or protein chain. For these interactions, the force constants k1–2,3,4,5 and the equilibrium distances r01–2,3,4,5 depend only on the type of the bead pair, P–P or Cα–Cα, and on its connectivity. Interactions between complementary DNA bases are also described with a harmonic potential where kbp is the corresponding elastic constant and r0bp the equilibrium distance between two bases. The equilibrium distances r01–2,3,4,5 and r0bp were taken from the radial distribution function of the interbead distances computed from all-atom MD data (35).
Nonbonded pairs, i.e., pairs that are not pseudobonded, are described with Morse functions of ri,i+n (Eq. 3), where α is the width of the potential, r0i,i+n is the equilibrium distance, and De(r0i,i+n) is the energy of dissociation. Short-range nonbonded pairs, i.e., nonbonded pairs that are close in space and for which the equilibrium distance is <14.7 Å for Cα–P pairs, <9.0 Å for Cα–Cα pairs, and <24.0 Å for P–P pairs, each have a specific r0i,i+n (and hence a specific energy profile) that is taken either from the all-atom MD data or the minimized NCP structure (35). This implies that the CG force field emphasizes local interactions in the initial structure for short-range nonbonded pairs, accounting implicitly for the complexity and specificity of the local interactions (sequence dependence, polarizability, size and shape effects) in a simple and efficient manner (36–38).
In contrast to the short-range nonbonded interactions, long-range nonbonded interactions, i.e., interactions for which r0i,i+n is beyond the cutoff, permit large structural rearrangements and are all described with the same generic potential in which r0i,i+n represents the sum of the van der Waals radii of the beads, equal to 16.1 Å for Cα–P pairs, 10.0 Å for Cα–Cα pairs, and 26.0 Å for P–P pairs. Consequently, beads that are far away in the starting structure can approach up to a distance determined by the repulsive part of the long-range nonbonded Morse potential.
The force-field parameters were obtained by fitting to Boltzmann-inverted radial distribution functions (39), derived from a reference 5-ns all-atom MD trajectory of the NCP (1KX5 structure) in explicit solvent (35) and then iteratively refined to obtain a match between the all-atom MD and CG MD root mean-square fluctuations over 5 ns.
In summary, the purpose of our CG model is to explore the conformational transitions occurring in the nucleosome around the equilibrium state. The formation of new contacts between initially remote parts of the nucleosome is possible only within a certain range of distances (see Results) and thus structural rearrangements involving the formation of very close contacts, like, e.g., the rebinding of nucleosomal DNA to another place of the histone core, are not allowed.
The CG model, initially designed for the study of the NCP, needed extending to model the DNA linkers that are described in the Supporting Material.
Langevin dynamics
A series of 10 CG MD simulations of the nucleosome was conducted using the force field described above. Simulation 1 is the 10-μs-long reference simulation, and was performed using the energy-minimized model structure of the nucleosome as the starting configuration. For simulations 2–5, each trajectory was generated using a different starting configuration selected from simulation 1, i.e., those with the highest and the lowest distance between the center of mass (CM) of the protein core and the CM of the SH-6.5 DNA segment for simulations 2 and 3 and those with the highest and the lowest radii of gyration for simulations 4 and 5. Simulations 6–10 were all performed using the same starting configuration as in simulation 1, but each using a different random seed.
The simulations were carried out with the DL_POLY package (40). Each simulation consisted of a 5-μs production (10 μs for simulation 1) preceded by a 5-ns equilibration phase at 300 K. A 20-fs timestep was applied and instantaneous configurations were saved every 1 ps. The solvent was modeled using a Langevin bath with a collision frequency γ equal to 2 ps–1. The value of γ that reproduces the damping of water on a heavy atom at the surface of a protein, estimated to 50–60 ps–1 (41,42), overdamps the system and it is recommended for implicit and coarse-grained stochastic simulations to use smaller value, such as 2 ps–1, so as to permit greater configurational sampling (38,43,44). However, the use of small γ speeds up the dynamics of the system relative to atomistic MD in explicit water or experiment, a consequence that has to be taken into account in the analysis of the kinetic properties of the system (44).
A series of five simulations of the H3-tailless nucleosome, simulations 10–15, was also performed using the above procedure. These simulations were started from the same configuration, i.e., the energy-minimized structure of the nucleosome without the H3 tails, but with different velocity seeds.
All-atom molecular dynamics, mapping, and free energy calculations
Energy minimization and MD simulations were performed on an all-atom representation of the model structure. The minimization and MD setup are described in the Supporting Material.
The CG structure representative of the long-lived open state (see Results) was mapped on an all-atom model by steering the all-atom nucleosome model structure toward the CG structure. To do this, a relaxed configuration of the closed-state nucleosome after 1 ns of all-atom MD was subjected to energy minimization followed by high-temperature Langevin dynamics in which all P and Cα atoms were harmonically restrained to their corresponding positions in the long-lived CG structure with a force constant of 1 kcal/mol/A2. To help resolve the strains in deforming the structures, the histones and the DNA were initially treated separately in vacuum. Distance restraints taken from the NOE data set of CHARMM were applied between the donor and acceptor of the hydrogen bonds of the DNA basepairs. The minimization consisted of 2000 steps of conjugate gradient and, for the DNA, another 2000 steps of the adopted basis Newton-Raphson algorithm. The histones and DNA were then subjected to, respectively, 200 ps and 500 ps of gas-phase Langevin dynamics at 1000 K. Reconstruction of the complex was performed following the same energy minimization scheme, 20 ps of high-temperature Langevin dynamics, and a final 2000 steps of adopted basis Newton-Raphson energy minimization. The root mean-square deviation (RMSD) between the CG structure and the remapped structure for the P and Cα atoms is 1.2 Å. The remapped structure was then prepared for a unrestrained 100-ns MD simulation in explicit solvent using the procedure described in All-Atom Molecular Dynamics in the Supporting Material involving a larger solvent box to account for the detached DNA.
To assess that the long-lived open state of the nucleosome is not an artifact of the CG force-field, conformation-dependent free energy calculations were performed using the all-atom models and the molecular mechanics Poisson-Boltzmann surface area (MM-PBSA) approach (45). The detailed methodology and results are described in MM-PBSA Calculations in the Supporting Material.
Analysis of trajectories
Visualization of the trajectories revealed detachments involving residues of the SH-6.5 DNA end, i.e., the SH-6.5 DNA segment and its corresponding DNA linker (see Results). Therefore we concentrated our analysis on the SH-6.5 DNA end and histone regions in its vicinity, i.e., the H3 αN helix and the H3 tail (Fig. 1 a).
Figure 1.
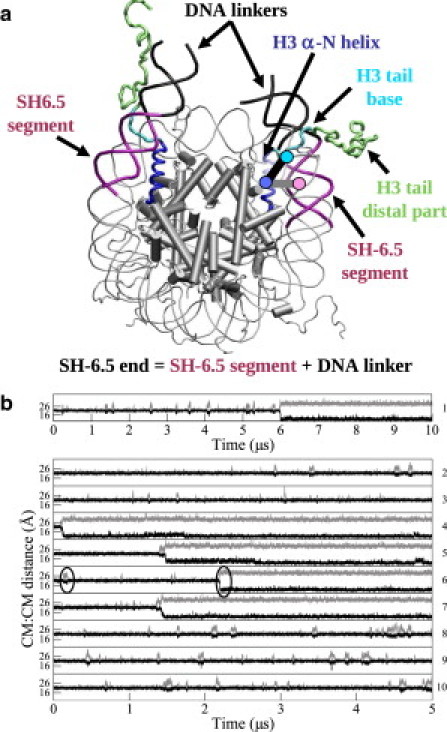
(a) Schematic representation of the nucleosome. The histones α-helices are depicted as cylinders, except the H3 αN helices, which are depicted as coils. The DNA linkers correspond to the 10 bp segments extending the SH6.5 and SH-6.5 segments. The thick gray and black lines correspond to the distances between the CM (disks) of the H3 αN helix and the SH-6.5 DNA segment and between the CM of the H3 αN helix and the H3 tail base, respectively. (b) H3 helix:SH-6.5 distance (gray) and H3 helix:H3 tail distance (black) for the 10-μs simulation 1 and for the 5-μs simulations 2–10. The black circles enclose examples of a short- and a long-lived DNA detachment event.
To capture the detachment events in the trajectories, the distance between the CM of H3 αN helix and the CM of the SH-6.5 segment (H3 helix:SH-6.5 distance) was calculated for all trajectories (see Fig. 1 b). An increase of the H3 helix:SH-6.5 distance was considered to be a detachment if this event lasted >10 ns and if the mean CM distance during this time was greater than the mean CM distance for the whole trajectory plus its standard deviation. The distance between the CM of the base of H3 tail (residues 35–41) and the CM of the H3 αN helix (H3 helix:H3 tail distance) was also calculated.
To identify the residues involved in the detachment, the distances between the residues of SH-6.5 DNA end and those of the neighboring H3 and H2A histones were monitored together with the distances between residues of the H3 tail and residues of the internal superhelical turn of DNA near this tail (SH0.5 segment). Cα–P contacts at a time t were considered as broken when
| (4) |
and
| (5) |
where rti,i+n is the distance between two residues i and i + n at a time t, 〈rti,i+n〉 is the mean distance of interaction for the pair, and σ is the standard deviation, the value of 14.7 Å corresponding to the cutoff distance defining the short-range and long-range Cα–P nonbonded interactions (35). Similarly, Cα–P and Cα–Cα contacts are formed at time t if
| (6) |
and
| (7) |
for Cα–P pairs, and
| (8) |
for Cα–Cα pairs, the value of 10.0 Å corresponding to the cutoff distance used to define short-range and long-range Cα–Cα nonbonded interactions.
Results
Visualization of the CG trajectories revealed multiple detachment events involving the SH-6.5 DNA end only and occurring in all the trajectories (see Movie S1 in the Supporting Material). Two types of detachment were observed: short-lived, transient detachments occurring in almost all the simulations; and long-lived detachments, present in half of the trajectories, that are not reversible on the timescale of the simulation. In what follows, properties of the detachments, including lifetimes, frequencies, and amplitudes are quantified, then the mechanisms of the short- and long-lived detachments are examined in detail.
Properties of the SH-6.5 DNA end detachment
Fig. 1 b shows the H3 helix:SH-6.5 distance for the 10-μs simulation 1 and for the 5-μs simulations 2–10. The transient increases of the H3 helix:SH-6.5 distance correspond to short-lived detachments of the SH-6.5 end. In the long-lived detachments, the H3 helix:SH-6.5 distance increases, then remains large until the end of the trajectories.
Properties of the short-lived open states are quantified in Table 1 for simulations in which no long-lived detachments are observed, i.e., simulations 2–3 and 8–10 and for the first 5 μs of simulation 1. The detachment amplitude can reach ≈15 Å, as indicated by the maximal value of the H3 helix:SH-6.5 distance observed in trajectory 3. The mean amplitude of detachment for the short-lived events of six trajectories is 5.1 ± 1.9 Å, with the mean H3 helix:SH-6.5 distance for the closed and the open states being equal to 21.4 ± 0.6 Å and 26.5 ± 1.8 Å. The lifetime of the short-lived open state varies significantly, the longest being 109 ns (trajectory 9) whereas the shortest is only 10 ns; averaged over all six simulations, the lifetime is 41.7 ± 30.6 ns. On average, the nucleosome spends 8.1% of the time in a short-lived open state, this population varying between 11.7% and 3.1% in simulations 8 and 3. The resulting free energy estimated for the short-lived open state is thus ln(0.8) = 2.5 kT.
Table 1.
Statistics of the short-lived open states
| Simulation |
Number of short-lived events |
〈ton〉 (ns) |
Percentage of time in open state |
(Å) |
(Å) |
|---|---|---|---|---|---|
| SH-6.5 side calculated from 5-μs simulations 1–3 and 8–15 | |||||
| 1 | 9 | 44.9 ± 30.7 | 8.1% | 21.5 ± 0.7 | 26.5 ± 1.9 |
| 2 | 5 | 46.3 ± 24.6 | 4.6% | 21.5 ± 0.7 | 26.4 ± 1.7 |
| 3 | 9 | 17.5 ± 7.8 | 3.1% | 21.4 ± 0.7 | 25.7 ± 2.2 |
| 8 | 12 | 48.9 ± 32.5 | 11.7% | 21.6 ± 0.8 | 26.5 ± 1.7 |
| 9 | 11 | 45.7 ± 30.6 | 10.0% | 21.6 ± 0.8 | 26.5 ± 1.7 |
| 10 | 12 | 44.5 ± 35.1 | 10.7% | 21.4 ± 0.8 | 26.6 ± 1.7 |
| 11 | 4 | 14.1 ± 3.5 | 2.9% | 22.2 ± 0.7 | 25.1 ± 1.2 |
| 12 | 11 | 13.4 ± 3.3 | 2.2% | 22.5 ± 0.7 | 25.1 ± 1.1 |
| 13 | 12 | 14.8 ± 5.1 | 3.6% | 22.4 ± 1.0 | 24.4 ± 1.5 |
| 14 | 11 | 15.6 ± 6.0 | 2.2% | 22.5 ± 1.0 | 24.5 ± 1.5 |
| 15 | 9 | 15.0 ± 6.0 | 2.2% | 22.4 ± 1.0 | 24.4 ± 1.6 |
| Simulation |
Number of short-lived events |
〈ton〉 (ns) |
Percentage of time in open state |
(Å) |
(Å) |
|---|---|---|---|---|---|
| SH6.5 side calculated from simulations 11–15 | |||||
| 11 | 2 | 10.2 ± 0.1 | 0.4% | 20.1 ± 0.6 | 23.9 ± 2.2 |
| 12 | 4 | 11.1 ± 1.4 | 0.9% | 20.0 ± 0.6 | 23.1 ± 1.6 |
| 13 | 7 | 16.7 ± 7.0 | 2.3% | 20.5 ± 1.2 | 26.6 ± 4.7 |
| 14 | 1 | 17.2 ± 0.3 | 0.3% | 20.5 ± 1.2 | 24.7 ± 4.2 |
| 15 | 4 | 20.2 ± 14.6 | 1.6% | 20.5 ± 1.3 | 24.2 ± 3.3 |
Value 〈ton〉 is the average opening time. , , , and are the average H3 helix:SH-6.5 distance and H3 helix:SH6.5 distance in the closed and open state, respectively.
Long-lived DNA detachments occur in simulations 1, 4, 5, 6, and 7, after 5.9 μs, 120 ns, 1.5, 2.2, and 1.4 μs, respectively, and are irreversible on the timescale of the simulations. In the long-lived open state, the mean H3 helix:SH-6.5 distance is 29.1 ± 1.2 Å, i.e., the SH-6.5 segment is, on average, 2.6 Å farther away from the nucleosome core than it is in the short-lived open state.
Also shown in Fig. 1 b is the H3 helix:H3 tail distance for the 10 trajectories. Each DNA detachment coincides with a shortening of this distance such that the αN helix and the base of the H3 tail approach as close as ≈3 Å when the SH-6.5 end moves away from the protein core.
The mean RMSD from the initial structure of the SH-6.5 DNA segment for the closed state calculated from simulation 1 is 1.4 ± 1.2 Å. The mean RMSD from the first structure of the long-lived open state calculated for the long-lived open state is 2.5 ± 0.5 Å, i.e., higher than for the closed state but in a range considered reasonable for CG models, consistent with the structure being maintained during the coarse-grained MD simulation.
To further understand the mechanisms of the short- and long-lived detachments, we have examined the structure of the nucleosome in both states and identified the residues involved in the detachments.
Short-lived DNA detachments
Fig. 2 a shows two structures of the nucleosome in the closed and short-lived open state, and the residues involved in the DNA detachment. In the closed state, the base of the H3 tail is trapped between the segments SH0.5 and SH-6.5 of the two turns of the DNA superhelix, whereas in the open state the H3 tail has moved into the space between the nucleosome core and the detached DNA. In total, 9 bp of the SH-6.5 end are involved in native contacts with histones that break during detachments, five of which belong to the SH-6.5 segment, and the other four to the DNA linker. Nine residues of the H3 αN helix (residues 42, 45, 46, 48–51, 53, and 56) and seven residues of the base of the H3 tail (residues 35–41) participate in these broken contacts. Contacts are also broken between the DNA linker and the base of the H3 tail. A figure showing all the contacts changes during two short-lived detachment events in simulation 1 is given in the Supporting Material. These contacts were the same in all simulations.
Figure 2.
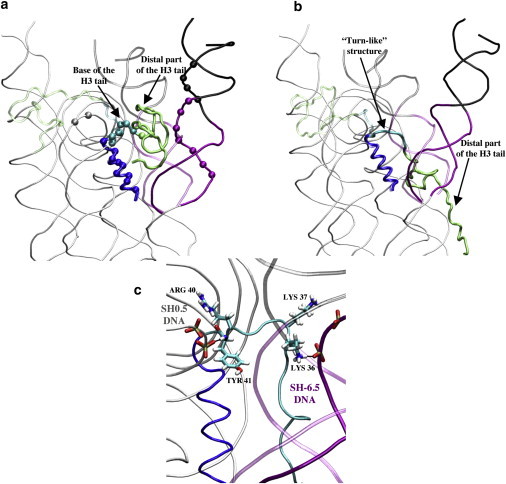
(a) Superimposition of the CG structures of the H3 tail, the H3 αN helix, and the SH-6.5 DNA end in the short-lived open state (opaque) and in the closed state (transparent) in a side view. The same coloring scheme as in Fig. 1 is used. The beads on DNA represent the basepairs of the SH-6.5 end involved in native contacts with histones that break during detachments, five of which belong to the SH-6.5 segment, and the other four to the DNA linker. The beads present on histones are the nine residues of the H3 αN helix (residues 42, 45, 46, 48–51, 53, and 56) and the seven residues of the base of the H3 tail (residues 35–41) that participate in these broken contacts. (b) Superimposition of the CG model of the nucleosome in the long-lived open state (opaque) and of the closed state (transparent) in a side view. The H3 tail is packed on the surface of the nucleosome and the base of the H3 tail adopts a turn-like structure that occupies the space freed by the last two basepairs of the SH-6.5 DNA segment. (c) Mapped all-atom model of the long-lived open state (opaque) in a side view: the Lys36 forms a salt bridge with a phosphate group of the SH-6.5 DNA segment. The Lys37 is also observed in the vicinity of phosphate groups of the SH-6.5 segment and may also contribute to maintaining the turn-like structure. Arg40 and Tyr41 are hydrogen-bonded with phosphates of the SH0.5 segment.
The end of the short-lived open state is characterized by the reattachment of the SH-6.5 DNA end to the protein core, in contrast to the long-lived open state, in which the DNA remains detached.
Long-lived DNA detachments
Fig. 2 b shows two configurations of the H3 tail and the SH-6.5 DNA end representative of the long-lived open state and closed state. In the long-lived open state, the position of the H3 tail is qualitatively different from both the closed and short-lived open states: it is folded back onto the surface of the nucleosome core and in contact with histones. In this configuration, residues 30–35 of the proximal part of the H3 tail remain in a coiled conformation for which the mean RMSD (from the first structure of the long-lived open state) is 2.0 ± 0.2 Å). The residues 36–41 at the base of the tail form a stable turn-like structure, for which the mean RMSD is 1.2 ± 0.3 Å, and partly occupies the space left by the detached SH-6.5 segment. As a consequence, this turn-like structure prevents the SH-6.5 DNA end from reforming native contacts with the histone core observed in the closed configuration.
To understand this process, the transition phase from the closed to the long-lived open state was examined for all simulations. The scenario of this transition phase was found to be the same for all the simulations, and so here we present in detail the results only for simulation 1. Fig. 3 a shows contacts in the SH-6.5 DNA end region occurring between 5.92 μs and 6.04 μs, i.e., shortly before, during, and shortly after the transition phase, together with the H3 helix:SH-6.5 distance. The transition phase starts at 5.96 μs as defined by the increase of the H3 helix:SH-6.5 distance, stops at 5.99 μs when the distance stabilizes, and can be divided into two different periods according to the sequence of contacts that break and form.
Figure 3.
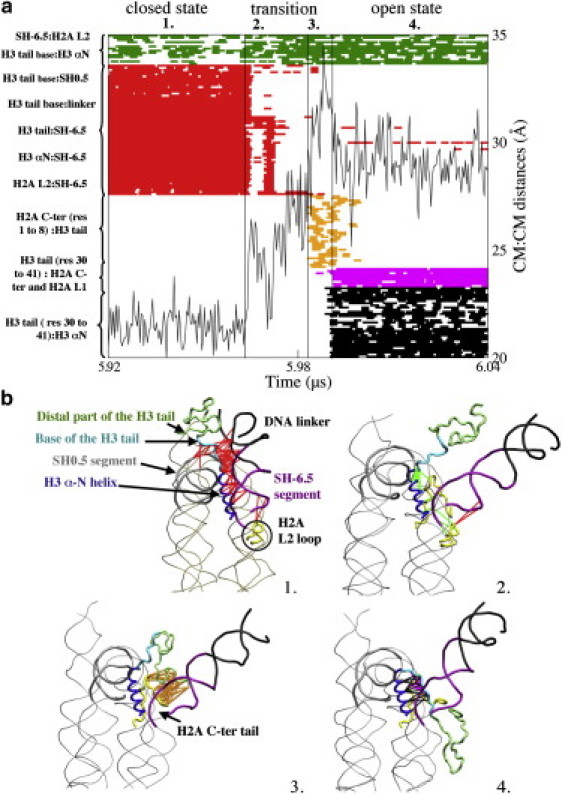
(a) Formed and broken contacts in the CG structure of the nucleosome and H3 helix:SH-6.5 distance during the period encompassing the transition from the closed to the long-lived open state in simulation 1. (a1) Closed state: a tick is displayed when a native or a new formed interaction is present. (a2) First phase of the transition: contacts broken and formed in the first phase are the same as for the short-lived open state. (a3) Second phase of the transition: contacts are formed between the extremity of the H3 tail and the extremity of the C-terminal tail of H2A. (a4) Open state: at the end of the transition phase, the H3 tail forms new contacts with the H3 αN helix and with the C-terminal extension and the L2 loop of H2A. Interactions of the distal part of H3 are not displayed. (b) Representation of the nucleosome in (b1) the closed state, (b2) the first and (b3) the second phases of the transition state, and (b4) in the long-lived open state. The lines correspond to the interactions displayed in a.
In the first period of the transition, pairs of contacts identical to those occurring in the short-lived open state form inside histone H3 and between the SH-6.5 DNA end and histone H3 and H2A. Also, broken contacts similar to those breaking in the short-lived open state occur between the SH-6.5 end and histone H3 (Fig. 3 b).
The second period of the transition phase is characteristic of the long-lived detachment only. During this period transient contacts, lasting ≈20 ns and occurring only at this stage of the trajectory, are formed between the extremity of the H3 tail (residues 1–8) and the extremity of the H2A C-terminal tail (residues 118–128). Fig. 3 b shows that these contacts orient the H3 tail toward the surface of the nucleosome and, as a consequence, initiate the packing of the H3 tail onto the protein core. Moreover, visualization of the trajectory shows that this network of contacts anchors the end of the H3 tail while the rest of the tail is subjected to structural rearrangements in a large space between the nucleosome core and the detached DNA end. The H3 helix:SH-6.5 distances shown in Fig. 3 a reach their highest values during the second phase of the transition.
At the end of the transition phase, new contacts form between residues of the H3 αN helix and residues 30–41 of the H3 tail and between the latter residues and residues 108–120 of the C-terminal extension of H2A. Moreover, the packing of the H3 tail on the surface of the nucleosome moves the distal part of the H3 tail (residues 1–30) into a region formed by the histones H2A and H2B that contains an acidic patch of seven residues, as shown in Fig. 4 a. The distal part of the tail remains in the vicinity of this region during the entire lifetime of the open state. These contacts that are formed between the distal part of the H3 tail and residues of the H2A histone, i.e., two regions of the nucleosome that were initially far apart, are long-range nonbonded interactions that have approached.
Figure 4.
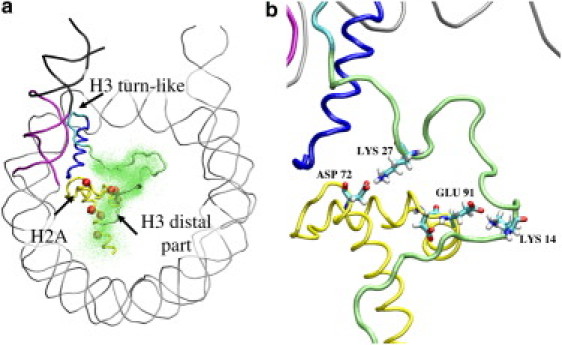
(a) Rear view of the CG nucleosome model in the long-lived open state with the H3 tail folded on the histone core. The beads represent the residues of H2A and H2B histones that comprise the acidic patch (residues Glu56, Glu61, Glu64, Asp90, Glu91, Glu92 of H2A and Glu110 of H2B) and the residue Asp72. In the long-lived open state, the H3 tail occupies the region of the acidic patch. The dots correspond to residues 1–30 of the distal part of the H3 tail at different time of the long-lived open state. (b) Rear view of the all-atom mapped model showing the hydrogen bonds formed between the Asp72 and Glu91 residues of the acidic patch region and the Lys27 and Lys14 residues of the H3 tail.
The physical consistency of the long-lived open state was verified by mapping a representative CG structure of the nucleosome in the open state onto an all-atom model (see Methods) and subjecting it to MD in explicit solvent. The resulting all-atom model of the long-lived open state remains stable over the 100-ns simulation time. A preliminary analysis of the long-lived open state all-atom simulation shows that the SH-6.5 segment has a mean RMSD of 2.1 ± 0.4 Å. The turn-like structure at the base of the H3 tail is also stable along the simulation with a mean RMSD of 0.8 ± 0.3 Å. Fig. 2 c shows that the turn-like structure is stabilized by salt bridges between residues of the base of the H3 tail and phosphates of the SH-6.5 segment (occupancy > 95%) and of the SH0.5 segment (occupancy > 90%). The figure also illustrates how the H3 tail bridges the SH-6.5 DNA end and the SH0.5 segment and, consequently, deviates the SH-6.5 DNA extremity from the path it follows on the surface of the protein core in the closed configuration. Indeed, the mean H3 helix:SH-6.5 distance over the MD simulation of the mapped all-atom model is 25.9 ± 1.0 Å, i.e., significantly higher than the mean value of 19.5 ± 0.4 Å observed along the all-atom closed state MD simulation. Analysis of the distal part of the H3 tail in the mapped structure shows that, in accordance with the CG simulations that predict the presence of the distal part of the H3 tail in the region of the acidic patch, a number of residues of the distal part of the H3 tail form salt bridges with residues in the region of the acidic patch (see Fig. 4 c) over the simulation time.
Furthermore, conformation-dependent free energy calculations using the MM-PBSA approach (45,46) corroborate that the long-lived open state: 1), is not an artifact of the CG force field, and 2), is consistent with the view of an intermediate state sitting in a higher free energy basin relative to the closed state (see the Supporting Material).
The results obtained from the analysis of short- and long-lived open states indicate that, whereas the detachment of the SH-6.5 DNA end occurs spontaneously, the H3 tail seems to play a role in maintaining the nucleosome in the long-lived open state or, in the case of the short-lived open state, delaying its rewrapping around the nucleosome core. To further test these findings, simulations of the nucleosome without the H3 tails were performed.
Simulations without the H3 tails
Five simulations of the nucleosome with the H3 tails truncated were run for 5 μs starting from the same configuration but with five different velocity seeds (see Methods). For all these simulations, only short-lived detachments were observed. Detachments occur at both SH-6.5 and SH6.5 ends, whereas in the presence of the tails detachments were observed only on the SH-6.5 side.
Properties of the SH-6.5 and SH6.5 short-lived open states are quantified in Table 1 for the five simulations. In the H3-tailless nucleosomes the SH-6.5 end detaches as often as in the presence of the H3 tails. However, the lifetimes of the detachments are ≈3 times shorter and their amplitude is ≈2 Å shorter than in the full-tailed nucleosome. These observations support the finding that the H3 tail may delay or prevent the DNA end from reattaching to the nucleosome core.
On the SH6.5 side there are, on average, fewer detachments occurring than on the SH-6.5 side but with similar lifetimes. As a consequence, the open state fraction on the SH6.5 side is low, between 0.3 and 2.3%.
Discussion
The CG MD simulations of the nucleosome with DNA linkers described here exhibit spontaneous detachments of nucleosomal DNA. The detachments involve only the ends of the nucleosome, i.e., basepairs of the SH-6.5 DNA segment and, in the nucleosome without the H3 tails, basepairs of the SH6.5 segment, whereas the segments located further in the nucleosome remain attached to the histone octamer. This result is in agreement with experimental studies on nucleosomal DNA unwrapping that suggest that nucleosomal DNA ends involving at least 20–30 bp are able to dissociate spontaneously from the protein core (4–8). An explanation for this behavior is that the last 13 basepairs on each side are tangential to the protein core and consequently form weaker contacts with the core than the other DNA segments that are bent around the histone octamer (47). The particular weakness of the interactions near the entry and exit of the nucleosome in comparison with the rest of the nucleosome was shown in a recent study in which the strength of histone:DNA interactions was measured using mechanical unzipping of DNA molecules containing a nucleosome (48).
Our simulations display transient short-lived open states and long-lived open states, the latter being irreversible on the timescale of the simulation. Comparison between the long- and short-lived open states indicates that the latter coincide with the first stage of the transition to the long-lived state, the second stage corresponding to rearrangements of the H3 tail that stabilize the nucleosome in the open configuration. In the case of the short-lived open state, the DNA reattaches to the histone core before the H3 tail can rearrange.
The lifetime of the short-lived open states in the CG simulations is ∼10–140 ns and that of the long-lived open states is >1 μs. In comparison, a value of 10–50 ms has been obtained experimentally for the lifetime of unwrapped states (49) involving the first 20–30 bp of nucleosomal DNA. As discussed in Methods, our CG model might exhibit artificially accelerated dynamics due to the low collision frequency γ of the Langevin bath used to accelerate configurational sampling together with the smoothing of the potential energy surface arising from the missing degrees of freedom. However, the short-lived DNA detachments seen here and involving 9 bp of DNA, i.e., a shorter segment than detachments seen with FRET (49,50), might correspond to events occurring on a shorter timescale than the millisecond and which are not detectable by FRET techniques that time resolution scales from ≈1 ms to 10 s. Moreover, the free energy of the transient short-lived open states calculated here, i.e., ≈2.5 kT, is in the range of values of the free energy estimated from experiments for a detachment of ≈10 bp, i.e., ≈1.6 kT (4,51).
Our simulations suggest an active role of the H3 tail in impeding the reattachment of the nucleosomal DNA end to the nucleosome core. The CG MD simulations show a long-lived open state in which the rearrangement of the H3 tail induces the formation of a turn-like structure at the base of the tail that is located on the path of the SH-6.5 DNA segment on the histone surface, thus preventing the DNA from reforming native contacts with the histones. These observations are supported by the MD simulation in explicit solvent of a representative CG open configuration mapped onto an all-atom model. At the atomic level, the turn-like structure is stabilized by salt bridges and strong hydrogen bonds between residues at the base of the tail and the two turns of the DNA superhelix. During the all-atom simulation of the mapped structure, additional residues of the tail move between the H3 helix and the SH-6.5 extremity, causing a large deviation of the SH-6.5 DNA linker from its initial path in the closed state. The finding that the H3 tail prevents DNA rebinding is also supported by the absence of long-lived open states in the nucleosome when the H3 tails are removed.
Another consequence of the packing of the H3 tail onto the surface of the protein core in the long-lived open state is to bring the distal part of the H3 tail in contact with a region formed by the H2A and H2B histones containing an acidic patch (Fig. 4). In agreement with this result, in all-atom simulation of the mapped CG structure several residues of the H3 tail form salt bridges with residues of the acidic patch. Interestingly, in crystals of the NCP the acidic patch has been shown to be in contact with part of the H4 tail (residues 16–25) of the adjacent nucleosome and to be cross-linked by this same H4 region in cross-linking experiments (52,23). Two recent studies, one again using a cross-linking assay (16) and the other investigating the histone variant H2A.Bbd (53), suggest that the H4 tail can also contact the H2A pocket of its own nucleosome and may this way stabilize DNA wrapping. Based on our results and the above experimental data, we propose a model in which the H3 and H4 tails compete for contacting the acidic patch of H2A-H2B. Interaction of the acidic patch with the H4 tail would stabilize the nucleosome in the closed state, whereas the interaction of the acidic patch with the H3 tail would promote the open state. The packing of the H3 tail in the open state would then fulfill two functions: the turn-like structure at the base of the tail would keep the DNA end away from the protein core while the distal part of the H3 tail would contact the acidic patch region and thus prevent the formation of higher order structures of chromatin.
Experimental data reporting on the interactions and the position of the tails in nucleosomes with partially unwrapped DNA is generally sparse. To date there is no direct experimental evidence for the H3 tail adopting the configuration seen here. However, there is cryo-EM evidence for nucleosome particles with <1.75 turns exhibiting sharply bent DNA ends (10), in agreement with our results. In Zlatanova et al. (10), it was proposed that the strong bends of the DNA arms in the entry-exit region may reflect either electrostatic repulsion between the two DNA arms and/or steric obstacles on the histone surface. Here, we suggest that the reorganization of the H3 tail on the surface of the nucleosome might constitute such a steric obstacle to the reattachment of the DNA. Experimental evidences for the H3 tail contacting the acidic patch may be provided by cross-linking the distal part of the H3 tail and the acidic patch region on H2A/H2B histones. FRET experiments where these two regions would be marked with appropriate fluorophore could also be used to check that the H3 tail and the acidic patch can interact together.
Conclusion
The detachment of a 9-bp nucleosomal DNA segment at one end of the nucleosome has been characterized using a coarse-grained model of the nucleosome suitable for MD simulations on the microsecond timescale. The reduced computational cost of the model relative to atomistic MD allowed a large number of simulations to be performed and, consequently, statistics of detachment events to be collected. The CG simulations predict that DNA unwrapping at the nucleosome end occurs in two steps: the first step is fast and reversible while the second step is stabilized by rearrangements of the H3 tail at the surface of the nucleosome. Although the hypothesis that the histone tails affect unwrapping of DNA from the nucleosome has motivated many studies, the idea of an active role of the tails in preventing the nucleosomal DNA from rewrapping has, to our knowledge, not yet been proposed. Our study suggests that the base of the H3 tail may adopt a turn-like conformation that can deviate the nucleosomal DNA end from its initial path on the proteic core surface. Refinement of the CG open conformation at atomic-resolution using MD agrees with the possibility of a stable turn-like structure in this region of the nucleosome that can hinder the DNA end from reforming its initial contacts with the histones. By maintaining the nucleosomal DNA end away from the nucleosome core, the H3 tail may participate in the initiation of the unwrapping of larger amount of DNA from the nucleosome.
Acknowledgments
K.V. and N.C. acknowledge the Heidelberg Linux Cluster System of the University of Heidelberg and the bwGRiD (http://www.bw-grid.de), member of the German D-Grid initiative, funded by the Ministry for Education and Research and the Ministry for Science, Research and Arts Baden-Wuerttemberg for providing high performance computing facilities.
K.V. was supported by the International Graduiertenkolleg IGK 710, “Complex Processes: Modeling, Simulation and Optimization”. J.T. acknowledges support from The Interdisciplinary Center for Mathematical and Computational Modeling, University of Warsaw (BST G31-4), Polish Ministry of Science and Higher Education (N N301 245236), and Foundation for Polish Science (focus and team cofinanced by European Regional Development Fund operated within Innovative Economy Operational Program). J.C.S. acknowledges support from a “Multiscale Modeling and Simulation” grant from The Office of Advanced Scientific Computing Research/Bureau of Education and Research of the United States Department of Energy. J.L. acknowledges support by the Deutsche Forschungsgemeinschaft La500/14-1.
Supporting Material
References
- 1.Olins A.L., Olins D.E. Spheroid chromatin units (ν-bodies) Science. 1974;183:330–332. doi: 10.1126/science.183.4122.330. [DOI] [PubMed] [Google Scholar]
- 2.Finch J.T., Klug A. Solenoidal model for superstructure in chromatin. Proc. Natl. Acad. Sci. USA. 1976;73:1897–1901. doi: 10.1073/pnas.73.6.1897. [DOI] [PMC free article] [PubMed] [Google Scholar]
- 3.Saha A., Wittmeyer J., Cairns B.R. Chromatin remodeling: the industrial revolution of DNA around histones. Nat. Rev. Mol. Cell Biol. 2006;7:437–447. doi: 10.1038/nrm1945. [DOI] [PubMed] [Google Scholar]
- 4.Polach K.J., Widom J. Mechanism of protein access to specific DNA sequences in chromatin: a dynamic equilibrium model for gene regulation. J. Mol. Biol. 1995;254:130–149. doi: 10.1006/jmbi.1995.0606. [DOI] [PubMed] [Google Scholar]
- 5.Tóth K., Brun N., Langowski J. Chromatin compaction at the mononucleosome level. Biochemistry. 2006;45:1591–1598. doi: 10.1021/bi052110u. [DOI] [PubMed] [Google Scholar]
- 6.Anderson J.D., Thåström A., Widom J. Spontaneous access of proteins to buried nucleosomal DNA target sites occurs via a mechanism that is distinct from nucleosome translocation. Mol. Cell. Biol. 2002;22:7147–7157. doi: 10.1128/MCB.22.20.7147-7157.2002. [DOI] [PMC free article] [PubMed] [Google Scholar]
- 7.Li G., Levitus M., Widom J. Rapid spontaneous accessibility of nucleosomal DNA. Nat. Struct. Mol. Biol. 2005;12:46–53. doi: 10.1038/nsmb869. [DOI] [PubMed] [Google Scholar]
- 8.Bucceri A., Kapitza K., Thoma F. Rapid accessibility of nucleosomal DNA in yeast on a second time scale. EMBO J. 2006;25:3123–3132. doi: 10.1038/sj.emboj.7601196. [DOI] [PMC free article] [PubMed] [Google Scholar]
- 9.Gansen A., Valeri A., Seidel C.A. Nucleosome disassembly intermediates characterized by single-molecule FRET. Proc. Natl. Acad. Sci. USA. 2009;106:15308–15313. doi: 10.1073/pnas.0903005106. [DOI] [PMC free article] [PubMed] [Google Scholar]
- 10.Zlatanova J., Leuba S.H., van Holde K. Chromatin fiber structure: morphology, molecular determinants, structural transitions. Biophys. J. 1998;74:2554–2566. doi: 10.1016/S0006-3495(98)77963-9. [DOI] [PMC free article] [PubMed] [Google Scholar]
- 11.Li G., Widom J. Nucleosomes facilitate their own invasion. Nat. Struct. Mol. Biol. 2004;11:763–769. doi: 10.1038/nsmb801. [DOI] [PubMed] [Google Scholar]
- 12.Tomschik M., Zheng H., Leuba S.H. Fast, long-range, reversible conformational fluctuations in nucleosomes revealed by single-pair fluorescence resonance energy transfer. Proc. Natl. Acad. Sci. USA. 2005;102:3278–3283. doi: 10.1073/pnas.0500189102. [DOI] [PMC free article] [PubMed] [Google Scholar]
- 13.Tomschik M., van Holde K., Zlatanova J. Nucleosome dynamics as studied by single-pair fluorescence resonance energy transfer: a reevaluation. J. Fluoresc. 2009;19:53–62. doi: 10.1007/s10895-008-0379-1. [DOI] [PubMed] [Google Scholar]
- 14.Shlyakhtenko L.S., Lushnikov A.Y., Lyubchenko Y.L. Dynamics of nucleosomes revealed by time-lapse atomic force microscopy. Biochemistry. 2009;48:7842–7848. doi: 10.1021/bi900977t. [DOI] [PMC free article] [PubMed] [Google Scholar]
- 15.Kan P.Y., Lu X., Hayes J.J. The H3 tail domain participates in multiple interactions during folding and self-association of nucleosome arrays. Mol. Cell. Biol. 2007;27:2084–2091. doi: 10.1128/MCB.02181-06. [DOI] [PMC free article] [PubMed] [Google Scholar]
- 16.Kan P.Y., Caterino T.L., Hayes J.J. The H4 tail domain participates in intra- and internucleosome interactions with protein and DNA during folding and oligomerization of nucleosome arrays. Mol. Cell. Biol. 2009;29:538–546. doi: 10.1128/MCB.01343-08. [DOI] [PMC free article] [PubMed] [Google Scholar]
- 17.Van Holde K. Springer; New York: 1989. Chromatin. [Google Scholar]
- 18.Gansen A., Tóth K., Langowski J. Structural variability of nucleosomes detected by single-pair Förster resonance energy transfer: histone acetylation, sequence variation, and salt effects. J. Phys. Chem. B. 2009;113:2604–2613. doi: 10.1021/jp7114737. [DOI] [PubMed] [Google Scholar]
- 19.Polach K.J., Lowary P.T., Widom J. Effects of core histone tail domains on the equilibrium constants for dynamic DNA site accessibility in nucleosomes. J. Mol. Biol. 2000;298:211–223. doi: 10.1006/jmbi.2000.3644. [DOI] [PubMed] [Google Scholar]
- 20.Anderson J.D., Lowary P.T., Widom J. Effects of histone acetylation on the equilibrium accessibility of nucleosomal DNA target sites. J. Mol. Biol. 2001;307:977–985. doi: 10.1006/jmbi.2001.4528. [DOI] [PubMed] [Google Scholar]
- 21.Ferreira H., Somers J., Owen-Hughes T. Histone tails and the H3 αN helix regulate nucleosome mobility and stability. Mol. Cell. Biol. 2007;27:4037–4048. doi: 10.1128/MCB.02229-06. [DOI] [PMC free article] [PubMed] [Google Scholar]
- 22.Choi J.K., Howe L.J. Histone acetylation: truth of consequences? Biochem. Cell Biol. 2009;87:139–150. doi: 10.1139/O08-112. [DOI] [PubMed] [Google Scholar]
- 23.Luger K., Mäder A.W., Richmond T.J. Crystal structure of the nucleosome core particle at 2.8 Å resolution. Nature. 1997;389:251–260. doi: 10.1038/38444. [DOI] [PubMed] [Google Scholar]
- 24.Richmond T.J., Davey C.A. The structure of DNA in the nucleosome core. Nature. 2003;423:145–150. doi: 10.1038/nature01595. [DOI] [PubMed] [Google Scholar]
- 25.Ruscio J.Z., Onufriev A. A computational study of nucleosomal DNA flexibility. Biophys. J. 2006;91:4121–4132. doi: 10.1529/biophysj.106.082099. [DOI] [PMC free article] [PubMed] [Google Scholar]
- 26.Bishop T.C. Molecular dynamics simulations of a nucleosome and free DNA. J. Biomol. Struct. Dyn. 2005;22:673–686. doi: 10.1080/07391102.2005.10507034. [DOI] [PubMed] [Google Scholar]
- 27.Roccatano D., Barthel A., Zacharias M. Structural flexibility of the nucleosome core particle at atomic resolution studied by molecular dynamics simulation. Biopolymers. 2007;85:407–421. doi: 10.1002/bip.20690. [DOI] [PubMed] [Google Scholar]
- 28.Materese C.K., Savelyev A., Papoian G.A. Counterion atmosphere and hydration patterns near a nucleosome core particle. J. Am. Chem. Soc. 2009;131:15005–15013. doi: 10.1021/ja905376q. [DOI] [PubMed] [Google Scholar]
- 29.Wocjan T., Klenin K., Langowski J. Brownian dynamics simulation of DNA unrolling from the nucleosome. J. Phys. Chem. B. 2009;113:2639–2646. doi: 10.1021/jp806137e. [DOI] [PubMed] [Google Scholar]
- 30.Feng J., Chun-Cheng Z. Thermodynamics of nucleosomal core particles. Biochemistry. 2007;46:2594–2598. doi: 10.1021/bi061138i. [DOI] [PubMed] [Google Scholar]
- 31.Möbius W., Neher R.A., Gerland U. Kinetic accessibility of buried DNA sites in nucleosomes. Phys. Rev. Lett. 2006;97:208102. doi: 10.1103/PhysRevLett.97.208102. [DOI] [PubMed] [Google Scholar]
- 32.Sharma S., Ding F., Dokholyan N.V. Multiscale modeling of nucleosome dynamics. Biophys. J. 2007;92:1457–1470. doi: 10.1529/biophysj.106.094805. [DOI] [PMC free article] [PubMed] [Google Scholar]
- 33.Korolev N., Lyubartsev A.P., Nordenskiöld L. Computer modeling demonstrates that electrostatic attraction of nucleosomal DNA is mediated by histone tails. Biophys. J. 2006;90:4305–4316. doi: 10.1529/biophysj.105.080226. [DOI] [PMC free article] [PubMed] [Google Scholar]
- 34.Arya G., Schlick T. Role of histone tails in chromatin folding revealed by a mesoscopic oligonucleosome model. Proc. Natl. Acad. Sci. USA. 2006;103:16236–16241. doi: 10.1073/pnas.0604817103. [DOI] [PMC free article] [PubMed] [Google Scholar]
- 35.Voltz K., Trylska J., Smith J. Coarse-grained force field for the nucleosome from self-consistent multiscaling. J. Comput. Chem. 2008;29:1429–1439. doi: 10.1002/jcc.20902. [DOI] [PubMed] [Google Scholar]
- 36.Trylska J., Tozzini V., McCammon J.A. Exploring global motions and correlations in the ribosome. Biophys. J. 2005;89:1455–1463. doi: 10.1529/biophysj.104.058495. [DOI] [PMC free article] [PubMed] [Google Scholar]
- 37.Trylska J., Konecny R., McCammon J.A. Ribosome motions modulate electrostatic properties. Biopolymers. 2004;74:423–431. doi: 10.1002/bip.20093. [DOI] [PubMed] [Google Scholar]
- 38.Tozzini V., Trylska J., McCammon J.A. Flap opening dynamics in HIV-1 protease explored with a coarse-grained model. J. Struct. Biol. 2007;157:606–615. doi: 10.1016/j.jsb.2006.08.005. [DOI] [PubMed] [Google Scholar]
- 39.Reith D., Pütz M., Müller-Plathe F. Deriving effective mesoscale potentials from atomistic simulations. J. Comput. Chem. 2003;24:1624–1636. doi: 10.1002/jcc.10307. [DOI] [PubMed] [Google Scholar]
- 40.Smith W., Forester T.R. DL_POLY_2.0: a general-purpose parallel molecular dynamics simulation package. J. Mol. Graph. 1996;14:136–141. doi: 10.1016/s0263-7855(96)00043-4. [DOI] [PubMed] [Google Scholar]
- 41.Montgomery Pettitt B., Karplus M. The potential of mean force surface for the alanine dipeptide in aqueous solution: a theoretical approach. Chem. Phys. Lett. 1985;121:194–201. [Google Scholar]
- 42.Venable R.M., Pastor R.W. Frictional models for stochastic simulations of proteins. Biopolymers. 1988;27:1001–1014. doi: 10.1002/bip.360270609. [DOI] [PubMed] [Google Scholar]
- 43.Loncharich R.J., Brooks B.R., Pastor R.W. Langevin dynamics of peptides: the frictional dependence of isomerization rates of n-acetylalanyl-n′-methylamide. Biopolymers. 1992;32:523–535. doi: 10.1002/bip.360320508. [DOI] [PubMed] [Google Scholar]
- 44.Hamelberg D., Shen T., McCammon J.A. Insight into the role of hydration on protein dynamics. J. Chem. Phys. 2006;125:094905. doi: 10.1063/1.2232131. [DOI] [PubMed] [Google Scholar]
- 45.Kollman P.A., Massova I., Cheatham T.E., 3rd Calculating structures and free energies of complex molecules: combining molecular mechanics and continuum models. Acc. Chem. Res. 2000;33:889–897. doi: 10.1021/ar000033j. [DOI] [PubMed] [Google Scholar]
- 46.Srinivasan J., Cheatham T.E., Case D.A. Continuum solvent studies of the stability of DNA, RNA, and phosphoramidate-DNA helices. J. Am. Chem. Soc. 1998;120:9401–9409. [Google Scholar]
- 47.Davey C.A., Sargent D.F., Richmond T.J. Solvent mediated interactions in the structure of the nucleosome core particle at 1.9 Å resolution. J. Mol. Biol. 2002;319:1097–1113. doi: 10.1016/S0022-2836(02)00386-8. [DOI] [PubMed] [Google Scholar]
- 48.Hall M.A., Shundrovsky A., Wang M.D. High-resolution dynamic mapping of histone-DNA interactions in a nucleosome. Nat. Struct. Mol. Biol. 2009;16:124–129. doi: 10.1038/nsmb.1526. [DOI] [PMC free article] [PubMed] [Google Scholar]
- 49.Li G., Levitus M., Widom J. Rapid spontaneous accessibility of nucleosomal DNA. Nat. Struct. Mol. Biol. 2005;12:46–53. doi: 10.1038/nsmb869. [DOI] [PubMed] [Google Scholar]
- 50.Koopmans W.J., Brehm A., van Noort J. Single-pair FRET microscopy reveals mononucleosome dynamics. J. Fluoresc. 2007;17:785–795. doi: 10.1007/s10895-007-0218-9. [DOI] [PMC free article] [PubMed] [Google Scholar]
- 51.Garcia H.G., Grayson P., Wiggins P.A. Biological consequences of tightly bent DNA: the other life of a macromolecular celebrity. Biopolymers. 2007;85:115–130. doi: 10.1002/bip.20627. [DOI] [PMC free article] [PubMed] [Google Scholar]
- 52.Dorigo B., Schalch T., Richmond T.J. Nucleosome arrays reveal the two-start organization of the chromatin fiber. Science. 2004;306:1571–1573. doi: 10.1126/science.1103124. [DOI] [PubMed] [Google Scholar]
- 53.Zhou J., Fan J.Y., Tremethick D.J. The nucleosome surface regulates chromatin compaction and couples it with transcriptional repression. Nat. Struct. Mol. Biol. 2007;14:1070–1076. doi: 10.1038/nsmb1323. [DOI] [PubMed] [Google Scholar]
Associated Data
This section collects any data citations, data availability statements, or supplementary materials included in this article.