

Abstract
Atomic force microscopy can potentially provide information on protein volumes, shapes, and interactions but is susceptible to variable tip-induced artifacts. In this study, we present an atomic force microscopy approach that can measure volumes of nonglobular polypeptides such as structural maintenance of chromosomes (SMC) proteins, and use it to study the interactions that occur within and between SMC complexes. Together with the protein of interest, we coadsorb a DNA molecule and use it as a fiducial marker to account for tip-induced artifacts that affect both protein and DNA, allowing normalization of protein volumes from images taken on different days and with different tips. This approach significantly reduced the error associated with volume analysis, and allowed determination of the oligomeric states and architecture of the Bacillus subtilis SMC complex, formed by the SMC protein, and by the smaller ScpA and ScpB subunits. This work reveals that SMC and ScpB are dimers and that ScpA is a stable monomer. Moreover, whereas ScpA binds directly to SMC, ScpB only binds to SMC in the presence of ScpA. Notably, the presence of both ScpA and ScpB favored the formation of higher-order structures of SMC complexes, suggesting a role for these subunits in the organization of SMC oligomers.
Introduction
Atomic force microscopy (AFM) is an imaging technique that obtains topographic maps of nanoscale objects including proteins and nucleic acids providing structural and dynamic information on biochemical processes (1–6). From AFM images, it is possible to extract the volume of a particular object and this has been successfully applied to proteins and nucleoprotein complexes (7–15). Previous methods determined the volume of a protein by treating the molecule as a segment of a sphere and measuring several cross sections and their height (7). This approach suffers from tip-convolution artifacts: a particle smaller than the tip-dimensions will appear wider than it really is. Some approaches have overcome the tip-convolution effect by taking the width measurement at half-height as opposed to at the base of the protein (9), whereas others have used the basal width of the protein (12). Other methods assumed the shape of proteins to be oblate spheroids with an ellipsoidal shape (13). Wyman et al. (8), Beerens et al. (10), and van der Linden et al. (14) used a different approach in which the average height and area of a manually defined region around the protein of interest was determined. Similar methods incorporating automated particle tracking and image flooding allowed determination of protein-protein association constants (16).
Measurement of the volume above a certain basal plane also has the problem of tip-convolution, which overestimates the volume. Moreover, any imaging-related effect such as temperature drift, piezo creep, or artifacts related to tip-geometry will also influence the image and consequently the measured volume of the object, which in most of the cases is reported with a relative error of ∼20% (8,16). However, it can be reasoned that the image of a coadsorbed molecule of similar dimensions to the protein under study could be used as a volume reference, provided it is present in all experiments. Both protein and reference will be affected by any tip and/or imaging effect. Therefore, protein volume may be normalized by measurement relative to the marker, to give a dimensionless value directly related to the mass of the protein itself. Some previous approaches incorporated internal standards like the Ku70/80 heterodimer to study DNA-bound proteins (17).
Recently a report by van der Linden et al. (14) studied the Rad50/NBS1 complex, using the known stoichiometry of Rad50/Mre11 as reference volume. Approaches using proteins as molecular standards are problematic because these have to deal with potential specific or nonspecific interactions between both reference and target proteins. Moreover, they require the use of known proteins with a readily distinguishable morphology. Alternatively, independent experiments can be done with each protein, but that cannot guarantee identical imaging conditions. Our approach using a molecule of DNA as a fiducial marker circumvents all these issues because DNA displays a distinctive morphology and can almost certainly be coadsorbed with the protein of interest. Our method resulted in a robust and reliable technique, where volumes and oligomeric states of proteins as small as 22 kDa could be determined with errors <10%.
To illustrate our AFM method we studied the Bacillus subtilis structural-maintenance-of-chromosomes (SMC) protein complex, which is composed of three polypeptides: SMC, ScpA, and ScpB. All three components are required for chromosome compaction and faithful DNA segregation (18–21). At the core of the SMC complex is the SMC protein, a large polypeptide with a striking domain organization. Two canonical nucleotide-binding motifs, known as Walker A and B, are located separately at the N-terminal and C-terminal domains, respectively. Between the two motifs there are two long coiled coils that are connected by a noncoiled-coil sequence (hinge domain). Electron microscopy and biochemical studies have established that a SMC monomer folds back on itself through antiparallel coiled-coil interactions, creating an ATP-binding head domain at one end and a hinge domain at the other end (22–24). Two monomers associate with each other at the hinge domain to form a V-shaped molecule. Given their unusual architecture, SMC proteins present a challenging system for volumetric analysis. SMC interacts specifically with ScpA and ScpB, both in vivo and in vitro (19–21). ScpA contains a folding motif known as winged helix (25), and its C-terminal winged-helix domain binds directly to the SMC head domain (25). ScpB also contains two winged-helix motifs and dimerizes through its C-terminal half (26). It has been reported that ScpB interacts with the head domain of SMC in the presence of ScpA (20). The precise manner in which the SMC complex can tether and condense DNA molecules and the role of ATP, ScpA, and ScpB in this process are not understood, but many disparate models have been proposed (27,28).
Here we show that, by using DNA as a molecular marker, accurate and robust measurements of protein volumes can be achieved, which scale linearly with their molecular weights. We applied this method to characterize the oligomeric state and the interactions between the components of the SMC complex. We determined the dimeric state of SMC and ScpB proteins and discerned specific interactions between ScpA and ScpB and also between ScpA and SMC. The formation of higher-order structures as a function of the presence of SMC components was also investigated and the implications of these findings for the organization of the SMC complex are discussed.
Materials and Methods
Plasmids and DNA substrate preparation
Plasmids for the expression of the SMC complex components, pET22b-SMC, pET28a-ScpA, or pET22b-ScpB, were generated by PCR-based cloning of the B. subtilis smc, ypug, and ypuh genes using primers flanked by appropriate restriction enzymes for the multiple cloning sites in pET vectors (Novagen, Darmstad, Germany). The E1118Q mutation was introduced into the pET22b-SMC vector by site-directed mutagenesis using the QuikChange II method (Stratagene, La Jolla, CA). The integrity of the DNA sequence in each vector was confirmed by direct sequencing (DNA Sequencing Service, University of Dundee, Dundee, UK). The linear DNA molecules used as a marker in the volumetric studies are 323-bp-long and were fabricated with PCR using the upstream and downstream control primers and the positive control plasmid DNA supplied in the GoTaq PCR Core System II (Promega, Madrid, Spain).
Protein preparations
AddAB and SSB proteins were prepared as described previously in Yeeles and Dillingham (29) and Yeeles et al. (30). A detailed protocol for SMC, ScpA, and ScpB expression and purification can be found in the Supporting Material. Purified proteins are shown in Fig. S1 in the Supporting Material.
Analytical ultracentrifugation
ScpA, ScpB, and SMC were dialyzed into a buffer containing 50 mM Tris pH 7.5, 100 mM NaCl, and 1 mM EDTA before analytical ultracentrifugation (AUC). In the case of SMC, 0.1 mM DTT was also included that prevented aggregation (data not shown). Sedimentation equilibrium experiments were performed at 4°C in an Optima XLA analytical ultracentrifuge (Beckman Instruments, Palo Alto, CA), and scans were taken by measuring the absorbance at 280 nm. Three concentrations of each protein were analyzed, giving three different OD280 readings, to take into account any concentration effects. The OD280 readings for ScpB were 0.2, 0.3, and 0.6; for ScpA were 0.2, 0.3, and 0.5; and for SMC were 0.2, 0.4, and 0.7. Cells were spun, using a rotor speed of 8000 rpm for SMC and 16,000 rpm for ScpA and ScpB, until equilibrium distributions were obtained. Baselines were determined for fitting by overspeeding cells at the end of the run. Theoretical buffer densities and protein partial specific volumes were calculated using the program SEDNTERP (freeware, www.jphilo.mailway.com/download.htm). In each case, the data for the three concentrations were globally fitted to Eq. 1 using MicroCal Origin (OriginLab, Northampton, MA) and the best fits were obtained using a single species fit,
| (1) |
where MW is the molecular weight; Ar and A0 are the absorbances at radius r and at the reference r0, respectively; is the partial specific volume; ρ is the buffer density; ω is the angular velocity; and B is the baseline offset.
AFM sample preparation and imaging
For imaging individual proteins, these were first diluted from stock in buffer EB (20 mM Tris-Cl pH 7.5, 5 mM NaCl, 0.25 mM MgCl2) to a final concentration of 16.3 nM (SMCE1118Q), 24 nM (ScpA), and 18 nM (ScpB). Then, protein dilutions were supplemented with DNA and MgCl2 to obtain a final concentration of 3.3 nM and 7.5 mM, respectively, and placed onto a freshly cleaved mica surface. After 30 s, the mica surface was washed with filtered-MilliQ water (Millipore, Billerica, MA) and blown dry in a gentle stream of nitrogen gas.
To study protein-protein interactions, protein components were mixed in EB at near micromolar concentration (SMCE1118Q (0.74 μM), ScpA (1.1 μM), and ScpB (0.82 μM)) and incubated for 2 min at room temperature. For the experiment involving the three proteins, we first incubated SMC and ScpA for 2 min and then added ScpB for two additional minutes. Then, for AFM imaging the mixture was diluted to nanomolar concentrations, supplemented with DNA and MgCl2, and quickly placed onto a mica surface following the protocol used to observe individual proteins.
Samples were imaged in air at room temperature and low humidity using tapping mode with amplitudes of 5 nm and scan rates of 2 lines · s−1. We used an AFM from Nanotec (Nanotec Electrónica, Madrid, Spain) and PointProbePlus tips, type PPP-NCH (Nanosensors, Neuchâtel, Switzerland). Standard image processing before volume measurements consisted of plane subtraction and flattening using WSxM freeware (31). Data were collected for several days, under different imaging conditions and with different AFM probes; ∼100 particles were analyzed for each type of protein. In contrast with liquid imaging where DNA and proteins showed a different phase shift (32,33), we did not observe this effect in air.
For most of the work presented in this article we have employed an SMC mutant (SMCE1118Q) that can bind but not hydrolyze ATP (20) with a view to studying the role of ATP in the formation of higher-order structures in future work. Key experiments were repeated with the wild-type SMC proteins and produced identical results (see Fig. S6).
Determination of protein volumes
Raw AFM data were converted into a two-dimensional ASCII matrix file to be further processed with a custom-made software programmed in LabView (National Instruments, Austin, TX). We opted for a custom-made application to gain flexibility and control of the data analysis but other software packages have proven successful (8,16). Our software allowed the selection of an M × N pixel window and calculation of the volume using the equation
| (2) |
where hij is the measured height at a pixel of coordinates i, j; p is the pixel size (0.98 nm in our experiments); and the sum is made over all M rows and N columns.
In addition to previously reported methods, we calculated a background noise volume density ρbackground (in nm3 per area unit), which allowed consideration of image windows of different sizes. We first determined the average height (Hplane) of the surface from height histograms in several bare areas without proteins or DNA molecules. Then we measured the volume above the basal plane (Vbackground) and divided it by the area of the image to obtain a background noise volume density ρbackground (in nm3 per area unit). This number includes any contaminant of the sample and mechanical or electrical noise of the apparatus and is taken into consideration when measuring volumes of protein or DNA molecules (VAFM) as
| (3) |
for hij > Hplane (see Fig. S2 for an example and more details). Incorporation of Vbackground into Eq. 2 is critical when considering nonglobular proteins that can potentially adopt different conformations covering different areas. For instance, the SMC volume is overestimated by 7% if the noise background is not considered. Typical standard deviation of a single-species volume histogram was <10%.
Protein volumes (Vprotein) were normalized by a reference volume (Vreference) and shown as histograms with a bin size of 0.3 for experiments involving SMC, and of 0.05 for experiments with only ScpA and ScpB. As the reference volume, we considered a fragment of DNA contained in a window of 20 nm × 20 nm. We found this window size to be optimum as trials using a smaller window (10 nm × 10 nm) underestimated the volume of the DNA and larger windows (30 nm × 30 nm) yielded a wide volume distribution due to the different conformations of the DNA in this area (data not shown). Counts were normalized by the total number of events.
Results
Using DNA as a volume reference for atomic force microscopy
We coadsorbed the SMC protein (SMCE1118Q mutant) together with a 323-bp-long DNA molecule on a flat mica surface and imaged them in air (Fig. 1 a). DNA is now routinely used in many AFM studies and several adsorbing protocols have been developed (34–36). We opted for a magnesium-based adsorbing protocol, as under these conditions DNA adheres to a mica surface weakly enough that DNA-mica interactions do not affect the intrinsic polymer mechanical properties and specific protein-DNA interactions are preserved (35). The two different object classes (DNA and protein) were easily distinguished because of the characteristic wormlike shape of DNA. SMC proteins appeared as flexible structures of 45 ± 6 nm length with heights between 5 and 9 Å (mean height of 7 ± 1 Å), clearly lower than the DNA, the height of which was 1.1 ± 0.1 nm in agreement with Moreno-Herrero et al. (37). A small area including each protein of interest was selected and all of these images were further processed by subtraction of the basal surface and noise background (see Materials and Methods and Fig. S2 for details). A histogram of protein volumes (Fig. 1 b) was constructed from experiments conducted with different samples, on different days and with different AFM tips. Two peaks centered at 276 ± 38 nm3 and 545 ± 87 nm3 were identified, corresponding to two-arm (Fig. 1 c) and one-arm SMC structures (Fig. 1 d), respectively. The high variability of volumes mainly arises from the use of different probes and imaging conditions.
Figure 1.
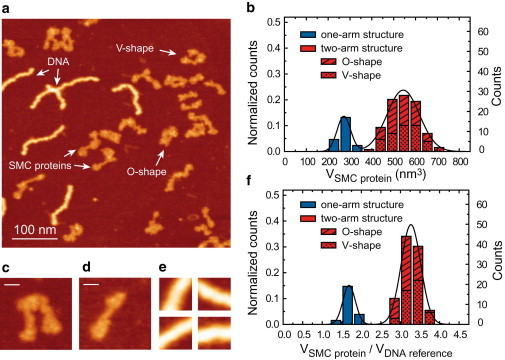
Volumetric analysis of the SMC protein using DNA as a fiducial marker. (a) High-resolution AFM image of the SMC protein and fragments of DNA of 323 bp used as fiducial markers. (b) Histogram showing the volume of SMC proteins obtained without normalization with the DNA marker, as described in Materials and Methods and in Fig. S2 in the Supporting Material. (c) Example of a two-arm structure. (d) Example of a one-arm structure. (e) Panel with examples of 20 × 20 nm images used to measure the reference volume of DNA. (f) Histogram showing the normalized volume of SMC proteins by the reference volume. Two-arm SMC structures adopted either a V- or an O-shape conformation in approximately equal proportions (see arrows in panel a) and this information is included in panels b and f. The bar size in panels c and d is 15 nm. Color scale (from dark to bright) is 0–2 nm.
In an attempt to eliminate this experimental source of noise, we employed the DNA as a fiducial volume reference. We chose a square window of 20 nm × 20 nm and measured the volume of the DNA in that area as described in Materials and Methods. The size of the reference window was chosen to be large enough to completely include a linear fragment of DNA and to produce a volume comparable with protein volumes with the minimum dispersion (see Fig. 1 e for some examples). For each AFM image, a reference DNA volume was obtained, which was used to normalize the protein volumes of each image improving the results histogram, with the relative error of the two peaks substantially reduced (Fig. 1 f). Absolute reference volumes were plotted in a histogram showing a Gaussian distribution centered at 167 nm3 (SD: 28 nm3, N = 1039; data not shown).
Notably, although the absolute reference volumes were measured with relative errors of ∼17%, normalization of each image reduced the relative errors for each protein to approximately half that value. The high resolution achieved in these images allowed us to distinguish between a V-shape and O-shape conformation of two-arm SMC structures (see arrows in Fig. 1 a) and this information was incorporated into the histograms shown in Fig. 1, b and f. Approximately half of the two-arm SMC structures adopted a V-shaped conformation, and half an O-shaped conformation. The method described above allowed the determination of a relative protein volume with high precision, but de novo assignment of that volume to a particular oligomeric state of the protein requires further information from conventional biochemical analyses. To assign a molecular mass to each peak of the volume analysis we used analytical ultracentrifugation to investigate the individual components of the SMC complex.
The oligomeric state of the components of the SMC complex
Each SMC component was purified to homogeneity using purification methods that do not involve extrinsic tags (see Fig. S1). Analytical ultracentrifugation showed that SMC, ScpA, and ScpB existed in solution as a dimer, a monomer, and a dimer, respectively (Fig. 2, and see Table S1 in the Supporting Material for molecular weight of proteins). These conclusions are in broad agreement with those from several other studies, but we see no evidence for ScpA dimerization in the absence of other SMC components (20,38,39). We then applied the AFM method described above to each protein (Fig. 3). In all cases, the difference in shape, length, and height between the proteins and the DNA was obvious, and this facilitated protein identification and volume analysis. As shown previously, analysis of the SMC sample yielded two different species that differ in apparent volume by a factor of two (Fig. 3 a).
Figure 2.
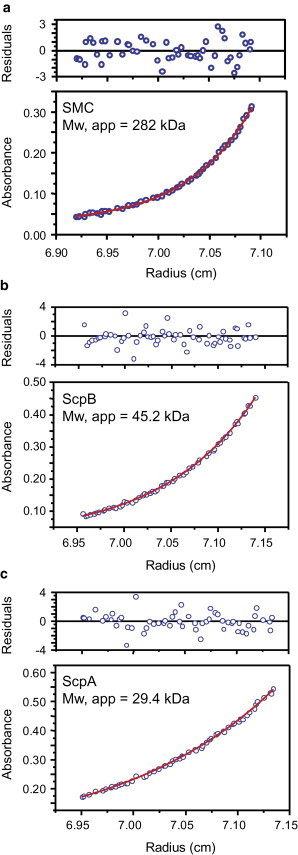
Analytical ultracentrifugation of SMC complex components. Representative analytical ultracentrifugation traces are shown for each component of the SMC complex: SMC (a), ScpB (b), and ScpA (c). The apparent molecular weights were determined by globally fitting data for three different concentrations of each protein to Eq. 1 as described in the Materials and Methods. The apparent molecular weights are in good agreement with the expected molecular weights for an SMC dimer (271 kDa), a ScpB dimer (44 kDa), and a ScpA monomer (30 kDa).
Figure 3.
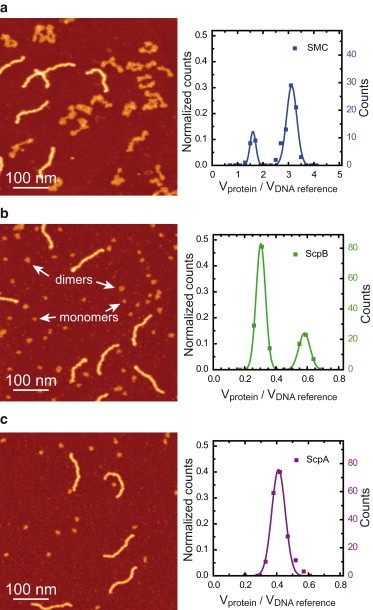
AFM volumetric analysis of SMC complex components. (a) AFM image (left) and histogram of normalized volumes (right) of the SMC polypeptide. Approximately 75% of the proteins considered (N = 94) fall into to the larger-volume peak. (b) AFM image (left) and histogram of normalized volumes (right) of ScpB proteins. (Arrows) Examples of ScpB monomers and dimers. Approximately 75% of proteins considered (N = 171) fall into the smaller-volume peak. (c) AFM image (left) and histogram of normalized volumes (right) of ScpA proteins (N = 185). Color scale (from dark to bright) is 0–2 nm in all AFM images.
A similar result was found for ScpB with normalized volumes of 0.30 ± 0.03 and 0.58 ± 0.04 (Fig. 3 b). In contrast, the ScpA sample showed a single peak (Fig. 3 c). Given that SMC and ScpB were shown to form dimers at micromolar concentrations using AUC, we can rationalize the two-peak histograms obtained using volume analysis as reflecting a mixed population of monomers and dimers at the lower (nanomolar) concentrations of protein deposited on the AFM grid. The single peak obtained for ScpA using volume analysis must correlate with the monomeric species observed at higher concentrations using AUC. To extend the applicability of these methods to other proteins of unknown mass we studied further the relationship between relative protein volume and molecular weight.
Relative AFM volume is approximately proportional to molecular weight
We have seen that our AFM volume analysis can be used for both globular proteins such as ScpA and ScpB as well as for nonglobular proteins like SMC. Moreover, despite their large difference in mass, we measured a volume for each dimer species that was almost exactly twice the volume of the monomeric form, suggesting that this method might provide a reliable measurement of relative molecular weights. To test this further and to extend our analysis to other proteins with different shapes and molecular weights we performed a volume analysis for the B. subtilis AddAB complex and SSB protein. AddAB is a helicase-nuclease that processes double-stranded DNA breaks for repair by homologous recombination. It is a stable heterodimer composed of the AddA and AddB subunits with an overall mass of 276 kDa. The AFM analysis of AddAB protein coadsorbed with DNA yielded a single peak centered at 3.3 ± 0.4 (see Fig. S3 a).
SSB protein is a nonspecific single-stranded DNA binding protein with multiple roles in the replication and maintenance of DNA, including acting as an essential cofactor for unwinding of DNA by AddAB enzyme (30). SSB protein is a stable homo-tetramer with a molecular mass of 74 kDa that displays a tendency to aggregate into higher-order oligomeric states under conditions of low ionic strength (40). Our first attempts to image SSB using buffers with very low salt concentrations yielded protein aggregates with normalized volumes of 1.4 ± 0.2 (data not shown). Further experiments using 100 mM NaCl provided a measurement for the major species of SSB of 0.9 ± 0.2, but an extended tail was present with two smaller but well-defined peaks. The additional peaks are at 1.8 ± 0.3 and 2.9 ± 0.3—approximately two and three times the volume of the major peak, respectively (see Fig. S3 b). Protein volumes were normalized by using the DNA reference method and were plotted as a function of their molecular weight by incorporating the known information about their oligomeric state from analytical ultracentrifugation (Fig. 4). Remarkably, the AFM data were very well described by a linear function with a slope of K = 11.5 ± 0.2 × 10⁻³ kDa−1 and an offset C = 0.06 ± 0.01 (see Eq. 4 and Table S1 for values for K for each protein),
| (4) |
where Vprotein is the AFM measurement of the volume of a protein or a protein complex, Vreference is the AFM measurement of the volume of the DNA reference, C is the offset at mass zero, K is a constant with kDa−1 units, and MW is the molecular weight of a protein or protein complex in kDa. These results show that the normalized volumes measured with AFM are almost directly proportional to the protein mass in agreement with previous studies (8,9,16). A potential effect of other physical properties like charge in the volume measurement was not observed within our current resolution. Notably, the use of a normalization volume significantly reduced the dispersion of the data, as can be observed in the plot of absolute protein volumes (compare Fig. 4 with Fig. S4). The slope of the fit mainly depends on the fiducial maker considered and is therefore arbitrary for our particular experimental conditions. It also includes information related to the physical properties of the protein and the interaction with the tip. In any case, this empirical relationship indicates that our method can be used to determine the molecular weight de novo for any other protein system, provided the same fiducial marker and experimental conditions are employed.
Figure 4.
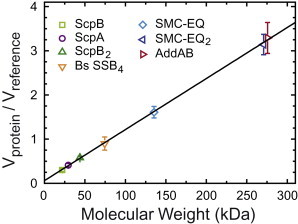
Normalized protein volumes determined by AFM are nearly proportional to known molecular weights. The molecular weights of the proteins shown in this graph are described in Table S1 in the Supporting Material. They span from 22 to 300 kDa. Over this range, normalized volumes follow a linear relationship with molecular weights (Eq. 4). They display a slope of 11.5 ± 0.2 × 10⁻³ kDa−1 and an offset at zero mass of 0.06 ± 0.01.
Interactions between the components of the SMC complex
Dynamic interactions between the components of the SMC complex are thought to play a crucial role in the functional mechanism of condensins. We applied our AFM method to study interactions between protein components of the SMC complex. We first studied the interaction between SMC and ScpA, with the small ScpA subunit in slight stoichiometric excess. As expected, a simple inspection of the images showed small globular objects (ScpA alone), SMC dimers, and DNA (Fig. 5 a). Despite the superficial similarity of the SMC dimers with those observed in the absence of ScpA (compare Figs. 5 a and 2 a), the volumetric analysis indicated a clear interaction between ScpA and SMC. The two peaks that correspond to a monomer of SMC and a dimer of SMC were shifted by 26% and 21% from their original positions. A simple calculation for a 1:1 complex between SMC and ScpA gives an increase of 18% in the mass of SMC upon binding a stoichiometric equivalent of ScpA.
Figure 5.
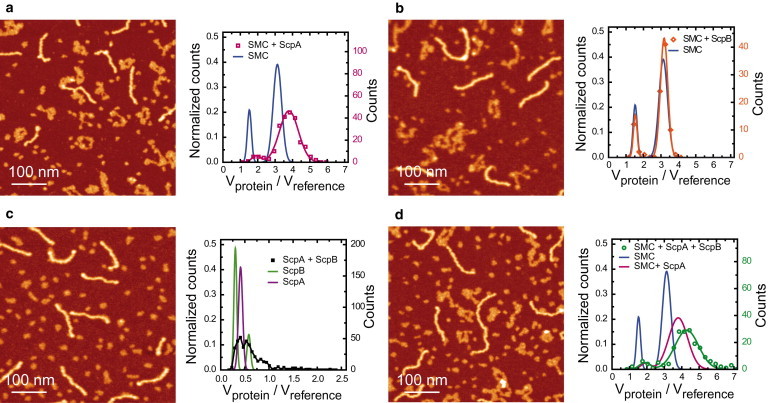
Interactions between the components of the SMC complex. (a) AFM image (left) and histogram of normalized volumes (right) for mixtures of SMC and ScpA proteins (N = 226). ScpA binds to SMC as a monomer. (b) AFM image (left) and histogram of normalized volumes (right) for mixtures of SMC and ScpB proteins (N = 91). ScpB does not interact with SMC. (c) AFM image (left) and histogram of normalized volumes (right) for mixtures of ScpA and ScpB proteins (N = 253). A tail at high molecular weights corresponding to complexes involving both proteins was observed. (d) AFM image (left) and histogram of normalized volumes (right) for mixtures of SMC, ScpA, and ScpB proteins (N = 186). ScpB is incorporated into the SMC complex but only in the presence of ScpA. Color scale (from dark to bright) is 0–2 nm in all AFM images.
A similar experiment was performed for SMC and ScpB (Fig. 5 b). In this case, the volume of SMC remained unaltered, suggesting that the two proteins do not interact. Gel filtration experiments (Fig. S5, a–c) confirmed these results. By mixing components together and resolving the complexes by gel filtration, it was shown that ScpA was able to interact with either (or both) SMC and ScpB, but there was no evidence for a direct interaction between SMC and ScpB. A third experiment was performed to study the interaction between ScpA and ScpB (Fig. 5 c). The similar masses of both proteins make them indistinguishable by eye, but the volume analysis indicated the presence of larger structures only observed when both proteins were incubated together. Note that a ScpA-ScpB complex would correspond to a peak centered at 0.65 and that would overlap with the ScpB2 peak. A ScpA-ScpB2 complex would have a peak at 0.93, and indeed, a representative population of complexes was found around this volume. Larger complexes were also found but at very low frequency. Finally, the volume of protein complexes involving SMC, ScpB, and ScpA was plotted in a histogram (Fig. 5 d). Addition of ScpB into the binding reaction shifted the previous SMC2-ScpA2 peak by a further 13%. This suggested that ScpB binds to SMC but only in the presence of ScpA, as observed in the gel filtration experiments (Fig. S5 d). Experiments using the wild-type SMC protein produced identical results (Fig. S6).
Next we investigated the multimerization of SMC in the presence of its accessory proteins. Notably, the presence of both ScpA and ScpB prompted the formation of larger structures involving multiple SMC dimers that resulted in a tail in the volume histogram (Fig. 6 a). SMC dimers assembled into distinctive structures characterized by a brighter (therefore, higher) region surrounded by well-defined SMC coiled-coils. We named these “SMC multimers” to distinguish them from other higher-order structures with less clearly defined morphologies that we term “SMC aggregates”. These aggregates were indeed composed of SMC proteins because experiments without SMC never yielded volumes of this magnitude. Examples of SMC multimers and aggregates are shown in Fig. 6, b and c. SMC multimers formed in the presence of ScpA and ScpB at moderate frequency (∼18% of total SMC dimers). This fraction dropped to a negligible 2% or lower when only ScpA or ScpB were present in the protein mixture (Fig. 6 d), suggesting a role for the association of ScpA and ScpB in bridging SMC proteins.
Figure 6.
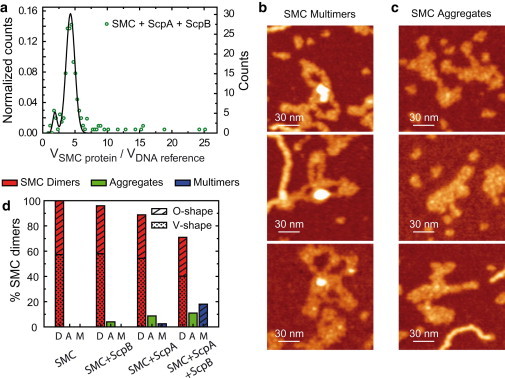
ScpA and ScpB promote formation of higher-order SMC complexes containing multiple SMC dimers. (a) Normalized volume histogram (as in Fig. 5d) showing an extended tail, which corresponds to structures with several SMC dimers. (b) Panel with examples of SMC multimers (see text for definition). (c) Panel with examples of SMC aggregates (see text for definition). (d) Fraction of SMC dimers (D), aggregates (A), and multimers (M) found in experiments with SMC; SMC and ScpB; SMC and ScpA; and SMC and ScpA and ScpB. The fraction of O- and V-shape SMC structures is also indicated in the histogram. Color scale (from dark to bright) is 0–2 nm.
SMC aggregates were also more prone to form in the presence of ScpA and ScpB (∼11% of total SMC dimers). Interestingly, all of the SMC dimers involved in a multimer showed an O-shape conformation in contrast with only ∼50% for free SMC dimers (Figs. 1 f and 6 d, first column). Previous data showed that dimerization of SMC occurs via the hinge domains (24). Therefore, this suggests that multimerization occurs via the head domains, provided the hinge-hinge SMC dimer interaction remains stable. We did not observe the rosettelike structures involving many SMC proteins that have been reported previously (39). In contrast, the measurement of the volumes of the higher-order structures observed here indicated that they were composed of a small number of SMC dimers (<4) (Fig. 6 a).
Discussion
In this report, we have presented a simple method to determine relative volumes using AFM. This method employs a fragment of DNA as a fiducial reference volume. Because the reference volume accounts for several AFM artifacts (tip-convolution, dehydration, tip-compression, drift, etc.) its use as a normalization standard increased the reproducibility and precision of the data. DNA normalization and subtraction of the background volume (see Materials and Methods and Fig. S2) allowed determination of volumes within a 6–10% error. The proposed methodology was tested using a range of proteins and protein complexes including nonglobular proteins. Specifically, we investigated the stoichiometry of the components of the SMC complex from B. subtilis and the interactions between its protein components.
Using DNA as a fiducial marker is advantageous for several reasons. First, it has a height that is similar to many proteins (between 1 and 4 nm) and this is important when minimizing tip-convolution effects, which are mainly influenced by the height of the object. DNA also possesses a characteristic morphology in AFM, such that DNA molecules are easily recognizable as a wormlike chain and differentiated from the protein of interest. Furthermore, DNA is fully compatible with protein buffers and there are many adsorption protocols that can immobilize both proteins and DNA on the same mica surface. This approach decreased the error associated with volume measurements and allowed direct comparison of measurements taken on different days and under different experimental conditions. Previous approaches for measuring protein volumes have required an accurate measurement of the height of the protein (12). In that case, a precise calibration of the AFM is crucial, and electron-microscopy gold-standards of 5 nm were used. However, it is known that heights in AFM can vary substantially depending on the imaging conditions (41). Moreover, the adsorption of gold particles is not trivial and requires a polylysine-coated mica, which may be undesirable for studies involving DNA (35).
Recently, van der Linden et al. (14) reported the use of proteins as fiducial markers, which reduced the relative error in the determination of protein masses. However, for many studies this strategy may not be an option because reference and target proteins may not be easily distinguishable or might interact. The characteristic morphology of DNA overcomes this issue and the use of DNA as a marker coadsorbed with proteins on the same surface will cancel any height inconsistency because, regardless of the imaging conditions used, these will affect both reference and protein. One might imagine that the use of DNA as a fiducial marker might preclude the possibility of studying proteins that interact with nucleic acids. In practice, however, protein interactions with DNA do not present a problem for monitoring the volume of the marker. For instance, the volume of AddAB, a particularly tight DNA end-binding protein (29), was studied successfully in this work. Nevertheless, we recognize that difficulties are likely to be encountered in the study of nucleoprotein filament-forming proteins like RecA or SSB. In this case, gold nanoparticles may be a better choice.
Our method was shown to be successful for a variety of proteins and protein-protein interactions. Volume distributions of single proteins were determined within a 6–10% error, in contrast with other reported methods in which the error is closer to 20% (8,16). Moreover, we were able to detect proteins as small as 22 kDa, providing a new lower limit for volume quantification with AFM. Interestingly, we observed that interaction between different proteins resulted in wider distributions. In particular, interaction between SMC and ScpA and between SMC and ScpA and ScpB yielded distributions with widths increasing up to 20% of the center of the peak. A possible explanation for this observation may be the partial dissociation of the components of a protein complex due to the low concentration used for adsorption on the mica (tens of nanomolar).
To gain further insight into this possible dissociation process, we studied the distribution of volumes measured at different final concentrations and at different times after dilution (data not shown). The monomer/dimer ratio of SMC is insensitive to the delay between protein dilution and immobilization on the mica, likely indicating that the association and dissociation of SMC dimers occurs on a rapid timescale compared to the one for the dilution and imaging of the sample. ScpB was rather prone to dissociation at low molarities, which might explain the broadening of the volume distributions for complexes containing this subunit (see below). The AUC analysis shows that the dissociation constant for ScpB dimers is <∼10 μM (the lowest concentration used). Therefore, the large population of ScpB monomers in the AFM experiment suggests a dissociation constant in the midnanomolar range. However, we note that the relevant parameter here is the kinetics of the dissociation process. By reducing the time between dilution and adsorption it will be possible to study protein complexes with weak association constants.
Our results regarding the stoichiometry of interactions between SMC components are in agreement with previous coimmunoprecipitation experiments (20). Essentially, we found that ScpB does not interact with SMC whereas ScpA does bind to SMC. This was evidenced by a clear shift of the relative volumes of products of reactions with SMC and ScpA (Fig. 5 a). The fact that ScpA is a monomer (Fig. 2 c) and that the shift of the SMC dimer volume is twice that of the monomer indicates that a single ScpA protein binds to each SMC protomer, suggesting a stoichiometry for this complex of SMC2A2. This stoichiometry may be controlled by ATP binding and hydrolysis as shown for MukBEF (42) and our methods could be useful to investigate this further. Hirano and Hirano (20) have shown that ScpA binds to the catalytic head domains of SMC, but our current AFM images were not able to discern this because of the large morphological variability in the SMC complex.
Use of sharper AFM tips and truncated versions of SMC should improve the AFM resolution and address the binding location of ScpA, and this is also the subject of further investigation. AFM analysis of ScpA-ScpB reactions showed that these two proteins interact to form larger complexes and subsequent experiments involving SMC, ScpA, and ScpB showed that all three proteins are combined in a complex (Fig. 5 d). Recently, Woo et al. (42) described the structure of MukEF as MukE4F2 and, although these proteins are rather distantly related to the Bacillus Scp subunits at the level of primary structure, this may suggest a stoichiometry of ScpB4-ScpA2. Our data showed a population of complexes that were consistent with an association of ScpB2-ScpA, as well as larger objects at low frequency. However, the weak association constant of ScpB as well as the relatively low resolution of this method precludes an unequivocal description of this complex.
Importantly, our work showed that protein complexes containing all three SMC components were able to form higher-order structures with multiple SMC dimers. These structures appeared only at a moderate frequency and involved up to four SMC dimers. This is in contrast with previous AFM work reporting rosettelike multimerization of B. subtilis SMC protein alone (39), but more similar to previous work comparing the morphology of MukB and MukBEF complexes (43). We did not observe any SMC multimerization in the absence of ScpA or ScpB, which suggests a role for these proteins in linking SMC proteins. Moreover, the fact that all of the SMC dimers involved in a higher-order structure presented a ringlike (O-shape) conformation suggests that multimerization involves tethering of the head domains via ScpA and ScpB.
Interestingly, we showed that the presence of the ScpB subunit was of particular importance for the formation of the structures that we defined as “multimers” (Fig. 6). This may reflect the formation of bridging ScpB-ScpB interactions between SMC complex protomers to promote the formation of higher-order SMC complexes, and would be consistent with the alternative dimerization interface for MukE detected in a recent crystal structure of MukEF (44). These interactions are important for MukBEF function and may well be relevant to the mechanism for DNA condensation (44), for which most models invoke SMC multimerization (27,45). It should be noted that the tendency of ScpB to dissociate at low molarities might contribute to the low frequency of SMC oligomers detected in AFM experiments. Alternatively, the role of ScpA and ScpB in multimerization may be auxiliary to the control by ATP binding in SMC, and this will be studied in further experiments.
Acknowledgments
We are grateful to Carolina Carrasco, Benjamin Gollnick, and Neville Gilhooly for their comments on the manuscript.
This work was supported by a Starting Grant from the European Research Council (No. 206117 to M.E.F.-P., E.J.G., M.S.D., and F.M.-H.); by grants from the Spanish Ministry of Science and Innovation (Nos. FIS2008-0025 and FIS2011-24638 to F.M.-H.); by the Wellcome Trust (grant No. 077368); and by a Royal Society University Research Fellowship (to M.S.D.). M.E.F.-P. was also supported by a contract from the Consejo Superior de Investigaciones Científicas (contract No. 200920I123).
Footnotes
This is an Open Access article distributed under the terms of the Creative Commons-Attribution Noncommercial License (http://creativecommons.org/licenses/by-nc/2.0/), which permits unrestricted noncommercial use, distribution, and reproduction in any medium, provided the original work is properly cited.
Supporting Material
References
- 1.Binnig G., Quate C.F., Gerber C. Atomic force microscope. Phys. Rev. Lett. 1986;56:930–933. doi: 10.1103/PhysRevLett.56.930. [DOI] [PubMed] [Google Scholar]
- 2.Bustamante C., Keller D. Scanning force microscopy in biology. Phys. Today. 1995;48:32–38. [Google Scholar]
- 3.Stroh C., Wang H., Hinterdorfer P. Single-molecule recognition imaging microscopy. Proc. Natl. Acad. Sci. USA. 2004;101:12503–12507. doi: 10.1073/pnas.0403538101. [DOI] [PMC free article] [PubMed] [Google Scholar]
- 4.van Noort J., Verbrugge S., Dame R.T. Dual architectural roles of HU: formation of flexible hinges and rigid filaments. Proc. Natl. Acad. Sci. USA. 2004;101:6969–6974. doi: 10.1073/pnas.0308230101. [DOI] [PMC free article] [PubMed] [Google Scholar]
- 5.Lia G., Indrieri M., Dunlap D. ATP-dependent looping of DNA by ISWI. J. Biophoton. 2008;1:280–286. doi: 10.1002/jbio.200810027. [DOI] [PMC free article] [PubMed] [Google Scholar]
- 6.Eghiaian F., Schaap I.A. Structural and dynamic characterization of biochemical processes by atomic force microscopy. Methods Mol. Biol. 2011;778:71–95. doi: 10.1007/978-1-61779-261-8_6. [DOI] [PubMed] [Google Scholar]
- 7.Henderson R.M., Schneider S., Oberleithner H. Imaging ROMK1 inwardly rectifying ATP-sensitive K+ channel protein using atomic force microscopy. Proc. Natl. Acad. Sci. USA. 1996;93:8756–8760. doi: 10.1073/pnas.93.16.8756. [DOI] [PMC free article] [PubMed] [Google Scholar]
- 8.Wyman C., Rombel I., Kustu S. Unusual oligomerization required for activity of NtrC, a bacterial enhancer-binding protein. Science. 1997;275:1658–1661. doi: 10.1126/science.275.5306.1658. [DOI] [PubMed] [Google Scholar]
- 9.Schneider S.W., Lärmer J., Oberleithner H. Molecular weights of individual proteins correlate with molecular volumes measured by atomic force microscopy. Pflugers Arch. 1998;435:362–367. doi: 10.1007/s004240050524. [DOI] [PubMed] [Google Scholar]
- 10.Beerens N., Hoeijmakers J.H., Wyman C. The CSB protein actively wraps DNA. J. Biol. Chem. 2005;280:4722–4729. doi: 10.1074/jbc.M409147200. [DOI] [PubMed] [Google Scholar]
- 11.Shlyakhtenko L.S., Gilmore J., Lyubchenko Y.L. Direct visualization of the EcoRII-DNA triple synaptic complex by atomic force microscopy. Biochemistry. 2007;46:11128–11136. doi: 10.1021/bi701123u. [DOI] [PubMed] [Google Scholar]
- 12.Neaves K.J., Cooper L.P., Henderson R.M. Atomic force microscopy of the EcoKI Type I DNA restriction enzyme bound to DNA shows enzyme dimerization and DNA looping. Nucleic Acids Res. 2009;37:2053–2063. doi: 10.1093/nar/gkp042. [DOI] [PMC free article] [PubMed] [Google Scholar]
- 13.Minh P.N., Devroede N., Charlier D. Insights into the architecture and stoichiometry of Escherichia coli PepA∗DNA complexes involved in transcriptional control and site-specific DNA recombination by atomic force microscopy. Nucleic Acids Res. 2009;37:1463–1476. doi: 10.1093/nar/gkn1078. [DOI] [PMC free article] [PubMed] [Google Scholar]
- 14.van der Linden E., Sanchez H., Wyman C. RAD50 and NBS1 form a stable complex functional in DNA binding and tethering. Nucleic Acids Res. 2009;37:1580–1588. doi: 10.1093/nar/gkn1072. [DOI] [PMC free article] [PubMed] [Google Scholar]
- 15.Shlyakhtenko L.S., Lushnikov A.Y., Lyubchenko Y.L. Atomic force microscopy studies provide direct evidence for dimerization of the HIV restriction factor APOBEC3G. J. Biol. Chem. 2011;286:3387–3395. doi: 10.1074/jbc.M110.195685. [DOI] [PMC free article] [PubMed] [Google Scholar]
- 16.Ratcliff G.C., Erie D.A. A novel single-molecule study to determine protein-protein association constants. J. Am. Chem. Soc. 2001;123:5632–5635. doi: 10.1021/ja005750n. [DOI] [PubMed] [Google Scholar]
- 17.Verhoeven E.E., Wyman C., Goosen N. The presence of two UvrB subunits in the UvrAB complex ensures damage detection in both DNA strands. EMBO J. 2002;21:4196–4205. doi: 10.1093/emboj/cdf396. [DOI] [PMC free article] [PubMed] [Google Scholar]
- 18.Britton R.A., Lin D.C., Grossman A.D. Characterization of a prokaryotic SMC protein involved in chromosome partitioning. Genes Dev. 1998;12:1254–1259. doi: 10.1101/gad.12.9.1254. [DOI] [PMC free article] [PubMed] [Google Scholar]
- 19.Mascarenhas J., Soppa J., Graumann P.L. Cell cycle-dependent localization of two novel prokaryotic chromosome segregation and condensation proteins in Bacillus subtilis that interact with SMC protein. EMBO J. 2002;21:3108–3118. doi: 10.1093/emboj/cdf314. [DOI] [PMC free article] [PubMed] [Google Scholar]
- 20.Hirano M., Hirano T. Positive and negative regulation of SMC-DNA interactions by ATP and accessory proteins. EMBO J. 2004;23:2664–2673. doi: 10.1038/sj.emboj.7600264. [DOI] [PMC free article] [PubMed] [Google Scholar]
- 21.Soppa J., Kobayashi K., Moriya S. Discovery of two novel families of proteins that are proposed to interact with prokaryotic SMC proteins, and characterization of the Bacillus subtilis family members ScpA and ScpB. Mol. Microbiol. 2002;45:59–71. doi: 10.1046/j.1365-2958.2002.03012.x. [DOI] [PubMed] [Google Scholar]
- 22.Melby T.E., Ciampaglio C.N., Erickson H.P. The symmetrical structure of structural maintenance of chromosomes (SMC) and MukB proteins: long, antiparallel coiled coils, folded at a flexible hinge. J. Cell Biol. 1998;142:1595–1604. doi: 10.1083/jcb.142.6.1595. [DOI] [PMC free article] [PubMed] [Google Scholar]
- 23.Haering C.H., Löwe J., Nasmyth K. Molecular architecture of SMC proteins and the yeast cohesin complex. Mol. Cell. 2002;9:773–788. doi: 10.1016/s1097-2765(02)00515-4. [DOI] [PubMed] [Google Scholar]
- 24.Hirano M., Hirano T. Hinge-mediated dimerization of SMC protein is essential for its dynamic interaction with DNA. EMBO J. 2002;21:5733–5744. doi: 10.1093/emboj/cdf575. [DOI] [PMC free article] [PubMed] [Google Scholar]
- 25.Haering C.H., Schoffnegger D., Löwe J. Structure and stability of cohesin's SMC1-kleisin interaction. Mol. Cell. 2004;15:951–964. doi: 10.1016/j.molcel.2004.08.030. [DOI] [PubMed] [Google Scholar]
- 26.Kim J.S., Shin D.H., Kim S.H. Crystal structure of ScpB from Chlorobium tepidum, a protein involved in chromosome partitioning. Proteins. 2006;62:322–328. doi: 10.1002/prot.20751. [DOI] [PubMed] [Google Scholar]
- 27.Hirano T. At the heart of the chromosome: SMC proteins in action. Nat. Rev. Mol. Cell Biol. 2006;7:311–322. doi: 10.1038/nrm1909. [DOI] [PubMed] [Google Scholar]
- 28.Graumann P.L., Knust T. Dynamics of the bacterial SMC complex and SMC-like proteins involved in DNA repair. Chromosome Res. 2009;17:265–275. doi: 10.1007/s10577-008-9014-x. [DOI] [PubMed] [Google Scholar]
- 29.Yeeles J.T., Dillingham M.S. A dual-nuclease mechanism for DNA break processing by AddAB-type helicase-nucleases. J. Mol. Biol. 2007;371:66–78. doi: 10.1016/j.jmb.2007.05.053. [DOI] [PubMed] [Google Scholar]
- 30.Yeeles J.T., van Aelst K., Moreno-Herrero F. Recombination hotspots and single-stranded DNA binding proteins couple DNA translocation to DNA unwinding by the AddAB helicase-nuclease. Mol. Cell. 2011;42:806–816. doi: 10.1016/j.molcel.2011.04.012. [DOI] [PubMed] [Google Scholar]
- 31.Horcas I., Fernández R., Baro A.M. WSXM: a software for scanning probe microscopy and a tool for nanotechnology. Rev. Sci. Instrum. 2007;78:013705. doi: 10.1063/1.2432410. [DOI] [PubMed] [Google Scholar]
- 32.Lysetska M., Knoll A., Krausch G. UV light-damaged DNA and its interaction with human replication protein A: an atomic force microscopy study. Nucleic Acids Res. 2002;30:2686–2691. doi: 10.1093/nar/gkf378. [DOI] [PMC free article] [PubMed] [Google Scholar]
- 33.Baumgarth B., Bartels F.W., Ros R. Detailed studies of the binding mechanism of the Sinorhizobium meliloti transcriptional activator ExpG to DNA. Microbiology. 2005;151:259–268. doi: 10.1099/mic.0.27442-0. [DOI] [PubMed] [Google Scholar]
- 34.Lyubchenko Y., Shlyakhtenko L., Lindsay S. Atomic force microscopy of long DNA: imaging in air and under water. Proc. Natl. Acad. Sci. USA. 1993;90:2137–2140. doi: 10.1073/pnas.90.6.2137. [DOI] [PMC free article] [PubMed] [Google Scholar]
- 35.Rivetti C., Guthold M., Bustamante C. Scanning force microscopy of DNA deposited onto mica: equilibration versus kinetic trapping studied by statistical polymer chain analysis. J. Mol. Biol. 1996;264:919–932. doi: 10.1006/jmbi.1996.0687. [DOI] [PubMed] [Google Scholar]
- 36.Lyubchenko Y.L., Shlyakhtenko L.S. AFM for analysis of structure and dynamics of DNA and protein-DNA complexes. Methods. 2009;47:206–213. doi: 10.1016/j.ymeth.2008.09.002. [DOI] [PMC free article] [PubMed] [Google Scholar]
- 37.Moreno-Herrero F., Colchero J., Baró A.M. DNA height in scanning force microscopy. Ultramicroscopy. 2003;96:167–174. doi: 10.1016/S0304-3991(03)00004-4. [DOI] [PubMed] [Google Scholar]
- 38.Volkov A., Mascarenhas J., Graumann P.L. A prokaryotic condensin/cohesin-like complex can actively compact chromosomes from a single position on the nucleoid and binds to DNA as a ring-like structure. Mol. Cell. Biol. 2003;23:5638–5650. doi: 10.1128/MCB.23.16.5638-5650.2003. [DOI] [PMC free article] [PubMed] [Google Scholar]
- 39.Mascarenhas J., Volkov A.V., Graumann P.L. Dynamic assembly, localization and proteolysis of the Bacillus subtilis SMC complex. BMC Cell Biol. 2005;6:28. doi: 10.1186/1471-2121-6-28. [DOI] [PMC free article] [PubMed] [Google Scholar]
- 40.Witte G., Fedorov R., Curth U. Biophysical analysis of Thermus aquaticus single-stranded DNA binding protein. Biophys. J. 2008;94:2269–2279. doi: 10.1529/biophysj.107.121533. [DOI] [PMC free article] [PubMed] [Google Scholar]
- 41.San Paulo A., García R. High-resolution imaging of antibodies by tapping-mode atomic force microscopy: attractive and repulsive tip-sample interaction regimes. Biophys. J. 2000;78:1599–1605. doi: 10.1016/S0006-3495(00)76712-9. [DOI] [PMC free article] [PubMed] [Google Scholar]
- 42.Woo J.S., Lim J.H., Oh B.H. Structural studies of a bacterial condensin complex reveal ATP-dependent disruption of intersubunit interactions. Cell. 2009;136:85–96. doi: 10.1016/j.cell.2008.10.050. [DOI] [PubMed] [Google Scholar]
- 43.Matoba K., Yamazoe M., Hiraga S. Comparison of MukB homodimer versus MukBEF complex molecular architectures by electron microscopy reveals a higher-order multimerization. Biochem. Biophys. Res. Commun. 2005;333:694–702. doi: 10.1016/j.bbrc.2005.05.163. [DOI] [PubMed] [Google Scholar]
- 44.Gloyd M., Ghirlando R., Guarné A. The role of MukE in assembling a functional MukBEF complex. J. Mol. Biol. 2011;412:578–590. doi: 10.1016/j.jmb.2011.08.009. [DOI] [PMC free article] [PubMed] [Google Scholar]
- 45.Onn I., Heidinger-Pauli J.M., Koshland D.E. Sister chromatid cohesion: a simple concept with a complex reality. Annu. Rev. Cell Dev. Biol. 2008;24:105–129. doi: 10.1146/annurev.cellbio.24.110707.175350. [DOI] [PubMed] [Google Scholar]
- 46.Cantor C.R., Schimmel P.R. W.H. Freeman; New York: 1980. Biophysical Chemistry. Part II: Techniques for the Study of Biological Structure and Function. [Google Scholar]
Associated Data
This section collects any data citations, data availability statements, or supplementary materials included in this article.