

Abstract
The accurate prediction of membrane-insertion probability for arbitrary protein sequences is a critical challenge to identifying membrane proteins and determining their folded structures. Although algorithms based on sequence statistics have had moderate success, a complete understanding of the energetic factors that drive the insertion of membrane proteins is essential to thoroughly meeting this challenge. In the last few years, numerous attempts to define a free-energy scale for amino-acid insertion have been made, yet disagreement between most experimental and theoretical scales persists. However, for a recently resolved water-to-bilayer scale, it is found that molecular dynamics simulations that carefully mimic the conditions of the experiment can reproduce experimental free energies, even when using the same force field as previous computational studies that were cited as evidence of this disagreement. Therefore, it is suggested that experimental and simulation-based scales can both be accurate and that discrepancies stem from disparities in the microscopic processes being considered rather than methodological errors. Furthermore, these disparities make the development of a single universally applicable membrane-insertion free energy scale difficult.
Introduction
The spontaneous partitioning of some amino acids into lipid bilayers underlies the folding and function of all membrane proteins. Knowledge of the energetics of this process is expected to provide the fundamental physico-chemical basis for understanding numerous structural and functional aspects of membrane proteins. However, although it has long been accepted that the residues of membrane proteins loosely follow some hydrophobicity pattern (1), attempts at establishing a definitive free energy scale for the membrane insertion of amino acids have met with varied success. Choosing the optimal membrane-mimicking bulk solvent to measure transfer free energies is one part of the problem. For example, empirical scales based on transfer free energies of side-chain analogs between, e.g., water and octanol (2) or water and cyclohexane (3), disagreed with one another in magnitude, and which scale is best remains unclear. More recently, a biological hydrophobicity scale was determined using a cotranslational system. A putative transmembrane (TM) segment was inserted into the protein-conducting channel, the SecY/Sec61 translocon, concomitant with the nascent protein's synthesis, and glycosylation was used to monitor the state of the system quantitatively (4,5). Perhaps most surprising was the observation of a low free energy cost associated with the presence of a charged residue in the TM helix; according to the translocon experiments, the free energy cost to add one arginine in a TM helix is ∼2–3 kcal/mol (4,5). In contrast, molecular dynamics (MD) computations predict free energies of ∼14–17 kcal/mol for arginine (6–8). Such a large and mostly unexplained disagreement created much confusion and contributed to doubts regarding the accuracy of the force field used in MD computations.
Despite the aforementioned doubts, it should be noted that solvation free energies calculated from simulation are generally in very good agreement with experimental values for well-defined liquid phases (9–12). Therefore, it is unlikely that errors in methodology or force field are solely responsible for the large discrepancy between simulations and experiments for membrane insertion (13). Rather, at least in part, the large mismatch in free energies resulted from comparing disparate processes. The majority of simulation studies examining the free energy of membrane insertion were predicated on the assumption of two idealized end-states, in which the TM helix was either fully hydrated or fully inserted into the bilayer. Although the translocon measurements are clearly indicative of a thermodynamic partitioning between two microscopic environments of different polarity, it is unlikely that they actually report on the transfer free energy between such idealized end-states (14). The reality of membrane-protein insertion is far more complex, with a variety of states of intermediate solvation also possible (14). Reconsidering the molecular context in which the translocon-assisted transfer free energies were measured led to a more complete resolution of this problem (15,16). Membrane insertion of a TM segment in the cotranslational system is believed to occur via a two-stage process, the first being insertion from ribosome into the channel and the second from the channel laterally into the membrane (15,17). The first stage is extremely slow (∼1 residue/s) and irreversibly driven by the nascent chain's elongation for both membrane and secreted proteins. The second stage, however, has no energetic input and, therefore, may represent the equilibrium process measured experimentally. Free-energy perturbation (FEP) calculations measuring the free energy for this process, transfer from channel to membrane, demonstrated a notably improved agreement with the experimental translocon scale compared with prior computational investigations (15).
The ribosome-translocon-membrane system is exceedingly complex, however, and is far from a simple testing ground for force-field validation. Presumably, comparison with a simpler water-to-bilayer (WTB) hydrophobicity scale would yield a clearer view of the issues at hand. Such a scale has been proposed recently by measuring the spontaneous membrane insertion of the outer membrane phospholipase A (OmpLA) under different conditions (18). Specifically, a residue predicted to localize to the membrane's center, Ala210, was mutated to other amino acids, and the corresponding change in free energy of insertion was determined. Surprisingly, even for direct insertion from water to membrane, the cost of placing one arginine inside the membrane turned out to be quite low, at only 3.71 kcal/mol relative to wild-type OmpLA (18), a value fairly similar to that observed in the experimental translocon scale. Thus, the OmpLA-scale measurements seem to indicate that the WTB transfer of one arginine is actually much smaller than predicted by atomic force fields, leading one to, once again, question the accuracy of MD computations (18). However, many of the specific microscopic factors underlying the OmpLA experiments have not yet been considered and it is difficult to ascertain the origin of the observed transfer free energies. The relative simplicity of the OmpLA measurements compared to the translocon-based ones offers a new opportunity to examine the ability of simulations to quantitatively predict membrane-insertion free energies, albeit with some details about the end states still unknown.
To clarify the molecular origins of the free energies in the WTB scale, the insertion of OmpLA mutants into the membrane was mimicked as closely as possible through the use of FEP simulations (19). Among the aspects unique to the OmpLA measurements, it is important to take into consideration the use of the short lipid DLPC, which has only 12 aliphatic carbons in each tail, and a pH of 3.8 (18). In the FEP simulations, the insertion-free-energy difference between Ala210 and a given residue is determined by carrying out the mutation in one direction in the membrane and the opposite direction in water. Three representative residues, a charged arginine (Arg), a hydrophobic leucine (Leu), and a hydrophilic serine (Ser), are chosen for comparison, each requiring 240 ns for a reliable determination of its insertion free energy. Close agreement between the simulations and the experimental values for the first two, Arg and Leu, is found, whereas the cost for Ser insertion is slightly higher in simulation. Additional calculations reveal the predominant contributor to the relatively low free energies in the WTB scale is the extraordinarily thin DLPC membrane.
Methods
System construction
Simulations of OmpLA began from the crystallographic structure of OmpLA (PDB code 1QD5) (20). Protonation states for titratable residues were assigned according to a pH of 3.8, matching experimental conditions, using PropKa (21,22). Specifically, glutamate residues 25, 51, 60, 104, 105, 111, and 165 along with aspartate residues 125, 143, and 205, all solvent exposed, were neutralized. The DLPC bilayer was constructed using the CHARMM GUI Membrane Builder (http://www.charmm-gui.org/) (23–25). Protein and membrane were combined using the visualization and analysis program VMD (26), leaving the membrane with 100 lipids in the upper leaflet and 95 in the lower leaflet. The resulting system was solvated above and below and ionized with Na+ and Cl− ions to a concentration of 308 mM. The final system size for OmpLA in the membrane is 63,000 atoms.
The system used for simulations of the pseudo-infinite poly-leucine helix in a DLPC bilayer was prepared in a manner identical to that in Gumbart et al. (15). Briefly, the helix contains 73 amino acids and was placed in a solvated bilayer with K+ and Cl− ions at a concentration of 1.0 M surrounding it. The size for this system is 48,500 atoms. All Cα atoms of the helix were restrained, thus maintaining the helix's orientation and structure. To prevent shifting of the membrane relative to the helix, the center-of-mass of all phosphorus atoms in the membrane was restrained along the z axis to the origin.
Simulation protocols
All equilibrium simulations were carried out in the NPT ensemble and production simulations in the ensemble, where N denotes the number of particles, Pz is the normal pressure, 𝒜 is the surface area, and T is the temperature. Simulations were run using the molecular dynamics program NAMD 2.8 (27) and the CHARMM force field (28–30). The normal pressure and the temperature were fixed at 1 bar and 310 K, respectively, employing the Langevin piston algorithm (31) and Langevin dynamics with damping coefficient 1 ps–1. Periodic boundary conditions were applied in all dimensions. Short-range Lennard-Jones and Coulombic interactions were truncated smoothly by means of a 12 Å spherical cutoff with a switching function applied beyond 10 Å. The particle-mesh Ewald method (32) was employed to compute long-range electrostatic interactions. A timestep of 2 fs was employed, with bonded interactions and short-range forces calculated every timestep and long-range forces every three timesteps. Covalent bonds involving hydrogen atoms were constrained to their equilibrium values.
Free-energy calculations
In a simulated alchemical transformation, the free energy separating two states is calculated by slowly converting from one to the other through creation and/or annihilation of specific components of the system, controlled by a parameter λ that runs from 0 to 1 (33). To prevent the occurrence of singularities at small values of λ, a scaled-shifted soft-core potential was used for van der Waals interactions (34). For calculating ΔΔG of insertion of the residue-210 mutants of OmpLA relative to the Ala210 wild-type, FEP simulations were undertaken in which Ala210 is transformed into an alternative residue in the two environments, water and membrane. Similarly, for the transfer free energy of Arg on a polyL helix from water to membrane, an Arg residue distant from the membrane was transformed into Ala while concomitantly an Ala residue in the membrane center was transformed into Arg. Each of the transformations was run in both the forward (λ from 0 to 1) and backward (λ from 1 to 0) directions. The transformations were subdivided into 50 windows and each was run for 0.6 ns of equilibration and 0.6 ns of data collection, giving 60 ns for the full transformation. Thus, for the three residues on OmpLA and the polyL helix, along with initial equilibration simulations, a total of ∼1 μs of simulations were carried out. FEP simulations of the isolated residue and of the seven-residue peptide in water were run for 4.5 ns in each direction. Statistical analysis of the two directions for each FEP calculation was performed by using the Bennett acceptance ratio (35) via the ParseFEP plugin in VMD (26).
Membrane area
Because the packing of lipids may have a nonnegligible effect on the free energy of insertion, the membrane area was carefully monitored. The initially constructed OmpLA-DLPC system was equilibrated in stages (36). Unrestrained equilibration of the membrane-protein system in the NPT ensemble for 6 ns produced an area of ∼83.5 × 83.5 Å2. With the protein area estimated at 850 Å2, the area/lipid is 62.8 Å2 on average. This is smaller than that from experimental measurements, which give, after accounting for the difference in temperatures (310 K in simulation and 303 K in experiment), 65.1 Å2 (37). To correct for the slight underestimation in area/lipid, the system's area was increased to 85 × 85 Å2 and then fixed for subsequent simulations, giving an area/lipid of ∼65.4 Å2.
Corrections to the calculated free energy
For nonneutral systems using PME electrostatics, a self-interaction term arises that must be accounted for in the free energy calculations. For two systems of different charges, q1 and q0, the correction takes the form
| (1) |
where ξ = −2.837297/L for a cubic lattice (38). For simulations involving mutation of an Ala residue to Arg, q1 = 1 and q0 = 0. Corrections to the free energy in four systems were determined and are detailed in Table S1 in the Supporting Material.
An additional spurious self-interaction between the charged Arg residue and its images in neighboring periodic cells also arises in the simulations (6,39,40). However, because either water or, when in the membrane, the water-filled OmpLA barrel, effectively shields the Arg's charge over the simulation box width, this term is expected to be negligible, and therefore was ignored.
Results
To determine the WTB insertion free energies computationally, a thermodynamic cycle was first constructed, shown in Fig. 1. This cycle connects the unassisted membrane insertion of OmpLA to more computationally tractable alchemical transformations, similar to one used previously (15). By closure of the cycle, the free-energy difference between insertion of the wild-type OmpLA and of the Ala210 mutants is given by
| (2) |
where Res indicates the residue 210 point mutation. Thus, two FEP calculations, one of the free-energy change of Ala210 to Res in water and one in membrane, suffice to determine the insertion cost of OmpLA mutants relative to wild-type.
Figure 1.
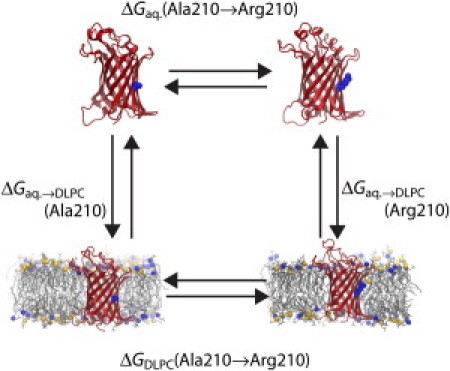
Thermodynamic cycle relating membrane-insertion (vertical legs) with FEP calculations (horizontal legs) for arginine. OmpLA is shown as ribbons and Ala/Arg210 is indicated at its center in a space-filling representation. The membrane is displayed as thin gray lines with phosphorus atoms of the headgroups as spheres.
Insertion free-energies for Arg, Leu, and Ser
FEP simulations, each 60 ns, were carried out in both forward (Ala → Res) and reverse (Res → Ala) directions to improve statistical reliability (15,33); see Table S2 for a full list of the simulations performed. Simulation conditions were chosen to best mimic those in experiment, including using an equilibrated DLPC bilayer (see Methods). One factor, which was not explicitly controlled, however, is the structure of OmpLA before membrane insertion. Whether it is folded, unfolded, or somewhere in between in water is unknown, and may be dependent on the sequence. Therefore, three contexts for the purely aqueous state of residue 210 of OmpLA are considered: as part of the fully folded protein; as part of a seven-residue strand, i.e., residues 207–213 of OmpLA; and as a single isolated amino acid, thereby neglecting completely any role of the rest of the protein (see Fig. S1 in the Supporting Material). All insertion free energies, therefore, are given as a range encompassing the three contexts; see Table 1 for a complete list of values.
Table 1.
Relative free energies of membrane insertion for OmpLA mutants
| Residue | WTB scale (kcal/mol) | Aqueous reference state |
||
|---|---|---|---|---|
| Folded | Seven-residue strand | Isolated | ||
| (Arg) | 3.71 ± 0.13 | 3.76 ± 0.27 | 1.06 ± 0.22 | 2.65 ± 0.20 |
| (Leu) | −1.81 ± 0.13 | −0.91 ± 0.06 | −2.64 ± 0.08 | −2.06 ± 0.07 |
| (Ser) | 1.83 ± 0.22 | 4.08 ± 0.05 | 3.52 ± 0.06 | 5.24 ± 0.06 |
In the first tested case, Ala210 was mutated to Arg, a residue with one of the most discrepant free energies between computationally and experimentally determined scales. Based on the FEP simulations and the cycle in Fig. 1, along with a correction for the self-energy of nonneutral systems using PME (see Methods), (Arg) is equal to 1.05–3.76 kcal/mol. The upper value, derived from a fully folded aqueous state for OmpLA, is in excellent agreement with the experimental value, denoted in Moon and Fleming (18) as ΔΔGow,l = 3.71 kcal/mol. It is also much lower than other direct water-to-membrane free-energy costs determined from simulations, which range from 10 to 17 kcal/mol (6–8,41). The insertion free energy calculated from the other two aqueous states of Ala/Arg210 considered are even lower, suggesting that the relatively low value is not particular to the chosen structure in water but rather to other environmental conditions.
Although proposals addressing the lower free energy for Arg insertion in experiments compared to simulations have been put forth (42,43), a similar reduction in magnitude for hydrophobic residues such as Leu remained elusive. Calculation of translocon-assisted insertion free energies, however, showed lower free energies for both Arg and Leu when compared to other computationally resolved scales (15). The insertion free energy for Leu in the WTB scale, −1.81 kcal/mol (18), lies between that in the biological hydrophobicity scale (−0.6 kcal/mol (4)) and most computational values (−4 kcal/mol (7,8,41,42)). In the second tested case, the insertion free-energy of Leu relative to Ala on OmpLA was computed, employing FEP simulations identical to those carried out for Arg. From these simulations, the free energy (Leu) is found to be between −2.64 and −0.91 kcal/mol. As found for Arg, in all contexts, the free energy of insertion is lower than that measured in previous simulations, and encompasses the experimental value. As opposed to Arg, for Leu the optimal agreement with experiment is found for an isolated Leu in the aqueous environment (ΔΔG = −2.06 kcal/mol), although the range overall is quite small.
Finally, the insertion free energy for a hydrophilic residue, Ser, was determined. For this residue, the WTB insertion free energy (1.83 kcal/mol) lies slightly below the range of free-energy values determined from the thermodynamic cycle in Fig. 1, i.e., 3.52–5.24 kcal/mol. The solvation free energy for a serine side-chain analog in the CHARMM force field is in good agreement with experiments (9), suggesting that the difference here results from limited system-specific issues. Ser is accommodated in the membrane core primarily through hydrogen bonding to the backbone carbonyl of Glu224, disturbing a β-strand of the OmpLA barrel, as opposed to the Arg residue, which quickly induces the formation of a stable water defect in the membrane (see Fig. 2). The slow process of attracting one water molecule to coordinate the serine residue in the membrane core, which was observed during extended equilibration but not during FEP simulations, may bias the calculated insertion free energy cost. Indeed, a subsequent FEP calculation in which the initial state included a water molecule interacting with the membrane-inserted Ser210 displayed a reduction in the insertion free energy of 1.21 kcal/mol (see the Supporting Material). Additionally, it is known that the distribution of hydrogen-bond geometries in MD simulations differs from that observed in crystallographic structures, due in part to the lack of polarizability in most force fields (44,45). Comparison between quantum chemical and molecular mechanical interaction energies for observed Ser210-β-barrel interactions, described in the Supporting Material, illustrates that the CHARMM force field undervalues the interaction by an average of 0.46 kcal/mol, and, thus, also may contribute to a reduction in the insertion free energy for Ser. A combination of the two effects, namely the slow diffusion of water to the embedded Ser210 and the slight difference in hydrogen-bonding energies, would be sufficient to bring the simulated free energy cost in line with the experimental one.
Figure 2.
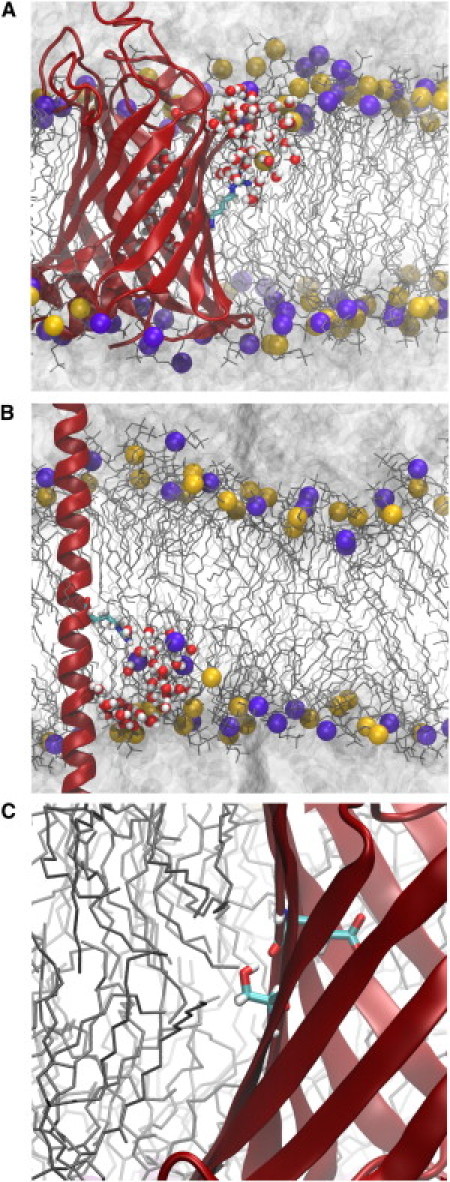
Interactions that stabilize residues in the membrane. (A and B) Membrane deformation induced by the presence of arginine at the center for (A) OmpLA:Arg210 and (B) PolyL:Arg. The protein is colored as in Fig. 1 with arginine shown in a stick representation colored by atom type. The DLPC bilayer is drawn as in Fig. 1. Water is shown as a continuous gray surface above and below the membrane, while water molecules that penetrate the bilayer are shown in a licorice representation. (C) Hydrogen-bonding of Ser210 to the OmpLA β-barrel backbone.
Contributions to the determined insertion free energies
Although the FEP simulations provide the free energies of insertion for the OmpLA mutants, they do not reveal their origins unambiguously. This ambiguity is especially pertinent for Arg, which deviates the most from previously determined computational scales. Comparing the membrane insertion of Arg on OmpLA to simulated insertion of Arg on a background poly-leucine helix (6,15) suggests three possible sources. The most obvious source is the difference in membrane composition, the former being carried out with DLPC lipids (12-carbon tails) and the latter with DPPC (16-carbon tails). The resulting difference in membrane thickness is ∼4–5 Å, shown in Fig. 3. In another MD study, a similar lipid-tail-length change, i.e., DOPC → DMPC, accounted for a decrease of ∼5 kcal/mol for insertion of an arginine side-chain analog (46). Alternatively, differences in the local protein environment of the Arg residue, namely the OmpLA β-barrel or the polyL α-helix, may play a role. A final possibility is shifting of the protein in the membrane such that the Arg residue is no longer centrally located. During a 10-ns equilibration, the distance between the Cα of Arg210 and the membrane center is 1.67 ± 0.67 Å (see Fig. S2), which is estimated from the potential of mean force for a related system to reduce the insertion free energy by ∼3 kcal/mol (6). For comparison, local thinning of the DLPC bilayer within 15 Å of Arg210 amounts to 1.61 ± 0.74 Å (see Fig. S3).
Figure 3.
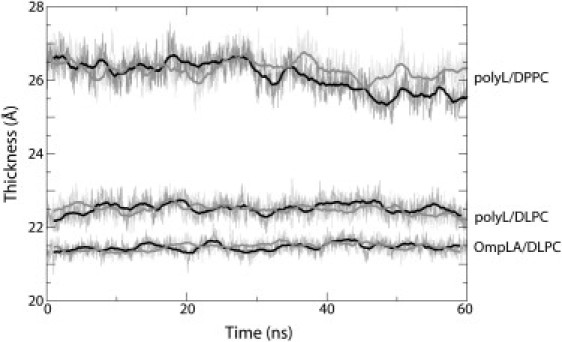
Membrane hydrophobic thickness over the course of the Ala → Arg FEP simulations. Thickness was measured as the separation between the average positions of the carbonyl carbon atoms in the lipid tails of each leaflet (denoted C21 and C31 in the force field); this thickness is nearly identical to the experimental value for DLPC, namely 2zCG = 21.8 Å (37). The black and gray curves represent the forward and reverse trajectories for each protein-membrane combination indicated in the plot.
To separate the contribution of the variance in bilayer thickness from the other two possible factors, FEP simulations examining the transfer of an arginine residue borne by an extended polyL α-helix from the aqueous phase to the center of a DLPC bilayer were carried out. The Cα of Arg/Ala was restrained to the bilayer's center to prevent sliding of the helix, as done previously (15). The resulting free-energy change, i.e., , was found to be 6.09 kcal/mol. When the nearly identical transfer process was carried out in a DPPC membrane, the free-energy change was much higher, = 16.9 kcal/mol (6,15). The difference in the two protocols, namely the use of Ala versus Leu as the Arg counterpart, is expected to contribute up to 1.81 kcal/mol according to other hydrophobicity scales (4,7,8,18). This would make the net ΔΔG for the DLPC membrane 7.9 kcal/mol, at most—still almost 10 kcal/mol less than that for DPPC. Therefore, the membrane thickness is the principal contributor to the relatively low free energies measured in the WTB hydrophobicity scale, with shifting of OmpLA in the membrane also playing a role.
Conclusion
Numerous free-energy scales for the partitioning of proteins into membranes have been defined based on different experimental approaches and biophysical circumstances (13). Most recently, a water-to-bilayer (WTB) scale was determined for the direct insertion of each residue centrally located on the β-barrel of OmpLA (18). Although simpler in principle than, e.g., cotranslational insertion through the translocon (5,15,43), many of the molecular details of the OmpLA-mediated insertion process remain unknown. By reproducing here the free energies for Arg, Leu, and Ser insertion computationally, these details become partially revealed. Most notably, the thickness of the membrane is found to be primarily responsible for the relatively compressed free energies measured in the WTB scale, with shifting of the protein off-center in the membrane and interactions within the protein itself affecting them as well.
Because the folding and insertion pathway for OmpLA into the membrane is unknown, and may even be sequence-dependent, three different contexts for the mutated residue outside the membrane were considered: on a fully folded OmpLA; in the center of a seven-residue oligopeptide; and as a completely isolated amino acid. The range of free energies calculated for these contexts is small, but not negligible, at 2.7 kcal/mol for Arg and 1.7 kcal/mol for both Ser and Leu. Furthermore, the ideal agreement between experiment and simulation was found in a different context for each of the three tested residues. The distinct, context-dependent free energies expose the complexity of the OmpLA insertion process, which cannot be assumed to be identical for every residue.
It has become increasingly evident that charged amino acids can be stable in the membrane, at least marginally, albeit only under certain conditions. One example is a high protein content in the bilayer (42). Another such condition was illustrated here, namely an abnormally thin membrane, which, among other things, reduces the deformation required to accommodate snorkeling of an Arg residue to the membrane-water interface (see Fig. 2). These conditions are both distinct from and independent of the typical biological membrane-insertion process, which makes use of the translocon (15,16). Insertion through the translocon can give an apparently low free-energy cost, but does not guarantee thermodynamic stability once in the membrane. Tests on isolated transmembrane segments that can distinguish between stable, membrane-inserted states and initially inserted, but ultimately unstable and/or expelled states, are required to further probe the distinction between translocon-assisted insertion and water-to-bilayer insertion.
The diversity of paths to the membrane for proteins and contributors to their stability therein limits the universality of a single free-energy scale for identifying and characterizing membrane proteins. Indeed, insertion propensity is not even a localized property, with residues on neighboring TM segments being able to affect it (43,47,48). Additionally, insertion free energies for multiple residues on a single TM segment are not uniformly additive (13), requiring the inclusion of multiresidue corrections to any prediction method. Simulations can play a role in the determination of these nonlocal and nonadditive effects, provided they are sufficiently accurate. Although much discussion has arisen as a result of the apparent disparity between computational and experimental membrane-insertion free energies (16,49–51), this disparity is likely due to a comparison of nonequivalent systems, e.g., membranes with different thicknesses or different end-points of the process under study (14). As demonstrated here, simulations and experiments can achieve quantitative agreement provided the specific conditions in each are carefully identified and matched. The addition of polarizability to classical simulations is expected to enhance this agreement further (52,53).
Acknowledgments
J.G. sincerely thanks Peter Freddolino, Chris Chipot, and Klaus Schulten for helpful discussions and comments on this work.
This work was supported by grants from the National Institutes of Health (R01 GM067887 and U54 GM087519) and the National Science Foundation (MCB-0920261). J.G. is supported by a Director's Postdoctoral Fellowship from the Argonne National Laboratory. Simulations were carried out with resources provided by the Computation Institute and the Biological Sciences Division of the University of Chicago and Argonne National Laboratory, under grant S10 RR029030-01.
Supporting Material
References
- 1.Kyte J., Doolittle R.F. A simple method for displaying the hydropathic character of a protein. J. Mol. Biol. 1982;157:105–132. doi: 10.1016/0022-2836(82)90515-0. [DOI] [PubMed] [Google Scholar]
- 2.Wimley W.C., Creamer T.P., White S.H. Solvation energies of amino acid side chains and backbone in a family of host-guest pentapeptides. Biochemistry. 1996;35:5109–5124. doi: 10.1021/bi9600153. [DOI] [PubMed] [Google Scholar]
- 3.Radzicka A., Wolfenden R. Comparing the polarities of the amino acids: side chain distribution coefficients between the vapor phase, cyclohexane, 1-octanol, and neutral aqueous solution. Biochemistry. 1988;27:1664–1670. [Google Scholar]
- 4.Hessa T., Kim H., von Heijne G. Recognition of transmembrane helices by the endoplasmic reticulum translocon. Nature. 2005;433:377–381. doi: 10.1038/nature03216. [DOI] [PubMed] [Google Scholar]
- 5.Hessa T., Meindl-Beinker N.M., von Heijne G. Molecular code for transmembrane-helix recognition by the Sec61 translocon. Nature. 2007;450:1026–1030. doi: 10.1038/nature06387. [DOI] [PubMed] [Google Scholar]
- 6.Dorairaj S., Allen T.W. On the thermodynamic stability of a charged arginine side chain in a transmembrane helix. Proc. Natl. Acad. Sci. USA. 2007;104:4943–4948. doi: 10.1073/pnas.0610470104. [DOI] [PMC free article] [PubMed] [Google Scholar]
- 7.MacCallum J.L., Bennett W.F.D., Tieleman D.P. Partitioning of amino acid side chains into lipid bilayers: results from computer simulations and comparison to experiment. J. Gen. Physiol. 2007;129:371–377. doi: 10.1085/jgp.200709745. [DOI] [PMC free article] [PubMed] [Google Scholar]
- 8.Johansson A.C.V., Lindahl E. Position-resolved free energy of solvation for amino acids in lipid membranes from molecular dynamics simulations. Proteins: Struct., Funct. Bioinf. 2008;70:1332–1344. doi: 10.1002/prot.21629. [DOI] [PubMed] [Google Scholar]
- 9.Deng Y., Roux B. Hydration of amino acid side chains: nonpolar and electrostatic contributions calculated from staged molecular dynamics free energy simulations with explicit water molecules. J. Phys. Chem. B. 2004;108:16567–16576. [Google Scholar]
- 10.Shirts M.R., Pande V.S. Solvation free energies of amino acid side chain analogs for common molecular mechanics water models. J. Chem. Phys. 2005;122:134508. doi: 10.1063/1.1877132. [DOI] [PubMed] [Google Scholar]
- 11.Shivakumar D., Deng Y., Roux B. Computations of absolute solvation free energies of small molecules using explicit and implicit solvent model. J. Chem. Theory Comput. 2009;5:919–930. doi: 10.1021/ct800445x. [DOI] [PubMed] [Google Scholar]
- 12.Shivakumar D., Williams J., Sherman W. Prediction of absolute solvation free energies using molecular dynamics free energy perturbation and the OPLS force field. J. Chem. Theory Comput. 2010;6:1509–1519. doi: 10.1021/ct900587b. [DOI] [PubMed] [Google Scholar]
- 13.MacCallum J.L., Tieleman D.P. Hydrophobicity scales: a thermodynamic looking glass into lipid-protein interactions. Trends Biochem. Sci. 2011;36:653–662. doi: 10.1016/j.tibs.2011.08.003. [DOI] [PubMed] [Google Scholar]
- 14.Roux B. Lonely arginine seeks friendly environment. J. Gen. Physiol. 2007;130:233–236. doi: 10.1085/jgp.200709819. [DOI] [PMC free article] [PubMed] [Google Scholar]
- 15.Gumbart J., Chipot C., Schulten K. Free-energy cost for translocon-assisted insertion of membrane proteins. Proc. Natl. Acad. Sci. USA. 2011;108:3596–3601. doi: 10.1073/pnas.1012758108. [DOI] [PMC free article] [PubMed] [Google Scholar]
- 16.Schow E.V., Freites J.A., Tobias D.J. Arginine in membranes: the connection between molecular dynamics simulations and translocon-mediated insertion experiments. J. Membr. Biol. 2011;239:35–48. doi: 10.1007/s00232-010-9330-x. [DOI] [PMC free article] [PubMed] [Google Scholar]
- 17.Frauenfeld J., Gumbart J., Beckmann R. Cryo-EM structure of the ribosome-SecYE complex in the membrane environment. Nat. Struct. Mol. Biol. 2011;18:614–621. doi: 10.1038/nsmb.2026. [DOI] [PMC free article] [PubMed] [Google Scholar]
- 18.Moon C.P., Fleming K.G. Side-chain hydrophobicity scale derived from transmembrane protein folding into lipid bilayers. Proc. Natl. Acad. Sci. USA. 2011;108:10174–10177. doi: 10.1073/pnas.1103979108. [DOI] [PMC free article] [PubMed] [Google Scholar]
- 19.Zwanzig R.W. High-temperature equation of state by a perturbation method. I. Nonpolar gases. J. Chem. Phys. 1954;22:1420–1426. [Google Scholar]
- 20.Snijder H.J., Ubarretxena-Belandia I., Dijkstra B.W. Structural evidence for dimerization-regulated activation of an integral membrane phospholipase. Nature. 1999;401:717–721. doi: 10.1038/44890. [DOI] [PubMed] [Google Scholar]
- 21.Li H., Robertson A.D., Jensen J.H. Very fast empirical prediction and interpretation of protein pKa values. Proteins: Struct., Funct. Bioinf. 2005;61:704–721. doi: 10.1002/prot.20660. [DOI] [PubMed] [Google Scholar]
- 22.Bas D.C., Rogers D.M., Jensen J.H. Very fast prediction and rationalization of pKa values for protein-ligand complexes. Proteins: Struct., Funct. Bioinf. 2008;73:765–783. doi: 10.1002/prot.22102. [DOI] [PubMed] [Google Scholar]
- 23.Woolf T.B., Roux B. Structure, energetics, and dynamics of lipid-protein interactions: a molecular dynamics study of the gramicidin A channel in a DMPC bilayer. Proteins: Struct., Funct. Gen. 1996;24:92–114. doi: 10.1002/(SICI)1097-0134(199601)24:1<92::AID-PROT7>3.0.CO;2-Q. [DOI] [PubMed] [Google Scholar]
- 24.Jo S., Kim T., Im W. Automated builder and database of protein/membrane complexes for molecular dynamics simulations. PLoS ONE. 2007;2:e880. doi: 10.1371/journal.pone.0000880. [DOI] [PMC free article] [PubMed] [Google Scholar]
- 25.Jo S., Lim J.B., Im W. CHARMM-GUI Membrane Builder for mixed bilayers and its application to yeast membranes. Biophys. J. 2009;97:50–58. doi: 10.1016/j.bpj.2009.04.013. [DOI] [PMC free article] [PubMed] [Google Scholar]
- 26.Humphrey W., Dalke A., Schulten K. VMD: visual molecular dynamics. J. Mol. Graph. 1996;14:33–38. doi: 10.1016/0263-7855(96)00018-5. 27–28. [DOI] [PubMed] [Google Scholar]
- 27.Phillips J.C., Braun R., Schulten K. Scalable molecular dynamics with NAMD. J. Comput. Chem. 2005;26:1781–1802. doi: 10.1002/jcc.20289. [DOI] [PMC free article] [PubMed] [Google Scholar]
- 28.MacKerell A.D., Jr., Bashford D., Karplus M. All-atom empirical potential for molecular modeling and dynamics studies of proteins. J. Phys. Chem. B. 1998;102:3586–3616. doi: 10.1021/jp973084f. [DOI] [PubMed] [Google Scholar]
- 29.MacKerell A.D., Jr., Feig M., Brooks C.L., 3rd Extending the treatment of backbone energetics in protein force fields: limitations of gas-phase quantum mechanics in reproducing protein conformational distributions in molecular dynamics simulations. J. Comput. Chem. 2004;25:1400–1415. doi: 10.1002/jcc.20065. [DOI] [PubMed] [Google Scholar]
- 30.Klauda J.B., Venable R.M., Pastor R.W. Update of the CHARMM all-atom additive force field for lipids: validation on six lipid types. J. Phys. Chem. B. 2010;114:7830–7843. doi: 10.1021/jp101759q. [DOI] [PMC free article] [PubMed] [Google Scholar]
- 31.Feller S.E., Zhang Y., Brooks B.R. Constant pressure molecular dynamics simulation: the Langevin piston method. J. Chem. Phys. 1995;103:4613–4621. [Google Scholar]
- 32.Darden T., York D., Pedersen L.G. Particle mesh Ewald: an N·log(N) method for Ewald sums in large systems. J. Chem. Phys. 1993;98:10089–10092. [Google Scholar]
- 33.Pohorille A., Jarzynski C., Chipot C. Good practices in free-energy calculations. J. Phys. Chem. B. 2010;114:10235–10253. doi: 10.1021/jp102971x. [DOI] [PubMed] [Google Scholar]
- 34.Zacharias M., Straatsma T.P., McCammon J.A. Separation-shifted scaling, a new scaling method for Lennard-Jones interactions in thermodynamic integration. J. Chem. Phys. 1994;100:9025–9031. [Google Scholar]
- 35.Bennett C.H. Efficient estimation of free energy differences from Monte Carlo data. J. Comput. Phys. 1976;22:245–268. [Google Scholar]
- 36.Gumbart J., Schulten K. Molecular dynamics studies of the archaeal translocon. Biophys. J. 2006;90:2356–2367. doi: 10.1529/biophysj.105.075291. [DOI] [PMC free article] [PubMed] [Google Scholar]
- 37.Kučerka N., Liu Y., Nagle J.F. Structure of fully hydrated fluid phase DMPC and DLPC lipid bilayers using x-ray scattering from oriented multilamellar arrays and from unilamellar vesicles. Biophys. J. 2005;88:2626–2637. doi: 10.1529/biophysj.104.056606. [DOI] [PMC free article] [PubMed] [Google Scholar]
- 38.Hummer G., Pratt L.R., Garcia A.E. Free energy of ionic hydration. J. Phys. Chem. 1996;100:1206–1215. [Google Scholar]
- 39.Allen T.W., Andersen O.S., Roux B. Energetics of ion conduction through the gramicidin channel. Proc. Natl. Acad. Sci. USA. 2004;101:117–122. doi: 10.1073/pnas.2635314100. [DOI] [PMC free article] [PubMed] [Google Scholar]
- 40.Allen T.W., Andersen O.S., Roux B. Ion permeation through a narrow channel: using gramicidin to ascertain all-atom molecular dynamics potential of mean force methodology and biomolecular force fields. Biophys. J. 2006;90:3447–3468. doi: 10.1529/biophysj.105.077073. [DOI] [PMC free article] [PubMed] [Google Scholar]
- 41.Choe S., Hecht K.A., Grabe M. A continuum method for determining membrane protein insertion energies and the problem of charged residues. J. Gen. Physiol. 2008;131:563–573. doi: 10.1085/jgp.200809959. [DOI] [PMC free article] [PubMed] [Google Scholar]
- 42.Johansson A.C.V., Lindahl E. Protein contents in biological membranes can explain abnormal solvation of charged and polar residues. Proc. Natl. Acad. Sci. USA. 2009;106:15684–15689. doi: 10.1073/pnas.0905394106. [DOI] [PMC free article] [PubMed] [Google Scholar]
- 43.Rychkova A., Vicatos S., Warshel A. On the energetics of translocon-assisted insertion of charged transmembrane helices into membranes. Proc. Natl. Acad. Sci. USA. 2010;107:17598–17603. doi: 10.1073/pnas.1012207107. [DOI] [PMC free article] [PubMed] [Google Scholar]
- 44.Kortemme T., Morozov A.V., Baker D. An orientation-dependent hydrogen bonding potential improves prediction of specificity and structure for proteins and protein-protein complexes. J. Mol. Biol. 2003;326:1239–1259. doi: 10.1016/s0022-2836(03)00021-4. [DOI] [PubMed] [Google Scholar]
- 45.Freddolino P.L., Park S., Schulten K. Force field bias in protein folding simulations. Biophys. J. 2009;96:3772–3780. doi: 10.1016/j.bpj.2009.02.033. [DOI] [PMC free article] [PubMed] [Google Scholar]
- 46.Johansson A.C.V., Lindahl E. The role of lipid composition for insertion and stabilization of amino acids in membranes. J. Chem. Phys. 2009;130:185101. doi: 10.1063/1.3129863. [DOI] [PubMed] [Google Scholar]
- 47.Heinrich S.U., Rapoport T.A. Cooperation of transmembrane segments during the integration of a double-spanning protein into the ER membrane. EMBO J. 2003;22:3654–3663. doi: 10.1093/emboj/cdg346. [DOI] [PMC free article] [PubMed] [Google Scholar]
- 48.Hedin L.E., Öjemalm K., Elofsson A. Membrane insertion of marginally hydrophobic transmembrane helices depends on sequence context. J. Mol. Biol. 2010;396:221–229. doi: 10.1016/j.jmb.2009.11.036. [DOI] [PubMed] [Google Scholar]
- 49.White S.H. Membrane protein insertion: the biology-physics nexus. J. Gen. Physiol. 2007;129:363–369. doi: 10.1085/jgp.200709741. [DOI] [PMC free article] [PubMed] [Google Scholar]
- 50.Hristova K., Wimley W.C. A look at arginine in membranes. J. Membr. Biol. 2011;239:49–56. doi: 10.1007/s00232-010-9323-9. [DOI] [PMC free article] [PubMed] [Google Scholar]
- 51.Ulmschneider J.P., Smith J.C., Ulmschneider M.B. In silico partitioning and transmembrane insertion of hydrophobic peptides under equilibrium conditions. J. Am. Chem. Soc. 2011;133:15487–15495. doi: 10.1021/ja204042f. [DOI] [PMC free article] [PubMed] [Google Scholar]
- 52.Harder E., Mackerell A.D., Jr., Roux B. Many-body polarization effects and the membrane dipole potential. J. Am. Chem. Soc. 2009;131:2760–2761. doi: 10.1021/ja806825g. [DOI] [PMC free article] [PubMed] [Google Scholar]
- 53.Jiang W., Hardy D.J., Roux B. High-performance scalable molecular dynamics simulations of a polarizable force field based on classical Drude oscillators in NAMD. J. Phys. Chem. Lett. 2011;2:87–92. doi: 10.1021/jz101461d. [DOI] [PMC free article] [PubMed] [Google Scholar]
- 54.Kofke D.A., Cummings P.T. Precision and accuracy of staged free-energy perturbation methods for computing the chemical potential by molecular simulation. Fluid Phase Equilib. 1998;150:41–49. [Google Scholar]
- 55.Frisch, M. J., G. W. Trucks, …, D. J. Fox. 2009. Gaussian 09, Rev. A.1. Gaussian Inc., Wallingford, CT.
Associated Data
This section collects any data citations, data availability statements, or supplementary materials included in this article.