

Abstract
Epithelial tissue morphogenesis is accompanied by the formation of a polarity axis – a feature of tissue architecture that is initiated by the binding of integrins to the basement membrane. Polarity plays a crucial role in tissue homeostasis, preserving differentiation, cell survival and resistance to chemotherapeutic drugs among others. An important aspect in the maintenance of tissue homeostasis is genome integrity. As normal tissues frequently experience DNA double-strand breaks (DSBs), we asked how tissue architecture might participate in the DNA damage response. Using 3D culture models that mimic mammary glandular morphogenesis and tumor formation, we show that DSB repair activity is higher in basally polarized tissues, regardless of the malignant status of cells, and is controlled by hemidesmosomal integrin signaling. In the absence of glandular morphogenesis, in 2D flat monolayer cultures, basal polarity does not affect DNA repair activity but enhances H2AX phosphorylation, an early chromatin response to DNA damage. The nuclear mitotic apparatus protein 1 (NuMA), which controls breast glandular morphogenesis by acting on the organization of chromatin, displays a polarity-dependent pattern and redistributes in the cell nucleus of basally polarized cells upon the induction of DSBs. This is shown using high-content analysis of nuclear morphometric descriptors. Furthermore, silencing NuMA impairs H2AX phosphorylation – thus, tissue polarity and NuMA cooperate to maintain genome integrity.
Key words: Tissue architecture, Basal polarity, Nuclear mitotic apparatus protein, DNA double-strand break, Chromatin, Three-dimensional cell culture
Introduction
DNA damage caused by environmental and endogenous stresses is a constant threat to genome integrity. Double-stranded DNA breaks (DSBs) are highly deleterious lesions leading to mutations and chromosomal translocations that contribute to cellular transformation. Hence, effective and accurate DSB repair is essential for the maintenance of tissue homeostasis. Cells have evolved elaborate mechanisms, collectively referred to as the DNA damage response (DDR), for sensing DNA damage and transducing this information into molecular responses that prevent the propagation of genomic instability (Ciccia and Elledge, 2010). Molecular sensors recognize DSBs and activate phosphoinositide 3-kinase-related protein kinases, which then propagate and amplify the DDR, notably by phosphorylating the histone variant H2AX. This crucial chromatin modification step can span up to 2 Mb of DNA around the DNA breaks. Phosphorylated H2AX (hereafter referred to as γH2AX) participates in the recruitment and retention of DDR proteins, including repair factors and chromatin remodeling complexes at DSB sites (van Attikum and Gasser, 2009).
The wealth of knowledge on the molecular mechanisms orchestrating DSB repair is largely based on studies that made use of cancer cell lines cultured as flat monolayers, which we refer to as 2D cultures. A challenge is to understand DSB repair in the context of organized tissues. In vivo, epithelial cells are assembled into remarkable 3D multicellular structures under the control of a specialized extracellular matrix (ECM), the basement membrane (BM) and soluble signaling molecules. This organization results from tissue morphogenesis, and is accompanied by the establishment of specific architectural and functional features of cells, which become altered in cancer. A key architectural feature of the normal epithelium is the polarity axis, which participates in tissue homeostasis. The morphogenesis of the mammary gland, with the formation of its functional and structural units, the acini, has been well studied. On the basal side of cells, transmembrane α6- and β4-integrins organized into hemidesmosomes serve as anchorage points and receptors for BM components, and act as polarity inducers. Adhesion to the BM is necessary for non-neoplastic cell survival (Boudreau et al., 1995; Streuli and Gilmore, 1999; Taddei et al., 2003). Furthermore, α6- and β4-integrin signaling permits resistance to cytotoxicity induced by chemotherapeutic drugs (Weaver et al., 2002). Alterations to cell–BM interactions can trigger genome instability, including DNA loss, genomic amplifications and loss of heterozygosity (Radisky et al., 2005; Shekhar et al., 2003; Sternlicht et al., 1999). These observations indicate that basal polarity established by BM–hemidesmosome contact is an important component in the control of genome integrity.
Interestingly, the kinetics of DNA repair depend on chromatin compaction, and both DNA lesions and chromatin structure can control the recruitment of repair factors (Misteli and Soutoglou, 2009). The development of tissue architecture during mammary acinar morphogenesis is accompanied by extensive remodeling of the organization of both the chromatin and nonchromatin compartments of the cell nucleus (Lelièvre et al., 1998). Hence, we reasoned that changes in tissue architecture and accompanying alterations in nuclear organization must impact DSB repair, and set out to define the role of the architecture and cellular microenvironment on the repair processes in normal and diseased tissues. The 3D cell culture systems that recapitulate normal and pathological tissue architectures provide physiologically relevant models to address these issues. Specifically, we examine the impact of tissue morphogenesis on events associated with DDR using 2D and 3D cultures of breast epithelial cells in which the basal polarity can be manipulated. We show that basal polarity driven by α6- and β4-integrins regulates the cellular response to DSBs – in particular, the γH2AX response controlled by basal polarity is independent of 3D tissue morphogenesis, whereas DNA repair is influenced by acinar morphogenesis. We identify a unique relationship between basal polarity and the nuclear mitotic apparatus protein 1 (NuMA), which is a major structural nuclear protein and a guardian of breast epithelial differentiation. Furthermore, a role for NuMA in the control of the γH2AX response is revealed.
Results
The DDR is influenced by tissue polarity
The HMT-3522 breast epithelial non-neoplastic and cancer cell lines (Briand and Lykkesfeldt, 2001) are useful models for studying the response to DNA strand breaks in normal and malignant architectural contexts. When non-neoplastic HMT-3522 S1 cells are cultured in 3D in the presence of Engelbreth–Holm–Swarm (EHS)-derived ECM components, such as Matrigel (used in this study), they differentiate into polarized multicellular structures that are both morphologically and functionally similar to mammary acini. The basoapical polarity axis that is characteristic of normal epithelia is evidenced in S1 acini by the basal expression of α6- and β4-integrins and the formation of apical tight junctions (Petersen et al., 1992; Plachot et al., 2009) (supplementary material Fig. S1A). Malignant HMT-3522 T4-2 cells were derived from S1 cells after altering the culture conditions and two passages in nude mice (Briand and Lykkesfeldt, 2001). In 3D culture, T4-2 cells form disorganized nodules similar to invasive ductal carcinoma. These structures lack basoapical polarity, as integrins and tight junctions are distributed throughout the tumor nodules (Chandramouly et al., 2007; Weaver et al., 1997) (supplementary material Fig. S1A).
To measure the response to DNA damage in S1 acini and T4-2 nodules, γH2AX was detected by immunostaining after treatment with the radiomimetic drug bleomycin (BLM) (Fig. 1A). BLM was chosen because the drug induces mainly DSBs in proliferating cells as well as in growth-arrested cells (Mirabelli et al., 1982; Povirk, 1996). The number of cells with γH2AX foci was assessed immediately after BLM treatment and after 24 hours of recovery in medium lacking BLM. Compared with S1 acini, untreated and BLM-treated T4-2 nodules displayed a higher proportion of γH2AX-positive cells, which is consistent with DSBs resulting from DNA replication stress in cancer cells (Halazonetis et al., 2008). After recovery, the number of γH2AX-positive S1 cells decreased significantly (P=0.0017, unpaired t-tests, n=3) whereas the number of γH2AX-positive T4-2 cells did not (P=0.2895) (Fig. 1B). The disappearance of γH2AX foci in S1 acini could reflect DSB repair, but could also reflect apoptosis of damaged cells. To evaluate the latter possibility, apoptosis was measured using the terminal deoxynucleotidyl transferase dUTP nick end labeling (TUNEL) assay in parallel cultures. The percentage increase of apoptotic cells relative to the untreated control after 2 hours of BLM treatment (S1: 3.82±0.78, T4-2: 3.24±0.67) and after the 24 hour recovery period (S1: 4.14±0.82, T4-2: 4.35±1.22) was not significantly different between S1 acini and T4-2 nodules (P=0.5993 and 0.8904, respectively), suggesting that the disappearance of γH2AX labeling in S1 acini was a consequence of DSB repair activity.
Fig. 1.

DNA strand break repair in 3D culture. S1 cells, T4-2 cells and RT4-2 cells (T4-2 cells having undergone phenotypic reversion) were cultured in 3D in the presence of EHS gel (Matrigel) before induction of DSBs. (A) Immunostaining for γH2AX in S1 acini and T4-2 nodules treated either with bleomycin (BLM) or with vehicle (control) for 2 hours. Nuclei are counterstained with DAPI. γH2AX is shown alone in representative nuclei (insets). Scale bar, 5 μm. (B) Quantification of γH2AX-positive cells in S1 acini, T4-2 nodules and RT4-2 spheroids directly after a 2-hour treatment (BLM) and following a 24-hour recovery period in BLM-free medium (BLM, recovery). Results were normalized to vehicle-treated cells. *P<0.01, unpaired t-test, n=3. (C) Western blots for phosphorylated p53 (Ser 15), p53, phosphorylated chk2 (Thr 68) and chk2 in T4-2 nodules and RT4-2 spheroids after a 2-hour treatment with BLM or with vehicle. (D) Percentages of cells with repair foci detected by BrdU labeling, see B for treatment. Confocal images of BrdU signal (green) and of the DAPI counterstain (blue) are shown for control and BLM-treated (BLM) S1 acini. *P<0.01 compared with controls, Bonferroni, n=3. (E) Representative images illustrating the four grades (0, 1, 2 and 3) used for the analysis of comet assays with 3D multicellular structures. Larger T4-2 nodules are displayed at half the scale used for S1 acini and RT4-2 spheroids. Drawings represent the organization of the multicellular structures, with the typical distribution of basal polarity markers shown in green. (F) Comet assay scores for S1 acini, T4-2 nodules and RT4-2 spheroids after exposure to 3 Gy of gamma ionizing radiation (IR), directly after IR and after a 2-hour recovery period. *P<0.0001 and #P<0.001, Chi-square, n≥75, two independent biological replicates.
Differences in DSB repair between S1 and T4-2 cells might be because of the distinct tissue architectures in acini and tumor nodules. However, these differences could also be a consequence of genomic alterations in T4-2 cells (Briand and Lykkesfeldt, 2001; Rizki et al., 2008) or they could reflect additional phenotypic differences between the cell lines. Blocking the epidermal growth factor receptor (EGFR) pathway induces the phenotypic reversion of T4-2 cells (Wang et al., 1998), which is characterized by proliferation arrest and the formation of basally polarized multicellullar spheroids, although reverted T4-2 (RT4-2) cells conserve their genetic alterations (Weaver et al., 1997) (supplementary material Fig. S1A). Thus, the architectural organization of RT4-2 spheroids, despite lacking apical polarity, resembles that of S1 acini. The percentage of γH2AX-positive RT4-2 cells decreased during recovery from BLM-induced DSBs, although this decrease was not statistically significant (Fig. 1B). A slightly stronger apoptotic response was measured in RT4-2 spheroids directly after BLM treatment (1.48±0.38 fold) and also after the 24 hours recovery period (1.31±0.06 fold) compared with that of T4-2 nodules.
Activation of the ATM–chk2–p53 signaling pathway in response to DSBs is essential to prevent progression through the cell cycle when DNA damage is present, and for the induction of apoptosis if the damage cannot be processed (Khanna and Jackson, 2001). The increased apoptotic index and DSB repair activity in RT4-2 spheroids compared with that of T4-2 nodules suggests that the phenotypic reversion of cancer cells influences this pathway. To test this possibility, phosphorylation of the p53 and chk2 proteins was measured following BLM treatment of T4-2 nodules and RT4-2 spheroids. BLM-induced phosphorylation of p53 and chk2 was detected in both populations, but reverted cancer cells displayed a stronger response, consistent with their higher apoptotic rate (Fig. 1C).
Bromodeoxyuridine (BrdU) labeling of DNA repair foci (Balajee and Geard, 2001; Kao et al., 2001; Nelms et al., 1998) was used as an independent method to measure DSB repair activity (Fig. 1D). We observed a significant increase in the percentage of S1 acinar cells with BrdU repair foci after the induction of DNA strand breaks with BLM. This percentage increased further after 24 hours of recovery in medium lacking BLM. A substantial (yet delayed) increase in cells with repair foci was also observed in RT4-2 cells in response to BLM treatment. By contrast, there was no substantial increase in the percentage of cells with BrdU repair foci in T4-2 cells treated with BLM at any of the time-points. Similar results were obtained following the induction of DNA damage with ionizing radiation (supplementary material Fig. S1B), suggesting that the type of DNA-damaging treatment does not have an impact on the differences measured in strand break repair.
The single-cell gel electrophoresis assay (comet assay) is a direct method to measure DSBs (Olive and Banath, 2006). We adapted this assay for use with 3D culture, relying on a visual grading system for the quantification of DNA damage in undisrupted multicellular structures (Materials and Methods, Fig. 1E and supplementary material Fig. S2). A preliminary analysis revealed that structures in which severe DNA damage was measured were on average smaller than those with little or no DNA damage. This effect is likely to be due to a higher retention of DNA in the ‘head’ of the large structures (supplementary material Fig. S2D,E). Therefore, for comet assays that were performed using multicellular structures, comparisons for statistical significance were made only within populations of a similar phenotype (acini, spheroids or tumor nodules). Comet assay measurements were taken immediately after the exposure of cells to a 3Gy dose of gamma radiation, and then after a 2-hour recovery period. A significant decrease in DNA damage was measured upon recovery in S1 acini and RT4-2 spheroids, but not in T4-2 nodules (Fig. 1F). These results are consistent with H2AX phosphorylation and BrdU repair foci analyses, and indicate that T4-2 cancer cells reacquire the capability to repair DNA strand breaks upon the formation of basally polarized and growth-arrested structures. These data imply that the modulation of DNA repair mechanisms is related to changes in tissue architecture rather than mutational events within the malignant cells per se.
Basal polarity is a common architectural feature of S1 acini and RT4-2 spheroids, but it is absent from T4-2 nodules. To test whether the presence of basal polarity readily promotes DSB repair, we cultured S1 cells, T4-2 cells treated for reversion and T4-2 cells in 3D in the presence of the interstitial ECM component, collagen-I. In the presence of laminin-rich EHS gels, both S1 and RT4-2 cells form acinus-like structures with a continuous BM. However, in the presence of collagen-I gels, these cells produce multicellular structures that are similar in size to acini, but lack an organized endogenous BM. These structures display altered distributions of BM components and BM receptors (Chandramouly et al., 2007; Gudjonsson et al., 2003) (Fig. 2A). The repair activity in S1 cells treated with BLM was significantly lower in cultures containing collagen-I compared with EHS cultures, as measured by the percentage of cells with BrdU repair foci (Fig. 2B) – a similar observation was made for RT4-2 spheroids. Likewise, a greater decrease in DSBs was measured in S1 cells cultured in EHS gel compared with parallel cultures in collagen-I using the comet assay (Fig. 2C), suggesting that basal polarity modulates DSB repair activity.
Fig. 2.

Basement membrane signaling increases DSB repair in 3D culture. (A) Immunostaining for basal markers α6-integrin (α6I) and collagen-IV in S1 multicellular structures embedded in EHS or in collagen-I gels. Scale bar, 5 μm. (B) Percentages of cells with repair foci measured by BrdU labeling in 3D EHS gel and collagen-I cultures treated with either BLM or vehicle (control). *P<0.05, Bonferroni (n=3). Of note, no significant difference was measured for basal (control) conditions between the different cell types. (C) Comet assay scores for S1 multicellular structures formed either in EHS gel or in collagen-I and exposed to 3 Gy of gamma ionizing radiation (IR). Comet tails were scored directly after IR and also after a 2-hour recovery period. Controls were mock irradiated. *P<0.0001 and #P<0.05, Chi-square, n≥188, two independent biological replicates. Representative comet images are shown. (D) Percentages of cells with repair foci in S1 acini and RT4-2 spheroids incubated with either function-blocking α6-integrin antibody or immunoglobulin (IgG) before treatment with BLM. *P<0.05 compared with IgG, Tukey, n=3. (E) Comet assay scores for acini formed by wild-type (wt) S1 cells and S1 cells expressing a truncated form of β4-integrin fused to GFP (β4TL). Cells were treated as in C. *P<0.0001 and #P<0.001, n≥293, four independent biological replicates. ns, no significant difference.
In addition to distinct tissue architectures, T4-2 nodules have a higher proportion of proliferating cells compared with S1 acini. Phenotypic reversion of T4-2 cells re-establishes basal polarity but also drastically reduces cell proliferation (Chandramouly et al., 2007; Wang et al., 1998). The cell cycle status is known to influence DNA repair and notably the cellular choices between repair pathways (Mao et al., 2008), which might affect DSB repair efficacy. To investigate the possible impact of cell proliferation in polarity-dependent DSB repair, we analyzed the status of the cell cycle by using Ki67 immunostaining in different types of multicellular structures comprised of S1 cells. Compared with polarized S1 acini in EHS gels that repair with a higher efficacy, nonpolarized S1 structures in collagen-I had on average a sevenfold increase in the percentage of Ki67-positive cells (supplementary material Fig. S3A). We also compared 5- and 10-day cultures of S1 acini (supplementary material Fig. S3B). The 5-day cultures already exhibited basal polarity, as evidenced by the basal localization of α6-integrin. However, as expected, the 5-day cultures showed a higher (~15-fold) proportion of cells that were still in the cell cycle compared with 10-day acini, which were largely growth arrested. Full recovery from irradiation was measured in proliferating 5-day acini. Thus, exit from the cell cycle is not sufficient to account for the increased DSB repair activity measured in basally polarized structures.
Impairing basal polarity decreases DSB repair activity
Cell–BM interactions mediated by α6- and β4-integrin heterodimers are crucial for the establishment of basal polarity and BM signaling (Weaver et al., 2002; Weaver et al., 1997). To test whether α6- and β4-integrin signaling promotes DSB repair, S1 acini and RT4-2 spheroids were released from EHS gels by using dispase, incubated with function-blocking antibodies against α6-integrins or with nonspecific immunoglobulins (IgGs) for 30 minutes, and subsequently transferred into EHS gels in the presence of the same antibody. Following the induction of DNA damage with a 2-hour BLM treatment, a decrease in the number of S1 cells showing repair activity was measured in the acini population treated with antibodies that block α6-integrin function compared with the population treated with IgGs. Similarly, a reduction in the proportion of RT4-2 cells with repair foci was observed upon inhibition of α6-integrin function in basally polarized spheroids (Fig. 2D). Further evidence for the involvement of basal polarity signaling in DSB repair was obtained by comparing wild-type S1 acini with S1 acini expressing a green fluorescent protein (GFP)-tagged ‘tailless’ β4-integrin (S1 β4TL) lacking the cytosolic domain, which is necessary for signal transduction (Spinardi et al., 1995; Weaver et al., 2002). After 10 days in culture, S1 β4TL developed into spherical structures resembling S1 acini, with a similar proportion of proliferating cells (3.39±0.55 and 4.12±0.39 Ki67-positive nuclei for β4TL and wild-type S1 cells, respectively). In wild-type S1 acini, the majority of DSBs induced by a dose of 3 Gy ionizing radiation were repaired within 2 hours, whereas a substantial amount of damage remained in β4TL S1 cells under the same conditions (Fig. 2E). Together, these results indicate that tissue polarity through α6- and β4-integrin signaling promotes DSB repair in polarized mammary acini.
Flat monolayers of cells with basal polarity show enhanced γH2AX response but no increase in DSB repair activity compared with nonpolarized cells
The development of multicellular structures in 3D culture is accompanied by the rewiring of signal transduction cascades (Bissell et al., 2005; Wang et al., 1998). As cells in 2D culture can also be basally polarized, with the basal pole against the culture substratum (Grafton et al., 2011; Xu et al., 2009), we asked whether the 3D organization of acinar structures in addition to basal polarity was important for DSB repair. We produced a sheet of polarized cells in 2D culture by plating S1 cells on a dried EHS coat. Basal polarity was evidenced by basal localization of α6-integrin and the basal deposition of collagen-IV. By contrast, S1 cells on a dried collagen-I coat had a mesh-like α6-integrin distribution and collagen-IV could not be detected, which is consistent with disturbed basal polarity (Fig. 3A, supplementary material Fig. S4A).
Fig. 3.

Basal polarity influences H2AX phosphorylation but not DSB repair in flat monolayers of cells. S1 cells were seeded on dried EHS (which induces basal polarity) and dried collagen-I gels (which does not induce polarity) to form flat monolayers of cells (2D culture). (A) Immunostaining for α6-integrin (α6I). Maximal-intensity projections (top panels) and orthogonal views of confocal z-stacks (bottom panels) are shown. (B) Immunostaining for γH2AX in cell cultures treated with either BLM or vehicle (control). Nuclei are counterstained with DAPI (A,B). (C) Percentages of γH2AX-positive nuclei in cell cultures treated as in B. *P<0.05, Bonferroni, n=3. (D) Measurement of DSBs following either 3 Gy of gamma ionizing radiation (IR) or mock irradiation (control) using comet assays performed directly after irradiation or after a 2-hour recovery period. *P<0.001, Bonferroni, n=4. (E) Immunostaining for γH2AX (left) and α6-integrin (right) in S1 cells cultured on dried EHS and treated with BLM. Signals for α6-integrin are displayed with ‘Fire’ LUT to visualize signal intensity. Scale bars, 10 μm (A), 20 μm (B) and 200 μm (E). ns, no significant difference.
Immunostaining for γH2AX was used to examine the effect of basal polarity on the cellular response to DSBs in flat monolayers of S1 cells (Fig. 3B,C). More γH2AX-positive cells were observed in polarized cultures compared with nonpolarized cultures after BLM treatment. This result could not be explained by a reduction in the sensitivity of the nonpolarized cells to BLM, because a similar level of DSB damage was detected in collagen-I and EHS cultures (supplementary material Fig. S4B). Moreover, after exposure to a dose of 3 Gy ionizing radiation, a higher percentage of cells with γH2AX staining in EHS compared with collagen-I cultures was observed (59.0 vs 45.2%). A similar level of DSB damage was measured by using the comet assay in S1 cells on EHS and collagen-I gels after irradiation (Fig. 3D), suggesting further that differences in γH2AX levels did not merely reflect dissimilar densities of DSBs after BLM exposure. Immunostaining for Ki67 revealed similar proportions of cells in the cell cycle in both EHS and collagen-I cultures (8.6% and 10.4%, respectively), indicating that the increased γH2AX level in polarized cells was not caused by the differences in cell cycle status known to influence the intensity of γH2AX responses in mammary epithelial cells (Costes et al., 2010). Interestingly, regions with a high density of γH2AX signals within polarized flat monolayers of S1 cells treated with BLM coincided with strong α6-integrin staining (Fig. 3E). In addition, when compared with the wild-type, β4TL S1 cells cultured as flat monolayers showed a decreased γH2AX response after BLM treatment. The difference was smaller than that observed in the EHS–collagen-I comparison – however, β4TL-GFP expression was absent (or greatly reduced) in 30–50% of the β4TL S1 cell population (supplementary material Fig. S5A,B). The reduction of γH2AX level in nonpolarized flat monolayers of cells reveals an influence of basal polarity signaling on chromatin modifications induced in response to DSBs.
To assess DSB repair activity in polarized and nonpolarized flat monolayers of cells, S1 cells cultured on dried EHS or dried collagen-I gels were irradiated and DSBs were measured after a 2-hour recovery period. Similar decreases in DNA damage were measured under both conditions using the comet assay (Fig. 3D). A similar efficacy of DSB repair was also observed in wild-type and β4TL S1 cells (supplementary material Fig. S5C). These results suggest that acinar morphogenesis, that is, the establishment of cellular organization in 3D, modulates the effect of basal polarity on DSB repair activity.
The nuclear structural protein NuMA changes distribution upon DSB induction and mediates the γH2AX response in cells with basal polarity
The organization of the cell nucleus might influence the recognition of DSBs and their repair (Misteli and Soutoglou, 2009). Indeed, the difference in DSB repair activity measured in S1 and RT4-2 cells compared with that of T4-2 cells correlates with distinct chromatin contexts. As demonstrated previously, nuclei from S1 acini and RT4-2 spheroids have a similar higher-order chromatin organization, which is remarkably different from that observed in T4-2 tumor nodules (Chandramouly et al., 2007). The coiled-coil NuMA protein is a marker for nuclear organization in the mammary differentiation model (Knowles et al., 2006) and adopts a specific distribution pattern in basally polarized multicellular structures produced in 3D culture (Chandramouly et al., 2007). The differentiation-specific distribution of NuMA was lost in S1 acini treated with the function-blocking β4-integrin antibody used to abrogate α6- and β4-integrin signaling, but not in cells treated with β1-integrin function-blocking antibody and nonspecific IgG, which was used as a control (Fig. 4A; note the diffuse NuMA staining upon the β4-integrin blockade). Moreover, the formation of distinct NμMA foci, which is characteristic of acinar differentiation, was prevented in the nuclei of β4TL S1 acini expressing truncated β4-integrin–GFP (Fig. 4B). These observations imply that signaling emanating from the basement membrane contributes to the organization of the cell nucleus. Interestingly, no change in NuMA distribution was observed in nonpolarized S1 cells after BLM treatment, whereas the nuclear localization of NuMA appeared to be altered in polarized S1 acini after BLM exposure (Fig. 5A) – overall, NuMA immunostaining was more diffuse and appeared to accumulate in large nuclear regions with a low chromatin density, as shown by staining with DAPI.
Fig. 4.
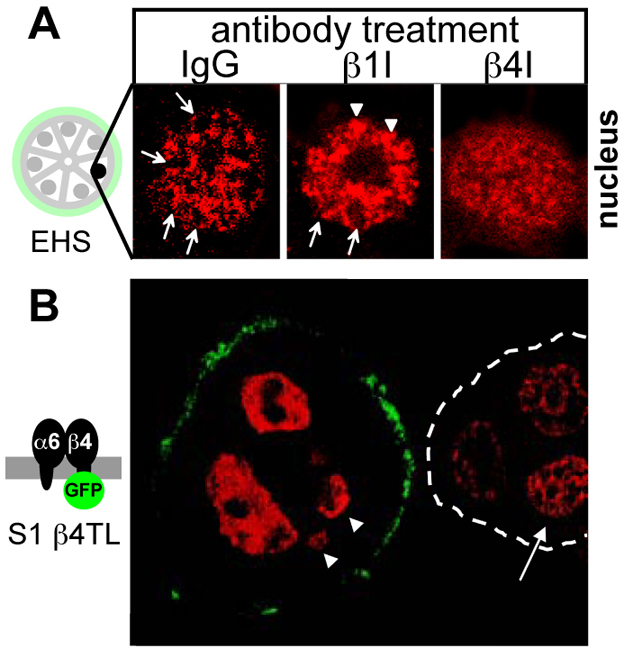
Plasticity of distribution in acini. (A) Immunostaining for NuMA in S1 acini treated with function-blocking antibodies against β1- and β4-integrins, and with nonspecific IgG from days 10 to 16 of 3D culture. Images represent single nuclei. Arrows point to NuMA staining in distinct foci that are often organized into rings and that are typically found upon acinar differentiation; arrowheads point to larger NuMA foci also often seen in the nuclei of acinar cells. (B) Immunostaining for NuMA (red) in S1 acinar cells expressing a truncated β4-integrin fused to GFP (β4TL) that is localized at the basal side of the acinus (green). Arrowheads point to nuclei that are partially out of the image plane. An adjacent acinus lacking β4TL expression (white broken line) is shown for comparison. The arrow points to a nucleus with distinct NuMA staining foci, which are typical of differentiated cells.
Fig. 5.

NuMA responds to DSBs. (A) NuMA immunostaining in S1 cells in 3D culture in either EHS or collagen-I gels and treated with BLM or with vehicle (control). The arrowhead indicates NuMA accumulation in DNA-poor regions. All nuclei are indicated by dotted lines. DAPI staining and merged images for single nuclei are shown in the insets and correspond to the nuclei with white dotted lines. Scale bar, 5 μm. (B) Quantitative analysis of NuMA immunostaining signals using Haralick texture descriptors reduced to a 3D composite feature space with principal-component analysis. High sensitivity and high specificity values indicate optimal classification. (C) NuMA distribution in flat monolayers of S1 cells on dried EHS or on dried collagen-I after BLM or vehicle treatments. Scale bar, 5 μm. Morphometric descriptors (D,E) and Haralick texture descriptors (F) derived from NuMA staining are used to compare NuMA distributions. In E, BLM-treated cells on EHS and collagen-I substrates are compared with a fused control group consisting of vehicle-treated cells from EHS and collagen-I cultures.
Quantitative image analysis has proven useful for monitoring changes in NuMA distribution (Knowles et al., 2006; Treiser et al., 2009). To quantitatively assess NuMA distribution in the absence or presence of BLM treatment, we used Haralick descriptors of NuMA texture (see Materials and Methods). Based on NuMA, the nuclei of cells treated with BLM were distinguishable from those of untreated cells in polarized acini (Fig. 5B). This was not the case for nonpolarized S1 multicellular structures cultured in collagen-I gels.
NuMA distribution in 2D culture was distinct from that observed in 3D culture, as demonstrated previously (Lelièvre et al., 1998). However, in 2D culture, the basally polarized flat monolayer of cells produced on dried EHS did not reveal striking differences in the distribution of NuMA when compared with that of a nonpolarized monolayer of cells produced on collagen-I gels upon BLM induction (Fig. 5C). To analyze precisely the behavior of NuMA in polarized and nonpolarized flat monolayers of cells, we performed high-content analysis of nuclear morphometric descriptors (Liu et al., 2010) in the absence or presence of BLM treatment (see supplementary material Fig. S6A). Polarized and nonpolarized cells displayed similar NuMA features under control conditions (Fig. 5D), yet they could be distinctly classified by the NuMA nuclear descriptors in the presence of DSBs (Fig. 5E). Interestingly, this difference persisted but was reduced when cells were allowed to recover from the BLM treatment for 20 hours (supplementary material Fig. S6B), supporting the hypothesis that DNA damage leads to long-lasting alterations in the genome (Costes et al., 2010). Nonpolarized S1 cells on dried collagen-I showed reduced modifications in NuMA upon BLM treatment compared with basally polarized cells on dried EHS, as revealed by Haralick analysis of immunostaining texture (Fig. 5F). This observation correlates with the decreased γH2AX response in cells on collagen-I (Fig. 3C). BLM-induced changes in the NuMA patterns were also greatly attenuated in T4-2 cells. T4-2 cells in 2D culture displayed a ‘fingerprint-like’ α6-integrin distribution, which was distinct from the fine punctate pattern observed in polarized S1 cells, and consistent with the altered cell–BM interaction characteristic of cancer cells (supplementary material Fig. S6B,C). These findings suggest that NuMA responds to DSB induction predominantly when the cells possess basal polarity.
DSB-induced changes in nuclear organization, reflected by NuMA distribution patterns, correlate with the amplitude of the γH2AX response in the polarized flat monolayers of cells. Hence, interfering with NuMA function under these culture conditions might affect the γH2AX response. To knock down NuMA expression, shRNA targeting NuMA were co-expressed with GFP in S1 cells. Scrambled (nontargeting) shRNA was used as a control. Cells transfected with NuMA shRNA exhibited a 50% decrease in the expression of NuMA, as shown by the quantification of fluorescent immunostaining signals, whereas no substantial change in the expression levels of NuMA was measured in cells transfected with the nontargeting shRNA control (Fig. 6A,B). NuMA silencing led to a significant decrease in the percentage of BLM-treated cells showing a γH2AX response (Fig. 6C). A similar observation was made in S1 cells transfected with NuMA siRNAs (at least 46% of cells expressing the NuMA protein were below the immunostaining detection threshold) for which, on average, a 30.4% reduction in the proportion of cells with γH2AX was measured after BLM treatment compared with the nontargeting siRNA control.
Fig. 6.

NuMA influences H2AX phosphorylation. (A) Immunostaining for NuMA (red) in S1 cells expressing either shRNA targeting NuMA or scrambled shRNA (nontarget), as well as GFP. Arrows indicate cells with GFP signals. (B) Quantification of NuMA fluorescence signals in microscopy images. *P<0.001, Tukey, n>20 nuclei from two biological replicates. (C) Quantification of γH2AX prevalence in GFP-positive S1 cells transfected with nontargeting shRNA constructs or with NuMA-specific shRNA constructs after treatment with either BLM or vehicle (control). Data are normalized to BLM-treated cells transfected with nontargeting shRNAs. *P<0.05, one-sample t-test, n=3. (D) Dual NuMA–Ki67 immunostaining in S1 cells transfected with siRNAs targeting NuMA. The white lines in the merged image distinguish individual nuclei. (E–H) U2OS cells with stable genomic integrations of the I-SceI restriction site flanked by Lac repeats were used to visualize γH2AX and 53BP1 at broken DNA ends. (E) Detection of Lac arrays after transient expression of LacR–CFP (green) and immunostaining for γH2AX (red, left panel) and 53BP1 (red, right panel). DSBs were induced by I-SceI expression. Arrows point to the location of LacR–CFP. These representative fluorescence images are shown adjacent to the schematic of the experiment, in which the I-SceI site and flanking Lac array are enlarged. (F) Immunostaining and (G) western blot analysis of NuMA in U2OS cells transfected with either nontargeting or NuMA-targeting siRNAs. (H) Quantification of H2AX phosphorylation (left panel) and recruitment of 53BP1 (right panel) at DSBs. Values are expressed relative to cells expressing both I-SceI and nontargeting siRNAs. *P=0.001, one-sample t-test, n≥5. Scale bars, 10 μm.
It is well established that NuMA is involved in mitosis (Radulescu and Cleveland, 2010). Therefore, the silencing of NUMA1 might have altered the percentage of cells in the cell cycle, which might in turn have influenced the γH2AX response. However, similar percentages of Ki67-positive cells were measured in cells transfected with siRNAs targeting NuMA or with nontargeting siRNA (34.3±4.2 vs 39.6±4.4, respectively). Moreover, the fact that Ki67 staining was either present or absent in individual cells did not seem to correlate with the striking changes observed in NuMA expression (Fig. 6D).
To examine further the role of NuMA in H2AX phosphorylation, we used a cell-based system, in which DSBs can be induced at defined genomic sites (Fig. 6E–H). These human osteosarcoma cells contain stable genomic integrations of the I-SceI restriction site flanked by an array of Lac-repressor binding sites. Transient expression of the fluorescently tagged Lac repressor (LacR–CFP) permitted the visualization of the Lac arrays adjacent to the I-SceI restriction site, and expression of the I-SceI endonuclease led to the induction of DSBs (Fig. 6E). Transfection with NuMA siRNAs triggered an ~80% reduction in NuMA levels compared with transfection with nontargeting siRNAs, as was revealed by immunostaining and western blot analysis (Fig. 6F,G). Immunostaining was used to detect γH2AX at the I-SceI–Lac arrays, and overlap between CFP and immunostaining signals was scored in cells transfected with nontargeting siRNAs or NuMA siRNAs. A 20% decrease in γH2AX at DSB foci was measured in cells where the expression of NuMA was silenced. By contrast, the recruitment of the DDR mediator 53BP1 was not affected in cells treated with NuMA siRNAs, suggesting that NuMA depletion only affects specific molecular aspects of the DDR (Fig. 6H). Indeed, the initial recruitment of 53BP1 at DSBs does not depend on γH2AX (Celeste et al., 2003) but, rather, on the methylation of histones H3K79 or H4K20 (Huyen et al., 2004; Sanders et al., 2004).
Discussion
The influence of tissue architecture on the control of cell fate and tumorigenesis is increasingly being recognized (Bissell et al., 2002; Lelièvre, 2010; Weaver et al., 2002). Our results show that tissue architecture influences DSB repair in a 3D model of breast epithelia. The loss of basal polarity in non-neoplastic cells reduced their DSB repair efficacy, and the re-establishment of basal polarity in cancer cells led to an increase in the repair of DSBs and the activation of cell cycle checkpoints. DSB repair in reverted cancer cells was slightly delayed and less effective compared with that of non-neoplastic S1 cells in acini. In addition, a stronger apoptotic response to DSB induction was measured in RT4-2 spheroids compared with S1 acini. The difference in the response to DSB induction between S1 and RT4-2 cells might be linked to the many mutations in the genome of malignant T4-2 cells, which undermine repair activity and/or architectural features that are not recapitulated during T4-2 reversion. For example, apical polarity is present in S1 acini but not in RT4-2 spheroids. Interestingly, PAR3, a tight junction protein involved in apical polarity, was shown to regulate DSB repair by interacting with the Ku70–Ku80 heterodimer (also known as XRCC6–XRCC5) in the nucleus (Fang et al., 2007), and a number of other apical polarity complex proteins can influence chromatin organization (reviewed by Lelièvre, 2010). These observations suggest that both basal and apical poles of the polarity axis influence nuclear functions. When comparing all experiments (S1 acini in EHS vs spheroids in collagen-I; S1 acini at 5-days vs 10-days in 3D culture; and β4TL-expressing acini vs wild-type S1 acini), changes in the proportion of cells in the cell cycle in nonpolarized compared with polarized structures cannot explain the differences observed in DSB repair. Although we do not exclude the fact that cell proliferation influences DSB repair in the 3D tissue models – and notably the choice between repair pathways – our results suggest that tissue architecture is a major factor controlling the integrity of the genome.
Genes encoding ECM components are upregulated in tumors that are resistant to anticancer treatments (Pan et al., 2009; Sherman-Baust et al., 2003), and tumor cell adhesion to the ECM increases resistance to anticancer agents (Streuli and Gilmore, 1999). Moreover, remodeling of the ECM in response to irradiation is suggested to contribute to genomic instability and carcinogenesis induced by ionizing radiation (Barcellos-Hoff, 1998). The organization of α6- and β4-integrins in the hemidesmosome establishes a continuum between the BM, the cytosol and the nucleus for bidirectional signaling between cells and their microenvironment (reviewed by Lelièvre, 2009). Although several mechanisms including drug penetration (Tannock et al., 2002) and mechano-transduction (Paszek et al., 2005) might link changes in the composition of the ECM to increased cell survival, our results suggest that transduction of the BM signals by α6- and β4-integrins also plays an important role in the response of cells to DSBs.
Interestingly, the effect of basal polarity on DSB repair efficacy measured in 3D cultures was not reproduced in the absence of acinar morphogenesis in 2D cultures. Different cell behaviors in 2D vs 3D cultures have previously been reported, notably regarding β1-integrin signaling and EGFR signaling, and other signaling pathways (Beliveau et al., 2010; Bissell et al., 2005; Liu et al., 2004; Wang et al., 1998), illustrating the importance of tissue morphogenesis in establishing specific signaling networks. Previous studies have compared DNA repair in the context of 3D and 2D cultures with conflicting results. Similar responses to DSB induction by gamma irradiation were measured in MCF10A cells cultured in 2D and in 3D (Lin et al., 2009). By contrast, Sowa and colleagues observed a higher rate of survival against X-rays in cells that were irradiated in 3D cultures and subsequently propagated in 3D compared with parallel 2D cultures (Sowa et al., 2010). The divergence between these results might originate from differences between the cell models and experimental designs.
The possibility that chromatin compaction might influence DNA repair capability is extremely attractive. Indeed, chromatin compaction can be controlled by tissue architecture, cell shape and extranuclear signaling (Lelièvre, 2010). Decreased radiosensitivity has been measured in cancer cells in 3D cultures relative to 2D cultures. Specifically, an increase in the chromatin compaction of cells in 3D culture was proposed to account for the difference (Storch et al., 2010). Mechanisms that reduce chromatin compaction in response to DNA damage involve chromatin remodeling factors (Misteli and Soutoglou, 2009; van Attikum and Gasser, 2009), as well as the mobilization of structural nuclear proteins, such as heterochromatin protein 1-beta (Ayoub et al., 2008). Our data suggest that NuMA, a structural protein present in both the insoluble portion and the chromatin compartment of the cell nucleus, and previously implicated in the control of cell fate and chromatin organization (Abad et al., 2007; Chandramouly et al., 2007), responds to DSB induction in cells with basal polarity. Dramatic changes in NuMA distribution patterns occur during S1 acinar differentiation (Knowles et al., 2006; Lelièvre et al., 1998). We have shown here that the differentiation-related redistribution of NuMA is abolished when BM signaling is blocked by using antibodies against β4-integrins and in S1 cells expressing the dominant-negative tailless β4-integrin. In RT4-2 basally polarized spheroids, partial reorganization of the NuMA protein following reversion of the malignant phenotype has been documented (Chandramouly et al., 2007). Thus, tissue contexts leading to a higher rate of DSB repair have similar distribution patterns for NuMA. Surprisingly, in 2D cultures on dried EHS, the presence of basal polarity at the bottom of a flat monolayer of S1 cells does not apparently influence DSB repair, yet the extent of DSB-induced chromatin modification (illustrated by the level of γH2AX) correlates with the basal polarity status and with changes associated with NuMA morphometric parameters. Finally, the fact that silencing NuMA expression reduces the γH2AX response in two very different cell models (mammary and osteosarcoma cells) establishes that structural components of the nucleus are involved in the orchestration of the DDR.
NuMA is a unique nuclear protein so far, because its distribution is modified by changes in basal polarity. Thus, NuMA might act as a mediator of the DDR controlled by basal polarity. How basal polarity signals to NuMA remains to be elucidated, and there are several exciting possibilities to investigate further. The chemical alteration of NuMA might be important, as it is phosphorylated by ATM and/or ATR in response to induction of DNA damage (Matsuoka et al., 2007; Stokes et al., 2007). As a chromatin organizer, NuMA might interact with chromatin remodeling complexes involved in the DDR, which could explain why the silencing of NuMA expression would have an effect on H2AX phosphorylation. Furthermore, a number of nuclear functions, including DNA repair (Soutoglou et al., 2007), require stable anchorage. We have shown previously that part of the pool of NuMA proteins cannot be solubilized, even with a high NaCl concentration (Lelièvre et al., 1998), thus, the insoluble NuMA protein might comprise part of the framework necessary to stabilize the repair machinery for DSBs.
Materials and Methods
Cell culture, phenotypical manipulation and transfection
Non-neoplastic S1 cells and S1-derived malignant T4-2 cells of the HMT-3522 mammary cancer progression series (Briand and Lykkesfeldt, 2001) were cultured in H14 medium (Blaschke et al., 1994). S1 acinar differentiation and T4-2 tumor nodule formation were achieved after 10 days in 3D culture. Briefly, cells were seeded on a thin layer of EHS-derived hydrogel (Matrigel, BD Biosciences) in H14 that was supplemented with 5% Matrigel drip, as described previously (Plachot et al., 2009). Phenotypic reversion of T4-2 cells in 3D culture was induced by treatment with 100 nM EGFR inhibitor Tyrphostin AG1478 (Calbiochem) (Wang et al., 1998). To induce the formation of growth-arrested S1 and RT4-2 multicellular spheroids lacking basoapical polarity, cells were seeded in type-I collagen (Cellagen Solution AC-5, ICN Biomedicals) (Chandramouly et al., 2007). For experiments comparing EHS with collagen-I conditions in 3D culture, cells were also embedded in EHS gel, as described previously (Plachot et al., 2009), instead of using the drip method. For flat monolayer (2D) cultures, cells were seeded on glass coverslips in 12-well plates, and incubated with H14 medium for 10 days. Some of the coverslips were precoated with Matrigel (9.6 μg protein/cm2) or collagen-I (5.9 μg protein/cm2) and allowed to dry overnight before cell seeding. Monolayers of S1 cells were transfected 4 days after seeding with pcDNA-GFP and HuSH shRNA plasmids (OriGene, Cambridge, UK) to express NuMA-specific (5′-GAGAGCAAGGAGTTGAAGCGGCTGGTGAT-3′) or nontargeting scrambled shRNAs. The Lipofectamine 2000 reagent (Invitrogen) was used for shRNA and siRNA (ON-TARGETplus, Dharmacon) transfections. Immunostaining was performed at day 6 post-transfection. A monoclonal human osteosarcoma U2OS cell line with stable genomic integrations of Lac repressor binding arrays adjacent to I-SceI restriction sites was generated as described previously (Soutoglou et al., 2007) and maintained in Dulbecco's modified Eagle's medium (DMEM) supplemented with 10% FBS (Invitrogen). Cells were transfected with siRNAs and 72 hours later transfected again with the Lac-CFP and I-SceI plasmids, each time using Lipofectamine 2000.
Induction of DNA strand breaks
Cells were treated with 10 mU/ml of bleomycin (Calbiochem) for 2 hours. Alternatively, cells were subjected to 3 Gy of ionizing radiation using a Gammacell 220 irradiator (Nordion). Control cultures were mock irradiated.
Immunofluorescence
Cells cultured in 3D were either directly immunostained or embedded in Tissue-Tek OCT (Sakura Finetek, The Netherlands), frozen and sectioned for immunostaining. Immunostaining of 2D and 3D cultures was performed as described previously (Chandramouly et al., 2007) using antibodies against γH2AX [Ser139, Trevigen (80 μg/ml) and Millipore (5 μg/ml)], Ki67 (1:1000, Vector Laboratories), Collagen-IV [clone CIV 22, Dako (2 μg/ml)], 53BP1 (5 μg/ml, Abcam), ZO1 (5 μg/ml, Invitrogen) and NuMA (B1C11, ~15 μg/ml; a gift from Jeffrey A. Nickerson, University of Massachusetts Medical School, Worcester, MA). Blockade and detection of α6- and β4-integrins were achieved as described previously (Weaver et al., 2002). Nuclei were counterstained with 4′,6-diamidino-2-phenylindole (DAPI) and samples were mounted in ProLong antifade solution (Molecular Probes). Fluorescence signals were monitored with an Olympus IX70 equipped with a 60× oil immersion [numerical aperture (NA) 1.4] objective and a Retiga 1300 CCD camera (QImaging). Confocal imaging was performed with a Zeiss CLSM710 confocal microscope, using a 100× oil-immersion (NA 1.4) objective. Images were processed and analyzed using ImageJ (http://rsbweb.nih.gov/ij/). For the quantification of NuMA expression in cells co-transfected with shRNA and GFP, the average NuMA signal intensity in nuclei (selected using the DAPI images) was calculated in GFP-positive cells, as well as in three neighboring nontransfected (GFP-negative) cells, after background subtraction.
Cell classification through high-content profiling of NuMA organization
Images of immunostained samples were captured by using a TCS SP2 confocal microscope (Leica Microsystems Inc.), using a 63× (NA 1.3) glycerin-immersion objective. Multichannel images were collected for NuMA, DAPI, 53BP1 and γH2AX staining. Optical sections (~20 μm thickness) were taken, with a step size of 0.5 μm. Average projection images were generated and used for image analysis (Liu et al., 2010) (see schematic in supplementary material Fig. S5). Briefly, images were exported to Image Pro Plus (Media Cybernetics) for background subtraction, contrast enhancement, mask creation, filtering and segmentation. Images were then processed to yield three categories of nuclear features describing: reporter protein expression (intensity-based); reporter morphology; and texture and spatial distribution (higher-order moments) within cell nuclei. Principal component analysis was used to reduce the high-dimension datasets to three uncorrelated groups of nuclear descriptors, which were visualized using 3D graphs. Further classification was performed using linear discriminant analysis or a support vector machine classifier to assess the differences between various experimental conditions. High values for sensitivity and specificity (>90%) indicated optimal classification (two distinguishable datasets), while low values for sensitivity and low specificity (<60%) indicated poor classification (two nondistinguishable datasets). Immunostaining for DDR markers (53BP1 and γH2AX) was used to supervise NuMA analysis – cells with high marker expression in samples treated with BLM and cells with low marker expression in control samples were used for NuMA morphometric analysis. For texture analysis, higher-order Haralick texture features (Haralick et al., 1973) were captured as a set of gray-tone spatial-dependence matrices, from which four statistical moments (mean, standard deviation, kurtosis and skewness), each being part of a set of 13 distinct measures of textural features, were extracted as the high-content texture descriptors.
Apoptosis assay
Apoptosis was assessed using an in situ cell death detection kit [terminal deoxynucleotidyl transferase dUTP nick end labeling (TUNEL) assay, Roche] according to the manufacturer's recommendations. Results for apoptosis were computed as the number of cells displaying a fluorescent and condensed nucleus divided by the total number of cells scored.
BrdU labeling of DNA repair foci
Labeling with 5-bromo-2′-deoxyuridine (BrdU) was used to measure DSB repair (Kao et al., 2001). Cells were incubated for 1 hour in H14 supplemented with BrdU. Incorporated BrdU was immunodetected using the BrdU in situ detection kit (Roche), following the manufacturer's protocol. Well-defined repair foci were distinguished from the more diffuse signals in DNA replicating cells. At least 300 cells were scored per condition.
Comet assay
DSBs were measured using the comet assay, which was performed under neutral conditions. For monolayer (2D) cultures, single-cell suspensions were processed according to the manufacturer's recommendations (CometAssay kit, Trevigen) and the percentage of DNA in the tails was determined using the CometScore software (TriTek Corp.). In 3D cultures, the comet assay was performed on intact multicellular structures. These structures were released from the EHS gel after incubation with ice-cold phosphate-buffered saline (PBS)–EDTA (Lee et al., 2007), suspended in low-melting-point agarose and further processed. For comparisons between 3D cultures in EHS and collagen-I gels, 3D multicellular structures were isolated after solubilizing the exogeneous ECM at 37°C with dispase (BD Biosciences) and collagenase (Invitrogen), respectively. A visual scoring protocol was used, in which DNA damage was classified as absent (grade=0), mild (grade=1, little DNA in the tail), medium (grade=2, less than half of the DNA in the tail) or severe (grade=3, more than half of the DNA in the tail). Representative comet images of S1, T4-2 and reverted T4-2 structures are displayed with corresponding grades in Fig. 1E. Blind grading was performed by an investigator who did not have access to the treatment information. For each treatment, the percentage of structures that fell into each grade category was calculated, weighted by multiplying by the grade category (0, 1, 2, 3) and summed, leading to comet assay scores that were used for data representation. Results that were obtained using this visual-analysis protocol were consistent with quantification using the CometScore software (see supplementary material Fig. S2A–C). Visual grading proved more effective and better adapted than image analysis by CometScore to the high background generated in the gel by the presence of small amounts of ECM gel contaminants. We used intact 3D structures for comet assay analysis because trypsin or EDTA at 37°C that is normally used to separate cells was found to accentuate DNA damage and to alter nuclear organization in 3D culture (P.-A. Vidi and S.A. Lelièvre, unpublished). Different types of multicellular structures – for example, acini, spheroids and tumor nodules – are different in size, and in preliminary tests, the larger structures showed an apparent reduction in DNA damage (supplementary material Fig. 2D–F). It is likely that these structures retained larger amounts of DNA in the ‘head’ of the comet, thus, yielding apparently lower comet assay scores. Therefore, comparisons using statistical analysis were made only within the same type of multicellular structures.
Western blot analysis
Acini, tumor nodules and acinus-like spheroids were isolated from 3D cultures by treatment with dispase, followed by lysis with 2% sodium dodecyl sulfate (SDS) in PBS. Equal amounts of proteins were separated by SDS-polyacrylamide gel electrophoresis (PAGE), transferred onto nitrocellulose membranes and immunoblotted with antibodies against chk2 (0.5 μg/ml, Abcam), phosphorylated chk2 [Thr68 (0.5 μg/ml), R&D Systems], p53 (1:500, Cell Signaling) and phosphorylated p53 [Ser15 (1:1000), Cell Signaling].
Statistical analysis
Data are presented as means ±s.e.m. Statistical analysis was performed using Prism (GraphPad Software). The Student's t-test and one-way analysis of variance (ANOVA) followed by Bonferroni's post hoc test are indicated by the corresponding P values in the figure legends. A P value of <0.05 was considered significant. For comet assays, grading results from different replicate experiments were summed and arranged in contingency tables. Statistical significance was assessed using the Chi-square test.
Supplementary Material
Acknowledgements
We thank Jun Xie for advice regarding statistical analysis, Jeffrey A. Nickerson for providing antibodies against NuMA, Sloan McCormick Sypher for technical assistance, members of the Laboratory for Computational Imaging at Rutgers University for guidance, and Tom Misteli, Ourania Andrisani and Joëlle K. Muhlemann for useful comments on the manuscript.
Footnotes
Funding
This work was funded by the National Institutes of Health [grant numbers R01CA112017 to S.A.L., P41EB001046 NIBIB-funded RESBIO (Integrated Technology Resource for Polymeric Biomaterials) to P.V.M.]; the Bay Area Physical Sciences-Oncology Center, University of California, Berkeley, California [grant numbers R37CA064786, U54CA126552, R01CA057621, U54CA112970, U01CA143233 and U54CA143836 to M.J.B.]; the U.S. Department of Energy, Office of Biological and Environmental Research and Low Dose Radiation Program (contract no. DE-AC02-05CH1123 to M.J.B.); the US Department of Defense [grant number W81XWH0810736 to M.J.B.]; and postdoctoral fellowships from the Novartis Foundation and the Swiss National Science Foundation [grant number PBNEA–116967 to P.A.V.]. This research was also supported in part by the Intramural Research Program of the NIH, the National Cancer Institute and the Purdue University Center for Cancer Research. Deposited in PMC for release after 12 months.
Supplementary material available online at http://jcs.biologists.org/lookup/suppl/doi:10.1242/jcs.089177/-/DC1
References
- Abad P. C., Lewis J., Mian I. S., Knowles D. W., Sturgis J., Badve S., Xie J., Lelièvre S. A. (2007). NuMA influences higher order chromatin organization in human mammary epithelium. Mol. Biol. Cell 18, 348-361 [DOI] [PMC free article] [PubMed] [Google Scholar]
- Ayoub N., Jeyasekharan A. D., Bernal J. A., Venkitaraman A. R. (2008). HP1-beta mobilization promotes chromatin changes that initiate the DNA damage response. Nature 453, 682-686 [DOI] [PubMed] [Google Scholar]
- Balajee A. S., Geard C. R. (2001). Chromatin-bound PCNA complex formation triggered by DNA damage occurs independent of the ATM gene product in human cells. Nucleic Acids Res. 29, 1341-1351 [DOI] [PMC free article] [PubMed] [Google Scholar]
- Barcellos-Hoff M. H. (1998). The potential influence of radiation-induced micro-environments in neoplastic progression. J. Mammary Gland Biol. Neoplasia 3, 165-175 [DOI] [PubMed] [Google Scholar]
- Beliveau A., Mott J. D., Lo A., Chen E. I., Koller A. A., Yaswen P., Muschler J., Bissell M. J. (2010). Raf-induced MMP9 disrupts tissue architecture of human breast cells in three-dimensional culture and is necessary for tumor growth in vivo. Genes Dev. 24, 2800-2811 [DOI] [PMC free article] [PubMed] [Google Scholar]
- Bissell M. J., Radisky D. C., Rizki A., Weaver V. M., Petersen O. W. (2002). The organizing principle: microenvironmental influences in the normal and malignant breast. Differentiation 70, 537-546 [DOI] [PMC free article] [PubMed] [Google Scholar]
- Bissell M. J., Kenny P. A., Radisky D. C. (2005). Microenvironmental regulators of tissue structure and function also regulate tumor induction and progression: the role of extracellular matrix and its degrading enzymes. Cold Spring Harb. Symp. Quant. Biol. 70, 343-356 [DOI] [PMC free article] [PubMed] [Google Scholar]
- Blaschke R. J., Howlett A. R., Desprez P. Y., Petersen O. W., Bissell M. J. (1994). Cell differentiation by extracellular matrix components. Methods Enzymol. 245, 535-556 [DOI] [PubMed] [Google Scholar]
- Boudreau N., Sympson C. J., Werb Z., Bissell M. J. (1995). Suppression of ICE and apoptosis in mammary epithelial cells by extracellular matrix. Science 267, 891-893 [DOI] [PMC free article] [PubMed] [Google Scholar]
- Briand P., Lykkesfeldt A. E. (2001). An in vitro model of human breast carcinogenesis: epigenetic aspects. Breast Cancer Res. Treat. 65, 179-187 [DOI] [PubMed] [Google Scholar]
- Celeste A., Fernandez-Capetillo O., Kruhlak M. J., Pilch D. R., Staudt D. W., Lee A., Bonner R. F., Bonner W. M., Nussenzweig A. (2003). Histone H2AX phosphorylation is dispensable for the initial recognition of DNA breaks. Nat. Cell Biol. 5, 675-679 [DOI] [PubMed] [Google Scholar]
- Chandramouly G., Abad P. C., Knowles D. W., Lelièvre S. A. (2007). The control of tissue architecture over nuclear organization is crucial for epithelial cell fate. J. Cell Sci. 120, 1596-1606 [DOI] [PubMed] [Google Scholar]
- Ciccia A., Elledge S. J. (2010). The DNA damage response: making it safe to play with knives. Mol. Cell 40, 179-204 [DOI] [PMC free article] [PubMed] [Google Scholar]
- Costes S. V., Chiolo I., Pluth J. M., Barcellos-Hoff M. H., Jakob B. (2010). Spatiotemporal characterization of ionizing radiation induced DNA damage foci and their relation to chromatin organization. Mutat. Res. 704, 78-87 [DOI] [PMC free article] [PubMed] [Google Scholar]
- Fang L., Wang Y., Du D., Yang G., Tak Kwok T., Kai Kong S., Chen B., Chen D. J., Chen Z. (2007). Cell polarity protein Par3 complexes with DNA-PK via Ku70 and regulates DNA double-strand break repair. Cell Res. 17, 100-116 [DOI] [PubMed] [Google Scholar]
- Grafton M. M., Wang L., Vidi P. A., Leary J., Lelievre S. A. (2011). Breast on-a-chip: mimicry of the channeling system of the breast for development of theranostics. Integr. Biol. (Camb.) 3, 451-459 [DOI] [PubMed] [Google Scholar]
- Gudjonsson T., Ronnov-Jessen L., Villadsen R., Bissell M. J., Petersen O. W. (2003). To create the correct microenvironment: three-dimensional heterotypic collagen assays for human breast epithelial morphogenesis and neoplasia. Methods 30, 247-255 [DOI] [PMC free article] [PubMed] [Google Scholar]
- Halazonetis T. D., Gorgoulis V. G., Bartek J. (2008). An oncogene-induced DNA damage model for cancer development. Science 319, 1352-1355 [DOI] [PubMed] [Google Scholar]
- Haralick R. M., Shanmuga K., Dinstein I. (1973). Textural features for image classification. IEEE Trans. Syst. Man. Cybern. 3, 610-621 [Google Scholar]
- Huyen Y., Zgheib O., Ditullio R. A., Jr, Gorgoulis V. G., Zacharatos P., Petty T. J., Sheston E. A., Mellert H. S., Stavridi E. S., Halazonetis T. D. (2004). Methylated lysine 79 of histone H3 targets 53BP1 to DNA double-strand breaks. Nature 432, 406-411 [DOI] [PubMed] [Google Scholar]
- Kao G. D., McKenna W. G., Yen T. J. (2001). Detection of repair activity during the DNA damage-induced G2 delay in human cancer cells. Oncogene 20, 3486-3496 [DOI] [PubMed] [Google Scholar]
- Khanna K. K., Jackson S. P. (2001). DNA double-strand breaks: signaling, repair and the cancer connection. Nat. Genet. 27, 247-254 [DOI] [PubMed] [Google Scholar]
- Knowles D. W., Sudar D., Bator-Kelly C., Bissell M. J., Lelièvre S. A. (2006). Automated local bright feature image analysis of nuclear protein distribution identifies changes in tissue phenotype. Proc. Natl. Acad. Sci. USA 103, 4445-4450 [DOI] [PMC free article] [PubMed] [Google Scholar]
- Lee G. Y., Kenny P. A., Lee E. H., Bissell M. J. (2007). Three-dimensional culture models of normal and malignant breast epithelial cells. Nat. Methods 4, 359-365 [DOI] [PMC free article] [PubMed] [Google Scholar]
- Lelièvre S. A. (2009). Contributions of extracellular matrix signaling and tissue architecture to nuclear mechanisms and spatial organization of gene expression control. Biochim. Biophys. Acta 1790, 925-935 [DOI] [PMC free article] [PubMed] [Google Scholar]
- Lelièvre S. A. (2010). Tissue polarity-dependent control of mammary epithelial homeostasis and cancer development: an epigenetic perspective. J. Mammary Gland Biol. Neoplasia 15, 49-63 [DOI] [PMC free article] [PubMed] [Google Scholar]
- Lelièvre S. A., Weaver V. M., Nickerson J. A., Larabell C. A., Bhaumik A., Petersen O. W., Bissell M. J. (1998). Tissue phenotype depends on reciprocal interactions between the extracellular matrix and the structural organization of the nucleus. Proc. Natl. Acad. Sci. USA 95, 14711-14716 [DOI] [PMC free article] [PubMed] [Google Scholar]
- Lin Y. F., Nagasawa H., Peng Y., Chuang E. Y., Bedford J. S. (2009). Comparison of several radiation effects in human MCF10A mammary epithelial cells cultured as 2D monolayers or 3D acinar stuctures in matrigel. Radiat. Res. 171, 708-715 [DOI] [PubMed] [Google Scholar]
- Liu E., Gordonov S., Treiser M. D., Moghe P. V. (2010). Parsing the early cytoskeletal and nuclear organizational cues that demarcate stem cell lineages. Cell Cycle 9, 2108-2117 [DOI] [PubMed] [Google Scholar]
- Liu H., Radisky D. C., Wang F., Bissell M. J. (2004). Polarity and proliferation are controlled by distinct signaling pathways downstream of PI3-kinase in breast epithelial tumor cells. J. Cell Biol. 164, 603-612 [DOI] [PMC free article] [PubMed] [Google Scholar]
- Mao Z., Bozzella M., Seluanov A., Gorbunova V. (2008). DNA repair by nonhomologous end joining and homologous recombination during cell cycle in human cells. Cell Cycle 7, 2902-2906 [DOI] [PMC free article] [PubMed] [Google Scholar]
- Matsuoka S., Ballif B. A., Smogorzewska A., McDonald E. R., 3rd, Hurov K. E., Luo J., Bakalarski C. E., Zhao Z., Solimini N., Lerenthal Y., et al. (2007). ATM and ATR substrate analysis reveals extensive protein networks responsive to DNA damage. Science 316, 1160-1166 [DOI] [PubMed] [Google Scholar]
- Mirabelli C. K., Ting A., Huang C. H., Mong S., Crooke S. T. (1982). Bleomycin and talisomycin sequence-specific strand scission of DNA: a mechanism of double-strand cleavage. Cancer Res. 42, 2779-2785 [PubMed] [Google Scholar]
- Misteli T., Soutoglou E. (2009). The emerging role of nuclear architecture in DNA repair and genome maintenance. Nat. Rev. Mol. Cell Biol. 10, 243-254 [DOI] [PMC free article] [PubMed] [Google Scholar]
- Nelms B. E., Maser R. S., MacKay J. F., Lagally M. G., Petrini J. H. (1998). In situ visualization of DNA double-strand break repair in human fibroblasts. Science 280, 590-592 [DOI] [PubMed] [Google Scholar]
- Olive P. L., Banath J. P. (2006). The comet assay: a method to measure DNA damage in individual cells. Nat. Protoc. 1, 23-29 [DOI] [PubMed] [Google Scholar]
- Pan S., Cheng L., White J. T., Lu W., Utleg A. G., Yan X., Urban N. D., Drescher C. W., Hood L., Lin B. (2009). Quantitative proteomics analysis integrated with microarray data reveals that extracellular matrix proteins, catenins, and p53 binding protein 1 are important for chemotherapy response in ovarian cancers. OMICS 13, 345-354 [DOI] [PMC free article] [PubMed] [Google Scholar]
- Paszek M. J., Zahir N., Johnson K. R., Lakins J. N., Rozenberg G. I., Gefen A., Reinhart-King C. A., Margulies S. S., Dembo M., Boettiger D., et al. (2005). Tensional homeostasis and the malignant phenotype. Cancer Cell 8, 241-254 [DOI] [PubMed] [Google Scholar]
- Petersen O. W., Ronnov-Jessen L., Howlett A. R., Bissell M. J. (1992). Interaction with basement membrane serves to rapidly distinguish growth and differentiation pattern of normal and malignant human breast epithelial cells. Proc. Natl. Acad. Sci. USA 89, 9064-9068 [DOI] [PMC free article] [PubMed] [Google Scholar]
- Plachot C., Chaboub L. S., Adissu H. A., Wang L., Urazaev A., Sturgis J., Asem E. K., Lelièvre S. A. (2009). Factors necessary to produce basoapical polarity in human glandular epithelium formed in conventional and high-throughput three-dimensional culture: example of the breast epithelium. BMC Biol. 7, 77 [DOI] [PMC free article] [PubMed] [Google Scholar]
- Povirk L. F. (1996). DNA damage and mutagenesis by radiomimetic DNA-cleaving agents: bleomycin, neocarzinostatin and other enediynes. Mutat. Res. 355, 71-89 [DOI] [PubMed] [Google Scholar]
- Radisky D. C., Levy D. D., Littlepage L. E., Liu H., Nelson C. M., Fata J. E., Leake D., Godden E. L., Albertson D. G., Nieto M. A., et al. (2005). Rac1b and reactive oxygen species mediate MMP-3-induced EMT and genomic instability. Nature 436, 123-127 [DOI] [PMC free article] [PubMed] [Google Scholar]
- Radulescu A. E., Cleveland D. W. (2010). NuMA after 30 years: the matrix revisited. Trends Cell Biol. 20, 214-222 [DOI] [PMC free article] [PubMed] [Google Scholar]
- Rizki A., Weaver V. M., Lee S. Y., Rozenberg G. I., Chin K., Myers C. A., Bascom J. L., Mott J. D., Semeiks J. R., Grate L. R., et al. (2008). A human breast cell model of preinvasive to invasive transition. Cancer Res. 68, 1378-1387 [DOI] [PMC free article] [PubMed] [Google Scholar]
- Sanders S. L., Portoso M., Mata J., Bahler J., Allshire R. C., Kouzarides T. (2004). Methylation of histone H4 lysine 20 controls recruitment of Crb2 to sites of DNA damage. Cell 119, 603-614 [DOI] [PubMed] [Google Scholar]
- Shekhar M. P., Pauley R., Heppner G. (2003). Host microenvironment in breast cancer development: extracellular matrix-stromal cell contribution to neoplastic phenotype of epithelial cells in the breast. Breast Cancer Res. 5, 130-135 [DOI] [PMC free article] [PubMed] [Google Scholar]
- Sherman-Baust C. A., Weeraratna A. T., Rangel L. B., Pizer E. S., Cho K. R., Schwartz D. R., Shock T., Morin P. J. (2003). Remodeling of the extracellular matrix through overexpression of collagen VI contributes to cisplatin resistance in ovarian cancer cells. Cancer Cell 3, 377-386 [DOI] [PubMed] [Google Scholar]
- Soutoglou E., Dorn J. F., Sengupta K., Jasin M., Nussenzweig A., Ried T., Danuser G., Misteli T. (2007). Positional stability of single double-strand breaks in mammalian cells. Nat. Cell Biol. 9, 675-682 [DOI] [PMC free article] [PubMed] [Google Scholar]
- Sowa M. B., Chrisler W. B., Zens K. D., Ashjian E. J., Opresko L. K. (2010). Three-dimensional culture conditions lead to decreased radiation induced cytotoxicity in human mammary epithelial cells. Mutat. Res. 687, 78-83 [DOI] [PubMed] [Google Scholar]
- Spinardi L., Einheber S., Cullen T., Milner T. A., Giancotti F. G. (1995). A recombinant tail-less integrin beta 4 subunit disrupts hemidesmosomes, but does not suppress alpha 6 beta 4-mediated cell adhesion to laminins. J. Cell Biol. 129, 473-487 [DOI] [PMC free article] [PubMed] [Google Scholar]
- Sternlicht M. D., Lochter A., Sympson C. J., Huey B., Rougier J. P., Gray J. W., Pinkel D., Bissell M. J., Werb Z. (1999). The stromal proteinase MMP3/stromelysin-1 promotes mammary carcinogenesis. Cell 98, 137-146 [DOI] [PMC free article] [PubMed] [Google Scholar]
- Stokes M. P., Rush J., Macneill J., Ren J. M., Sprott K., Nardone J., Yang V., Beausoleil S. A., Gygi S. P., Livingstone M., et al. (2007). Profiling of UV-induced ATM/ATR signaling pathways. Proc. Natl. Acad. Sci. USA 104, 19855-19860 [DOI] [PMC free article] [PubMed] [Google Scholar]
- Storch K., Eke I., Borgmann K., Krause M., Richter C., Becker K., Schrock E., Cordes N. (2010). Three-dimensional cell growth confers radioresistance by chromatin density modification. Cancer Res. 70, 3925-3934 [DOI] [PubMed] [Google Scholar]
- Streuli C. H., Gilmore A. P. (1999). Adhesion-mediated signaling in the regulation of mammary epithelial cell survival. J. Mammary Gland Biol. Neoplasia 4, 183-191 [DOI] [PubMed] [Google Scholar]
- Taddei I., Faraldo M. M., Teuliere J., Deugnier M. A., Thiery J. P., Glukhova M. A. (2003). Integrins in mammary gland development and differentiation of mammary epithelium. J. Mammary Gland Biol. Neoplasia 8, 383-394 [DOI] [PubMed] [Google Scholar]
- Tannock I. F., Lee C. M., Tunggal J. K., Cowan D. S., Egorin M. J. (2002). Limited penetration of anticancer drugs through tumor tissue: a potential cause of resistance of solid tumors to chemotherapy. Clin. Cancer Res. 8, 878-884 [PubMed] [Google Scholar]
- Treiser M. D., Yang E. H., Gordonov S., Cohen D. M., Androulakis I. P., Kohn J., Chen C. S., Moghe P. V. (2009). Cytoskeleton-based forecasting of stem cell lineage fates. Proc. Natl. Acad. Sci. USA 107, 610-615 [DOI] [PMC free article] [PubMed] [Google Scholar]
- van Attikum H., Gasser S. M. (2009). Crosstalk between histone modifications during the DNA damage response. Trends Cell Biol. 19, 207-217 [DOI] [PubMed] [Google Scholar]
- Wang F., Weaver V. M., Petersen O. W., Larabell C. A., Dedhar S., Briand P., Lupu R., Bissell M. J. (1998). Reciprocal interactions between beta1-integrin and epidermal growth factor receptor in three-dimensional basement membrane breast cultures: a different perspective in epithelial biology. Proc. Natl. Acad. Sci. USA 95, 14821-14826 [DOI] [PMC free article] [PubMed] [Google Scholar]
- Weaver V. M., Petersen O. W., Wang F., Larabell C. A., Briand P., Damsky C., Bissell M. J. (1997). Reversion of the malignant phenotype of human breast cells in three-dimensional culture and in vivo by integrin blocking antibodies. J Cell Biol 137, 231-245 [DOI] [PMC free article] [PubMed] [Google Scholar]
- Weaver V. M., Lelièvre S. A., Lakins J. N., Chrenek M. A., Jones J. C., Giancotti F., Werb Z., Bissell M. J. (2002). beta4 integrin-dependent formation of polarized three-dimensional architecture confers resistance to apoptosis in normal and malignant mammary epithelium. Cancer Cell 2, 205-216 [DOI] [PMC free article] [PubMed] [Google Scholar]
- Xu R., Nelson C. M., Muschler J. L., Veiseh M., Vonderhaar B. K., Bissell M. J. (2009). Sustained activation of STAT5 is essential for chromatin remodeling and maintenance of mammary-specific function. J. Cell Biol. 184, 57-66 [DOI] [PMC free article] [PubMed] [Google Scholar]
Associated Data
This section collects any data citations, data availability statements, or supplementary materials included in this article.