Abstract
In the 1970–1980’s, a number of papers explored the role of the transitional and burst features in consonant-vowel context. These papers left unresolved the relative importance of these two acoustic cues. This research takes advantage of refined signal processing methods, allowing for the visualization and modification of acoustic details. This experiment explores the impact of modifying the strength of the acoustic burst feature on the recognition scores Pc(SNR) (function of the signal-to-noise ratio), for four plosive sounds /ta, ka, da, ga/. These results show high correlations between the relative burst intensity and the scores Pc(SNR). Based on this correlation, one must conclude that these bursts are the primary acoustic cues used for the identification of these four consonants. This is in contrast to previous experiments, which used less precise methods to manipulate speech, and observe complex relationships between the scores, bursts and transition cues. In cases where the burst feature is removed entirely, it is shown that naturally existing conflicting acoustic features dominate the score. These observations seem directly inconsistent with transition cues playing a role: if the transition cues were important, they would dominate over low-level conflicting burst cues. These limited results arguably rule out the concept of redundant cues.
INTRODUCTION
In the 1970–1980’s, a number of papers explored the role of the transitional and burst features in consonant-vowel context. Cole and Scott (1974a) proposed that the burst must play at least a partial role in perception, along with transition and speech energy envelope cues. This work was mainly a review of the literature (it did not provide any novel experimental results).
Explicitly responding to the Cole and Scott (1974a) study, Dorman et al. (1977) executed an extensive experiment, using natural speech consisting of nine vowels, proceeded by /b,d,g/. The experimental procedure consisted of truncating the consonant burst and the devoiced transition (following the burst), of a CVC, and then splicing these onto a second VC sound, presumably having no transition component (since it had no initial consonant). Their results were presented as a complex set of interactions between the initial consonant (burst and devoiced cue) and the following vowel (i.e., coarticulations). Given the state of the speech analysis tools in 1977, this was technically a difficult experiment to control. One is impressed with the detail in the work, and the difficulty of analyzing such a large number of modified sounds.
The same year, Blumstein et al. (1977) published a related /b,d,g/ study, using synthetic speech, that also presented a look at the burst and a host of transition cues. They explored the possibility that the cues were integrated (acted as a whole). This study was looking to distinguish the necessary from the sufficient cues, and first introduced the concept of conflicting cues, in an attempt to pit one type (burst cues) against the other (transition cues). This paper also introduced a relatively novel adaptation paradigm, which takes advantage of a fatiguing effect: e.g., If one listens to the same /b/many times, it sounds more like /g/. While this sounds like a somewhat exotic method, it was deemed necessary, due to the inability, when using the tools of the day, to resolve the many complex issues between the two types of trading cues. The results seem consistent with the hypothesis that when using synthetic speech, the cues are not always fused as one, raising the question of the validity and utility of synthetic speech in such research. If this is true, it would be difficult to conclude anything about the cues of natural speech by using synthetic speech. In fact, while these three key publications highlighted the relative importance of the two main types of acoustic cues, burst and transition, they left unresolved their relative importance.
Masking is the classical key element basic to an information theoretic analysis of any communication channel (Allen, 2005a,b; Fletcher, 1921; Shannon, 1948). In these three studies, no such masking noise was used, ruling out any form of information analysis.
Fletcher (1921) and French and Steinberg (1947) defined the articulation index (AI) as an underlying average measure of human speech recognition (Allen, 2005a,b). According to the AI model, sound is separated into critical bands by the filtering stage of the cochlea. These narrow-band information channels dictate basic speech perception. Namely, changing the SNR of a particular critical band (an auditory channel) leads to errors associated with recognition of a given phone. The AI measure is a sufficient statistic, composed of the average SNR in critical bands, expressed in dB. In 1921, Fletcher showed that the total average phone error is the product of critical band errors, and showed that (Allen, 2005b; Fletcher, 1921; French and Steinberg, 1947). Thus, the AI is an objective measure that is proportional to the average log phoneme error (Appendix A of Li et al. (2010)).
Another speech measure outlined by Wang and Bilger (1973) modeled distinctive features (DF), using Sequential Information Analysis (SINFA) on confusion matrices (CM). This iterative process assigned scores to a set of distinctive features, such as Vocalic, Frication, Duration etc., for the target consonant (e.g., /t/ had a Voicing weight of 0, but an Anterior weight of 1, while /v/ had a Voicing weight of 1 and a Continuant weight of 1, etc.). Then, using these weights, entropy and the CM data, each utterance, from each individual, was iteratively re-weighted on each of the distinctive features, indicating whether it was heavier on one type of articulation or another (e.g., more vocalic or less vocalic). Wang and Bilger attempted to capture the amount of information transmitted (Miller and Nicely, 1955) from the talker to the listener by categorizing distinctive feature information in the speech sound, with the goal of identifying confusion groups and how they form. But in the end, little in the way of cues were identified by the use of the SINFA method.
Distinctive features make up a useful speech sound classification scheme, but should not be confused with acoustic features, or even worse, perceptual features (i.e., events) (Cole and Scott, 1974b), which are defined here as the perceptual response to an acoustic cue. Furthermore, the uniqueness of the distinctive categories has not been established (there is no single agreed upon system of distinctive features).
Many other studies have attempted to link perceptual events such as formant changes, or duration of closure, to accurate perception (Kadambe and Burns, 2000; Sendlmeier, 1989; Tallal et al., 1996). However, such modifications do not seem to robustly improve recognition (i.e., in noise).
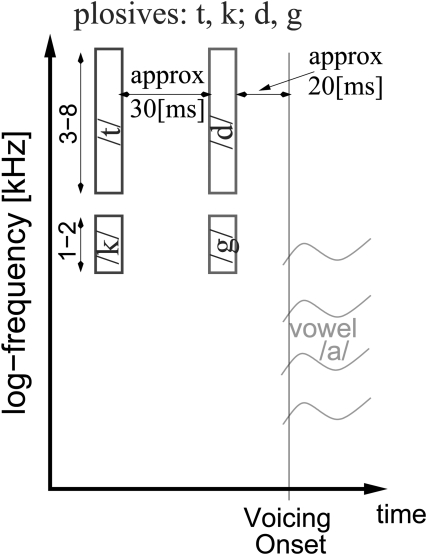
An acoustic feature is defined as a representation of the acoustic signal in time and frequency, which is used by the auditory system to decode the phoneme (Cole and Scott, 1974b; Cooper et al., 1952). Some of these acoustic features are identified as perceptual cues (events). Figure 1 is a modified version of the graphic by Allen and Li (2009), detailing the various acoustic cues for CV sounds, specifically with the vowel /a/, that were established to be events using a method denoted the three-dimensional deep search (3DDS) (Li et al., 2010). Briefly summarized, the CV sounds /ta, da/were found to contain energy at high frequencies, and we refer to this as a high frequency burst. Also, /ka, ga/ contained energy at mid frequencies, and we refer to this as a mid frequency burst. The recognition of consonants depends on the delay between the burst and the sonnorant onset, defined as the voice onset time (VOT). Consonants /t, k/ are voiceless sounds, occurring about 50 [ms] before the onset of voicing while /d, g/ have a VOT <20 [ms].
Figure 1.
(Color online) Modified version of the graphic created by Allen and Li (2009) displaying the acoustic feature for the plosives. The abscissa is on a log-frequency scale. Energy in the 2–3 [kHz] range will cause the listener to perceive either a higher frequency sound (/t,d/), or a mid frequency sound (/g,k/). Voiced plosives /g,d/ occur less than 20 [ms] before the onset of voicing (VOT<20 [ms]), while voiced /k,t/ have a small VOT duration (≈50 [ms]).
Gordon-Salant (1986) approached the question of primary acoustic features by increasing the consonant to vowel energy ratio. The tests were performed on young and old listeners, using real speech at an SNR of +6 [dB] and at 75 and 90 [dB-SPL], with 19 consonants and three vowels. Gordon-Salant modified the entire consonant region, meaning that any features for other consonants present (due to poor articulation), were also amplified. This would likely reduce the impact of the modification on the consonant recognition. The Gordon-Salant study demonstrated that modifying the entire consonant region can result in an increase in the recognition score.
The analysis by Gordon-Salant was then extended by Hazan and Simpson (1998). Their experiment was conducted with real speech on VCV’s using 12 consonants and three vowels, spoken by one phonetically trained talker. The relative intensity of each burst was increased by 12 [dB] and the stimuli were presented at 0 and −5 [dB] SNR. In a separate test, the relevant burst was bandpass filtered while the formant transitions was increased by +6 [dB]. Subsequently, Hazan and Simpson conducted the same experiment using full sentences, drawing attention to the importance of word context effects. The use of only two SNRs reveals little about the speech. This is particularly true if the unmodified consonant has a high recognition score (>95%) at the test SNRs, causing a ceiling effect. Also, Hazan and Simpson focused their discussion on the effects of modifying both the burst and formant transition. Finally, their analysis considered the average results for the three very different classes of consonants, that is, plosives, fricatives and nasals. The research presented here is an attempt to extend these results (and those of Ohde et al., 1995, Ohde and Stevens, 1983), by applying more conditions and focusing on fewer sounds, with a different analysis method, as described in Sec. 2.
Li et al. (2010) described an analysis scheme denoted the 3D deep search (3DDS) method, to identify speech features for a variety of real speech sounds. 3D deep search uses extensive psychophysical experimental data. Their experiments employed a variety of SNRs, time truncation and high and low pass filtering to modify CV sounds. These experiments made it possible to locate the perceptually relevant features in time and frequency, while the SNR data was intended to characterize the feature strength.
The research presented here shows that, while leaving the transition component unmodified, the relative energy of plosive-burst has a direct one-to-one relationship to the consonants intelligibility. This is shown by using a different approach to assessing the change in intelligibility, as described in the following sections. Similar evidence for a transition component in natural speech is not observed. The studies of Allen and Li (2009); Li and Allen (2011); Li et al. (2010); Régnier and Allen (2008) have demonstrated that masking the burst feature with noise abruptly reduces the intelligibility of speech sounds. In this study, we show that selective amplification and attenuation of these small but critical time-frequency consonant burst regions, within the critical bands covering the burst, systematically (and significantly) shift the recognition scores Pc(SNR). Our interpretation of these results is that the relative intensity of the plosive burst and its relationship to the onset of sonnerance are the primary contributors to correct identification. This is in contrast to previous work which emphasized the shape and spectrum of the burst along with the glide of the formant transition following the burst (Kewley-Port et al., 1983; Stevens and Blumstein, 1978).
METHODS
Stimuli
Speech stimuli used in this experiment were CV syllables chosen from the four plosives /t,k,d,g/, followed by the vowel /a/. The idea was to sample the variation across talkers from the larger set of CVs having known acoustic cues. Samples were initially drawn randomly from the large subset of sounds having known features, as characterized by 3DDS (Li et al., 2010). This created an initial sample-space of conditions. This initial set was then modified to assure a more uniform coverage over the many different talkers and features. In the final set each CV was spoken by six different talkers, three male and three female. All the sounds were from the LDC2005S22 corpus (“Articulation Index Corpus” provided by the Linguistic Data Consortium, University of Pennsylvania). Data from Phatak et al. (2008) verified that these utterances had 0% recognition error at and above +12 dB SNR. A total of 14 different talkers were used, two of whom had spent some part of their childhood outside the US while others had early training in a language other than English (Fousek et al., 2004). Each speech stimulus was modified at the specific time frequency feature location, as determined by the 3DDS method (Li et al., 2010). The specific regions as defined in Table TABLE I., were manually selected based on the AIgram [critical band’s spectrogram referenced to the noise floor (Régnier and Allen, 2008)]. Pilot tests were conducted to verify the effectiveness of each modification, as follows: (1) The feature-removed version was played to the HSR research group. (2) If the sound is still recognized as the original sound with >10% score, then the modification was deemed ineffective, thus the time-frequency modification region was increased in area. (3) Steps 1 and 2 were then repeated. (4) Finally, the best six out of eight talkers were picked for each CV tested, as judged by a team of experienced listeners (e.g., members of the research group)
TABLE I.
Information on each sound (see Figs. 211 for visual explanations). The row labels (column 1) indicate the speech sound. The remaining columns are: Figure #: figure number giving more information about a particular sound, Δt [cs]: the corresponding duration of the modification, Flo [kHz], Fhi [kHz]: the lowest and highest frequencies, respectively, at which the modification was made, ΔSNR+ [dB]: the estimated SNR shift (calculation explained in Appendix B) for the feature-amplified version of the sound (negative, to indicate that the sound requires a lower SNR to achieve the same performance as the unmodified sound), ΔSNR_ [dB]: the SNR shifts for the feature-attenuated version of the sound (positive, to indicate that the sound requires a higher SNR to achieve the same performance as the unmodified sound). Italicized values for ΔSNR± are further discussed in Secs. 4B, 4C, 4D, 4E.
| Figure | Δt | Flo | Fhi | ΔSNR+ | ΔSNR_ | |
|---|---|---|---|---|---|---|
| Sound | # | [cs] | [kHz] | [kHz] | [dB] | [dB] |
| m104ta | — | 5.3 | 1.4 | 5.7 | −5.1 | 5.8 |
| f101ta | — | 8.8 | 1.7 | 7.4 | −5.6 | 10.9 |
| m112ta | 2, 6 | 4.3 | 2.1 | 7.4 | −2.2 | 3.3 |
| f105ta | 5 | 7.0 | 1.5 | 7.4 | −8.7 | 5.0 |
| m115ta | — | 8.5 | 1.5 | 7.4 | −5.0 | 6.8 |
| f119ta | — | 7.3 | 1.7 | 7.4 | −6.7 | 4.5 |
| m111ka | 11 | 5.0 | 0.6 | 2.7 | −3.7 | 4.0 |
| f113ka | 3 | 5.8 | 0.7 | 2.3 | −7.3 | 6.1 |
| m115ka | 5 | 5.0 | 0.6 | 2.4 | −5.3 | 6.1 |
| f103ka | 2 | 5.3 | 1.1 | 2.1 | −5.7 | 5.1 |
| m118ka | 8, 6 | 4.5 | 0.8 | 2.0 | −2.0 | 2.7 |
| f108ka | 9 | 7.0 | 0.9 | 1.9 | −9.6 | ∞ |
| m102da | 4 | 5.3 | 1.2 | 4.6 | −4.6 | 5.8 |
| f101da | 10, 6 | 4.8 | 1.7 | 7.4 | 0.0 | 0.0 |
| m111da | — | 9.5 | 1.8 | 7.4 | −2.6 | 6.0 |
| f105da | 6 | 7.5 | 1.6 | 7.4 | −3.5 | 2.5 |
| m117da | — | 8.0 | 1.4 | 4.7 | −4.7 | 3.1 |
| f119da | 2, 5 | 7.8 | 2.1 | 7.4 | −8.5 | 2.8 |
| m111ga | 5 | 7.5 | 0.3 | 2.4 | −7.0 | 4.4 |
| f101ga | 4 | 4.5 | 0.7 | 2.3 | −5.1 | 6.2 |
| m118ga | — | 3.8 | 0.7 | 2.0 | −2.6 | 5.1 |
| f103ga | 6 | 4.5 | 0.5 | 2.4 | −5.5 | 2.8 |
| m115ga | 2 | 6.3 | 1.0 | 2.1 | −7.7 | 10.6 |
| f106ga | — | 2.8 | 0.4 | 2.4 | −3.6 | 9.2 |
Modification to stimuli
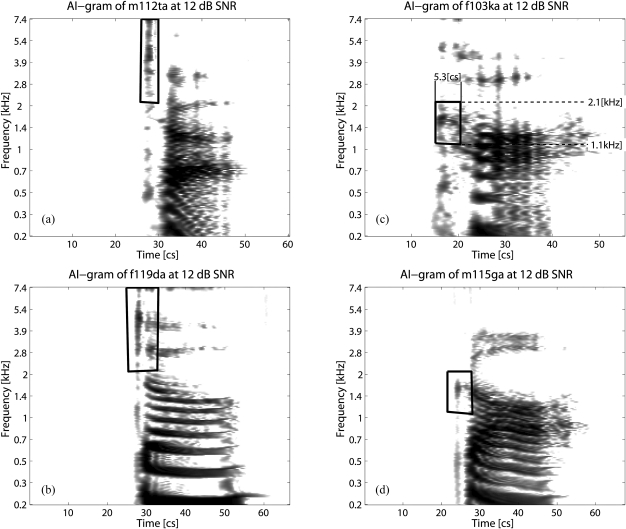
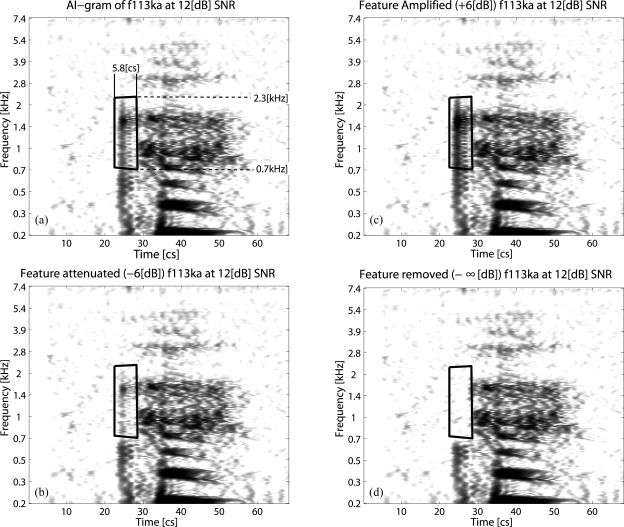
The signal level of the perceptual feature location was modified in three ways: +6 [dB] (×2), −6 [dB] (÷2) and −∞ [dB] (removal). The unmodified sound (×1 or 0 [dB]) was included as a control. Typical modification regions are shown in Fig. 2, while the resulting change in the AIgram is shown in Fig. 3. All modifications were made to the clean speech sample and noise was then added, following the modifications to the clean speech. As an example, the top right panel of Fig. 2 shows the modified region of Female talker 103 saying /ka/ (f103ka) at 12 dB SNR.
Figure 2.
AIgrams showing sample modifications of: (a) Male talker 112 saying /ta/ (m112ta), (c) female talker 103 saying /ka/ (f103ka), (b) female talker 119 saying /da/ (f119da), and (d) male talker 115 saying /ga/ (m115ga). Each figure is an AIgram (Régnier and Allen, 2008) of the unmodified speech stimuli, at 12 [dB] SNR. The dark regions in the image are those components of the speech sound in time and frequency that are above the noise floor. The white regions represent the noise floor (i.e., 0 [dB]). The demarcated regions are the hand-picked time frequency regions, based on 3DDS estimates (Li et al., 2010), modified for the experiment. The AIgram for f103ka (top right) contains the duration and frequency range of modification, as listed in Table TABLE I..
Figure 3.
AIgrams of the four conditions used: (a) The AIgram of the unmodified f113ka, showing the feature region, listed in Table TABLE I.. (c) The AIgram of the feature-amplified (+6 [dB]) version of f113ka. (b) The AIgram of the feature-attenuated (–6 [dB]) version of f113ka. (d) The AIgram of the feature-removed (–∞ [dB]) version of f113ka. A marked change in the relative energy of the feature is easily visible, after these modifications.
Noise conditions
White noise was added to the burst-modified stimuli. The noise was generated at five different wideband root mean square (RMS) signal to noise ratios: −12, −6, 0, 6 and 12 [dB]. The SNR is always based on the unmodified sound rather than on the modified sound, so that the noise is always the same across all modifications, except of course in the burst region. The SNR calculation is detailed in Appendix A.
Procedure
Since the experimental set consists of only four consonants, six non-plosive consonants were added to the presentations, so that the listeners would not deduce the experimental subset. Each of these six non-plosive consonants was spoken by six different talkers at the 5 SNR levels (−12, −6, 0, 6 and 12 [dB])—a total of 180 extra stimuli. These 180 sounds, along with the experimental set of 480 (4 plosives × 6 talkers × 5 noise levels × 4 modification types) brought the total number of sounds to 660. The listeners used a GUI interface designed in MATLAB, that displayed a grid of 20 options, including 18 CV syllables (/p,t,k,b,d,g,s,∫,z,ʒ,ð,θ,f,h,l,m,n,v/ with the vowel /a/). Two additional options were “Only Noise” and “Other,” for unidentified sounds. The stimuli were presented via a computer running Ubuntu 7.04 Linux kernel 2.6li.20-17-generic. The computer CPU was outside the single-walled testing booth (Acoustic Systems model number 27930). The headphones were Sennheiser HD280.
The experiment began with (typically) a two minute practice session run at 18 [dB] SNR, with feedback (the correct CV was revealed to the subject, after they made their choice). When a particular CV was not correctly recognized, it was placed at the end of the practice list. This was done a maximum of three times for any given CV. If the listener responded accurately to a practice stimuli (the first or second time), the consonant was not repeated.
The practice session was followed by three experimental sessions, during which subjects were asked to take breaks to avoid fatigue. Each session presented 220 sounds, and lasted about 20 minutes. During the experimental run, there was no feedback, to reduce learning effects.
Subjects
Listeners were recruited by advertisement and were paid. The primary (L1) language of all subjects was English. There were 26 normal hearing (self reported) listeners between the ages of 19 and 61. All but one listener was born in the US (she was born in Malaysia, thus was not part of the final data set). All but two of the listeners had a Midwestern accent. The experiment was run with University IRB approval.
RESULTS
The data are first plotted as confusion patterns (CPs), defined as the proportion of correct responses for a particular CV by a talker as a function of SNR (Allen, 2005a). Of the 26 listeners in the experiment, five were removed, because they failed to identify ≥90% of the unmodified speech stimuli at the 12 [dB] SNR condition. By doing this we ensure that the data are not contaminated by listeners who perform the task poorly. This left 21 listeners.
When the response from a particular listener was “Only Noise” or “Other,” every phone in the corresponding row of the CP at that particular SNR was updated by adding 1/18, representing the listener’s option to pick a consonant at random from the closed set.
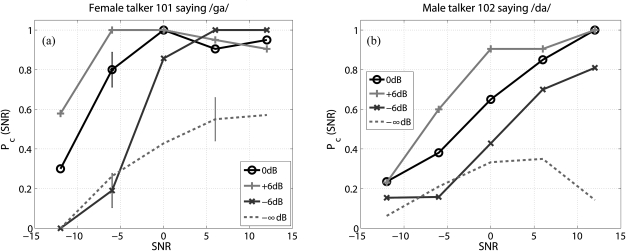
The curves representing the recognition scores of each version of the particular sound were plotted together, as shown in Fig. 4. Each of the curves of the modified sounds are shifted relative to the corresponding curve of the unmodified sound, by an amount indicating the effectiveness of the modification. The curves of the feature-amplified sounds shift to the left, indicating that the sound is better recognized at each SNR than the corresponding unmodified sound. The curves of the feature-attenuated sounds shift to the right, indicating that the sound has lower recognition at each SNR than the unmodified version. The scores for the CV having the feature-removed sounds show lowered performance, than all other versions. Also, one standard-deviation error bars are shown at some SNRs. The standard-deviation is calculated assuming that the sounds behave as Bernoulli trials, where the stimulus is recognized either correctly or incorrectly, according to , where Pc is the recognition score, Pe = 1 − Pc is the error in recognition and N is the number of listeners (that is to say, the number of responses to a particular sound at that SNR). In our case, N is fixed at 21.
Figure 4.
(Color online) Comparison of recognition scores of the original (unmodified) and the three different modifications (feature-amplified, feature-attenuated and feature-removed) of the sounds f101ga (a) and m102da (b), to exemplify the modifications. When the burst is attenuated by 6 dB, the score shifts to the right, indicating that a higher SNR is required for the same performance as the unmodified sound. When the feature is amplified by 6 dB, the score shifts to the left, indicating improved performance by the magnitude of the shift. When the feature is completely removed, the scores drop more than when the feature is attenuated by 6 [dB] (dashed line), indicating the importance of the modification region. One standard-deviation bars are shown for f101ga (a) at a few SNRs. They are calculated using the equation . Only a few error bars are shown since they only depend on Pc.
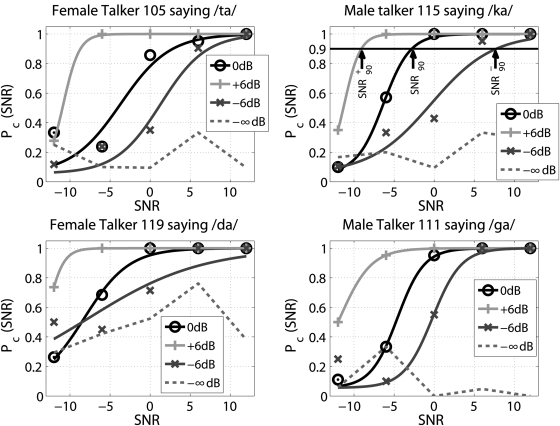
Each of the data points representing the proportion of correct responses (Pc) of the feature-amplified, feature-attenuated and unmodified sounds is fitted to a sigmoid function, as discussed in Appendix B. The sigmoid was chosen because it provides a reasonable estimate of the average Pc for CVs (French and Steinberg, 1947). Figure 5 shows the sigmoid CPs for four different sounds with three modifications (and the original). Using these sigmoids and a minimum mean square error (MMSE) calculation, we estimate the overall lateral shift, also described in Appendix B. The resulting MMSE ΔSNRs are provided in Table TABLE I..
Figure 5.
(Color online) Sample comparison of sigmoid fits (see Appendix B) for four different consonants. Scores were measured at −12, −6, 0, 6 and 12 [dB] SNR. Each curve is the sigmoid fit to the measured data points. Curves labeled “○” show the estimated curve fitted for the unmodified sound, the “+” marker is for the feature-amplified sounds, “×” for the feature-attenuated sounds while the dashed curve represents the recognition scores of the feature-removed sounds (which was not curve fitted to the sigmoid). As may be seen from these data, the curves of the feature-amplified and feature-attenuated sounds are shifted versions of the curve of the unmodified sound. When modifying the feature by ±6 [dB] the SNR shifts by about [dB], to achieve the same intelligibility. For example, if the feature has been attenuated by 6 [dB], to restore the score, the SNR must be about 6 [dB] higher. The feature-attenuated sounds are, in general, close to chance performance, but shift to higher scores. The exact shift depends on the effectiveness of the deleted region, as well as conflicting acoustic features (see Sec. 4A). The top right panel (m115ka) indicates the SNR90, and points.
In Figs. 45, the three curves of the feature-amplified, the unmodified and the feature attenuated sounds, demonstrate that modifying a feature changes the entire Pc(SNR) by ≈6 [dB], as would be expected, assuming of course that the critical feature information is actually increased or decreased by the modification. Thus, the obvious interpretation of these results is that the key feature has been modified, as claimed in a statistically significant way [Kruskal-Wallis tests: no significant effect of plosive on either the feature-amplified (p = 0.52) or the feature-attenuated (p = 0.25)]. Furthermore, the shift in the average modified scores is nearly equal to that of the modification. These results also indicate the importance of the modified feature. The given modification alone can change the perceptual score significantly, lending to the possibility that the burst is the primary feature for plosive recognition.
Each of the sounds reached a marked shift, leaving almost no overlap in the distributions of the two types of modifications. Based on the variance for each of the the ±6 [dB] cases, then these had significant changes, with changes in the bursts, easily identified on the AIgram. Once the locations of these bursts was specified via the 3DDS method, modification of that feature changes the score. Our results are also consistent with the natural variations seen in /t/, as reported by Régnier and Allen (2008). Reducing and removing a feature allows us to understand which confusions are important and what causes them (see discussion in Sec. 4A). It is also important to note that the modifications were made on the quiet speech (no noise added), but they resulted in a change in the scores at all SNRs.
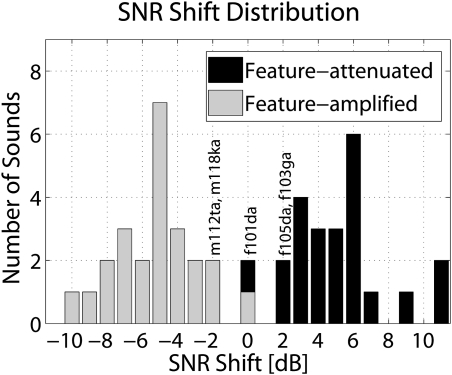
Some examples of sounds that fit this description are m115ta, f119ta, f113ka, m115ka, f101ga, m115ga, and m102da. Of the total 36 /t, k, g/ samples (3 plosives × 2 modification types (amplified and attenuated) × 6 talkers), 31 showed absolute shifts of >3 [dB], while 7 of the 12 /da/sounds (1 plosive × 2 modification types × 6 talkers) achieved >3 [dB] absolute shifts. The CV /da/ was the least shifted (Table TABLE II.), as further discussed in Sec. 4D. The sounds with <3 [dB] shift (approximately one standard deviation away from the mean) are labeled in Fig. 6.
TABLE II.
Average SNR shift in [dB] of individual sounds (note that the value of /ka/ was calculated excluding f108ka, since the shift of its feature-attenuated was −∞ [dB]). Given their smaller means, the /da/ sounds were the most difficult CV to modify (see Secs. 4, 4D).
| /ta/ | /ka/ | /da/ | /ga/ | |
|---|---|---|---|---|
| [dB] | −5.6 | −5.6 | −4.0 | −5.3 |
| Standard Deviation dB | 2.1 | 2.7 | 2.8 | 1.9 |
| [dB] | 6.1 | 4.8 | 3.4 | 6.3 |
| Standard Deviation dB | 2.7 | 1.5 | 2.3 | 3.2 |
Figure 6.
The histogram of shifts ΔSNR+ and ΔSNR_ are shown here, quantized to 1 [dB] bins. The absolute mean shift was about 5.1 [dB] for both feature-amplified sounds and feature-attenuated sounds, while the standard deviation was 2.4 [dB] for the feature-amplified sounds and 2.6 [dB] for the feature-attenuated sounds. For all cases, the feature-amplified sounds have a negative shift (ΔSNR+), while the feature-attenuated sounds have a positive shift (ΔSNR_). Some of the sounds with smaller than 3 [dB] of SNR shift are labeled.
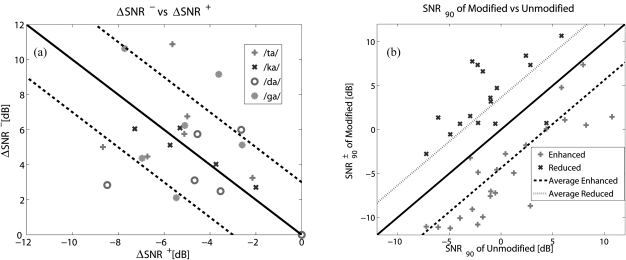
The amplification and attenuation resulted in a correlated change in perception. Theoretically, we expect the perception scores to be shifted equally in opposite directions, that is, the expectation of the shifts of the feature-amplified sounds (E[ΔSNR+]) would be approximately the same as the expectation of the shifts of the feature-attenuated sounds (−E[ΔSNR_]): E[ΔSNR+] + E[ΔSNR_] ≈ 0, where E signifies the expectation. However, six sounds (f101ta, f105ta, m111da, f119da, m118ga and f106ga) have an asymmetry of greater than 3 [dB] (|ΔSNR_ + ΔSNR_| > 3[dB]). Figure 7 (left) is a scatter plot of the data, with the axes ΔSNR+ and ΔSNR_. When ΔSNR+ = −ΔSNR_ the point lies on the −45° line. A paired t-test (not including f108ka, since the shift of its feature-attenuated was −∞ [dB]) on the absolute values of the ΔSNR+ and ΔSNR_ indicates that the MMSE shifts for feature-amplified and feature-attenuated sounds have the same mean with a probability of 0.69, and a confidence interval of 95%.
Figure 7.
(Color online) These figures show the high degree of Ph|s(SNR) shifts associated with the feature modifications, confirming the effectiveness of the modifications. Most samples were feature-amplified and feature-attenuated equally. (a) SNR shift of curve of feature-attenuated sounds vs SNR shift of curve of feature-amplified sounds (excluding f108ka). For example, the shifts of the feature-amplified and feature-attenuated versions of f119da are represented by the point at (–8.5, 2.8). The dashed lines are 3 [dB] off from the 45 degree line, meaning that most of the sounds had a range of 3 [dB]. (Right) of the modified sounds vs the SNR90 of the unmodified sounds. SNR90 is that SNR at which the recognition score of the sound is 90%.
Although, amplification and attenuation have the same distribution, the skewness (third moment of in their distribution (as visible in Fig. 6) for the feature-amplified sounds is found to be 0.05, and that for the feature-attenuated sounds (excluding the feature-attenuated of f108ka) is 0.58. This tells us that the distribution around the mean of shifts for the feature-amplified sounds is almost symmetric, while the scores of the feature-attenuated sounds are skewed towards 0 [dB]. This happens because of imperfect modifications. It may be that a small portion of the burst is left unattenuated, and then plays the primary role in perception, given its relatively high energy, and the scores would remain almost unchanged. But, if a small portion of the feature is left unamplified while the rest of the feature is amplified, then this small portion would not be used for perception since the amplified feature region would define the scores.
There is also the possibility that some of the results are skewed somewhat because of ceiling/floor effects leaking into the sigmoid fitting. This would cause the feature-amplified version and the feature-attenuated version to have a slightly different absolute values.
CV’s such as f103ga and m102da (Table TABLE I.) showed such asymmetry. We expect that there were some imperfections in manual selection of the modification region and that there exist secondary cues (Cole and Scott, 1974a; Li et al., 2010). Thus, it is important to consider each consonant separately, and not as one group, contrary to the analysis method of Hazan and Simpson (1998).
We also considered the SNR90 points, defined as the SNR at which the recognition score (Pc) of the consonant is 90% (Régnier and Allen, 2008). This is done, because at and below SNR90 the noise level is high enough to mask the relevant features. As an example, the SNR90 points are marked in Fig. 5 (top right). From Fig. 7 (right), we see a linear relationship between (SNR90 for feature-amplified or feature-attenuated version) and SNR90. The mean difference between of the feature-attenuated sounds and the SNR90 of the unmodified sounds is 7.33 [dB] (not including f108ka). The mean difference between of the feature-amplified sounds and the SNR90 of the unmodified sounds is −5.5 [dB]. Both values are close to the expected values of ±6 [dB]. Paired t-tests comparing the with SNR90 (p < 0.0001, 95% confidence interval) and with SNR90 (p < 0.0001, 95% confidence interval) show that their distributions are statistically different.
Our results indicate the presence of important features for the plosives with the vowel /a/. It is clear that the burst (along with its timing relative to the onset of sonnerance, which we did not manipulate) is the primary feature for these consonants, and that the increase or decrease in the relative energy of the burst systematically modulates the scores.
Since a modification to the burst level resulted in (on average) a proportional ΔSNR shift, it directly follows that the burst-to-vowel level is critical when discriminating a confusion group (Li and Allen, 2011). It would be difficult (i.e., impossible) to verify this hypothesis using synthetic speech, since controlling unknown features is impossible. Synthetic speech can only contain those cues that are synthesized (Stevens and Blumstein, 1978): You cannot control what you do not know.
DISCUSSION
In the following subsections we discuss specific trends for each of the consonant cases, and focus on those utterances that exhibit shifts in perception outside of the anticipated shifts.
Effects of feature removal and conflicting features
The increase in the number of confusions heard following the dramatic drop in recognition score, following feature-removal (e.g., Fig. 8, lower left), leads us to conclude that each sound contains certain other acoustic cues which do not contribute to the intelligibility of the utterance. In fact, there is one burst-release, which is then filtered by the vocal tract to produce these several bursts of sound, identified as different consonants. It is these additional acoustic cues that cause confusions. We refer to these as conflicting cues, defined as those acoustic features that are not useful for the recognition of the target consonant, but rather are features for a confusable consonant (Li and Allen, 2011). For example, along with the high frequency /ta/ burst, there frequently coexists a mid frequency /ka/ burst, which may cause confusions, once the /t/ burst becomes masked. Conflicting features separate real and synthetic speech. This filtered burst is decoded by the auditory system as several independent cues (Li and Allen, 2011).
Figure 8.
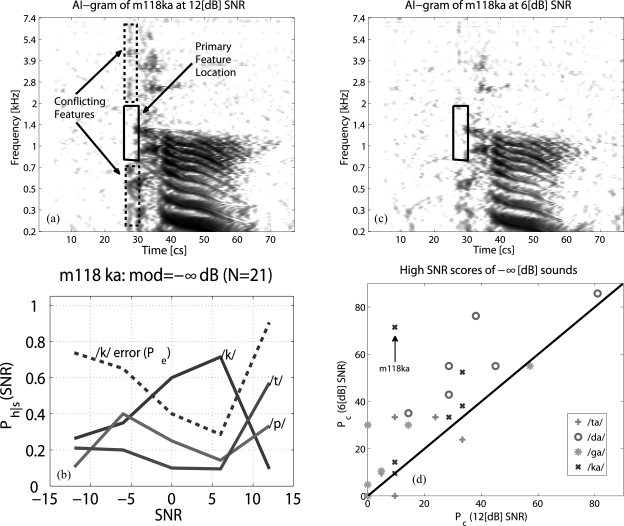
(Color online) AIgrams at (a) 12 [dB] and (c) 6 [dB] SNR and (b) CPs for the feature-removed (–∞ [dB]) version of m118ka. As the SNR is decreased from 12 [dB], the recognition scores of the feature-removed sound unexpectedly increase. As an example, the scores of the feature-removed version of m118ka (d) at 6 [dB] SNR are greater than at 12 [dB] SNR. With only a few exceptions, the consonant score increases as the noise is increased from 12 to 6 [dB] SNR. Each of the four consonants is coded with a different symbol.
The conflicting features of m118ka are shown in Fig. 8 (top left). The primary /ka/ feature region (after the feature has been removed) is shown in the solid box, while the conflicting /p/ (low frequency) and /t/ (high frequency) features are shown in the dashed boxes, at 12 [dB] SNR. Figure 8 (top right) shows that the conflicting features are masked completely at 6 [dB] SNR. Figure 8 (bottom left) shows the confusion pattern for f118ka.
It should be noted that for CV f118ka, after feature removal, the recognition score is 9.5% at 12 [dB] SNR and is 71.4% at 6 [dB] SNR, that is, the feature-removed utterance has a higher accuracy at 6 [dB] than at 12 [dB] SNR. From Fig. 8 (bottom right), it can be seen that, with the exception of m104ta, f119ta and f101ga, the scores of all utterances at 6 [dB] SNR are greater than or equal to the scores at the high SNR of 12 [dB]. While this phenomenon is contrary to the expectation that the recognition score would remain almost unchanged for feature-removed sounds, it can be explained by the existence of conflicting features or remnant features. When the primary feature is removed completely, the listener uses conflicting cues, forcing the score of the feature-removed curve to be low at 12 [dB] SNR. As the noise increases (SNR decreases), the conflicting features are masked, and the listener must use an alternative strategy, based on any remnant cues.
When a sound is ambiguous, it is recognized as one of a subset of consonants (typically 2 to 4), each with similar probabilities. We call such a sound primable, and this effect, consonant-priming. In our example of f108ka [Fig. 8 (bottom left)], at 9 [dB] SNR, the speech sample can be primed as /k/, /t/ or /p/. Thus, when hearing the sound without context, the listener would perceive any one of these consonants. We view this as equivalent to rolling a three-sided die with an equal probability of landing on one of the sides.
Priming is an effect of conflicting features. When the primary cue is attenuated, or removed, the primary cue is not clearly audible, and conflicting features play greater roles in perception. As mentioned, conflicting features cause the sound to be misheard as different consonant.
The following sections provide a detailed discussion of some of the more interesting consonant samples. In each case there are exceptions to the average results, that the modifications resulted in the predicted shifts in the scores. These exceptions are discussed, as a great deal can be learned from them. The majority can be explained, but not all.
/ta/
The average shift for the feature-amplified /ta/ was −5.6 [dB], and 6.1 [dB] for the feature-attenuated case with a standard deviation of 2.1 and 2.7 [dB], respectively (Table TABLE II.). Thus, while the modifications worked on average, there were some outliers.
Much may be learned from the failed exceptions. For /ta/these are:
-
(1)
From Table TABLE I., CV f101ta shows large deviations from the expected scores, with a ΔSNR_ value of 10.9 [dB]. Removing the /ta/ feature results in recognition as a /pa/, due to the strong energy of a conflicting feature below 1 [kHz]. On the other hand, this low frequency burst does not greatly conflict with the feature-amplified and unmodified versions.
-
(2)
The feature-amplified version of the CV m112ta achieved only a minor −2.2 [dB] shift. The CV m112ta has high recognition even at low SNRs after amplification. This results in only one data point below 100% recognition. Due to this lack of data points in the transition region (from low error to high error) of the feature-amplified version, the sigmoid fitting does not do a good job representing the curve. Thus, this sound appears to have an ineffective modification. With more data between −6 and −12 [dB] SNR, the sigmoid would have a lower slope (similar to the slope of the sigmoid of the unmodified version), resulting in a more reasonable MMSE SNR shift. The slope of m112ta is similar to the slope of the f105ta feature-amplified version (Fig. 5 (top left)).
/ka/
The average shift for the feature-amplified /ka/ was −5.6 [dB], and 4.8 [dB] for the feature-attenuated case with a standard deviation of 2.7 and 1.5 [dB], respectively (Table TABLE II.).
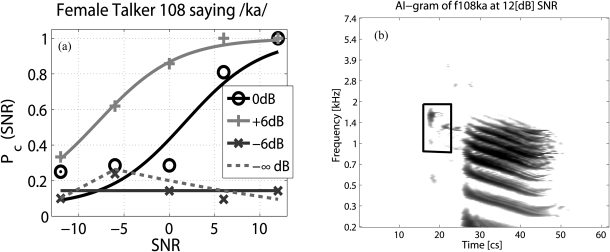
The one exception for /ka/ (f108ka) is that the feature-removed curve and the feature-attenuated curve are nearly identical (Fig. 9). The burst in this sound is weak, as indicated by the lower scores of its unmodified version at 12 [dB] SNR. Thus, after feature-attenuation, the relative energy of the burst is below the noise floor, causing it to be masked, giving results similar to those of the feature-removed version. Furthermore, the feature-amplified version shows a −9.6 [dB] shift. There is a lack of significant relative energy in the burst region before the modification is made, thus amplification results in the extra high performance.
Figure 9.
(Color online) Scores for CV f108ka. (a) The feature-attenuated curve and –∞ [dB] have very similar scores due to the weakness of the burst. (b) AIgram of f108ka after feature attenuation, showing that the burst is totally masked once it is attenuated by 6 [dB].
The low ΔSNR+ (−2.0 [dB]) and ΔSNR_ (2.7 [dB]) for m118ka is due to the peak of the burst being near the vowel onset and outside the modified region, as discussed in Sec. 4A and in Fig. 8.
/da/
The average shift for the feature-amplified /da/ was −4.0 [dB], and 3.4 [dB] for the feature-attenuated case with a standard deviation of 2.8 and 2.3 [dB], respectively (Table TABLE II.).
Based on the results of the /da/ sounds and informal tests, we see that without any significant burst energy above 1.7 [kHz], but with a significant formant onset, the sound is always recognized as /d/. With most /da/ sounds, there is an F2 formant onset, followed by its transition. Contrary to the conclusions of Cooper et al. (1952); Cole and Scott (1974a); Dorman et al. (1977) and Blumstein et al. (1977), this F2 onset can cause a forward masking effect on the formant transition, and thus, in that case, the F2 would play no role in perception. If a burst of energy is present immediately before the formant onset (around 2 [kHz], before vowel onset), the entire formant transition may be forward masked, and the onset plays no role in perception. This masking burst could then be perceived as /g/. Clearly, more research will be needed to establish this observation as fact. Some of the /da/ sounds, such as f101da, f105da, m117da and f119da, are examples of this phenomenon.
There are four notable exceptions for /da/:
-
(1)
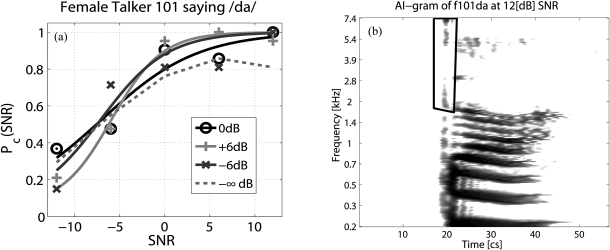
CV f101da shows no SNR shift after modification. From the AIgram of this speech sound (Fig. 10), it can be seen that the F2 onset was not part of the modified region. But, since all burst energy (including /d/ and /g/) is weak, only the onset of the F2 is used for perception and the listeners hear /da/ causing no changes in the scores. This is the only example of /da/ used in the experiment wherein the burst (due to its weakness) is less important than the onset of the F2.
-
(2)
CV f119da is similar to f101da. In this case, the high frequency /da/ burst (the primary feature) is not weak, and attenuating it causes a change in perception (ΔSNR_ = 2.8 [dB]). However, since the conflicting /ga/feature is weak, the sound does not morph to /ga/. The F2 onset is also not masked, and the sound is recognized as /da/, with a minor change in scores from the unmodified. Amplifying the primary feature caused an MMSE shift (ΔSNR+) of −8.5 [dB].
-
(3)
The modification region of f105da extended below 2 [kHz], and after attenuation, the forward masking effect of any burst energy at that frequency is reduced. Thus, the onset of the F2 was verifiably audible (data not shown), and due to the onset the sound was still perceived as a /da/, with ΔSNR_ = 2.5 [dB]. CV m117da has the same situation (ΔSNR_≈3 [dB]).
-
(4)
In the case of m111da, the curve shift of the feature-amplified sound is −2.6 [dB]. The high frequency burst is weak and thus amplification does not cause a large change in perceptual scores.
Figure 10.
(Color online) (a) Comparison of scores of the CV f101 after modification. (b) AIgram displaying the modification region of f101da. The entire burst was not covered by this region. The F2 onset is not part of the modification region, and in the absence of the burst, this causes the perception scores of the sound to be altered minimalty.
/ga/
The average shift for the feature-amplified /ga/ was −5.3 [dB], and 6.3 [dB] for the feature-attenuated case with a standard deviation of 1.9 and 3.2 [dB], respectively (Table TABLE II.). Thus on average, the modifications are quite successful.
Four exceptions for /ga/ are as follows:
-
(1)
The scores of the feature-attenuated version of f103ga are close to the scores of the unmodified sound, with a shift of 2.8 [dB]. This /ga/ burst has a relatively higher SNR than the rest of the consonant. The region of modification extended from 0.5 to 2.4 [kHz], into the region of the conflicting features. Thus, after attenuation, the conflicting features have lowered SNRs, and do not mask the primary feature. This results in only a small change in perceptual scores.
-
(2)
The unmodified version of m115ga has lower performance (81% at 12 [dB] SNR) in comparison to the other /ga/ samples. The burst of this CV is unlike the other voiced sounds in that it occurs approximately 33 [ms] before the start of the vowel, while the average /ga/ burst has a VOT of 20 [ms]. This results in confusions with /ka/. The modification region included the burst and vowel onset. The feature-amplified sound achieved recognition of 95% (at 12 [dB] SNR). The feature-attenuated version shows a maximum recognition score of 48% and a ΔSNR_ of 10.6 [dB]. This large shift is because of a strong onset of the F2 region, which is no longer effected by forward masking, after attenuation. The onset causes the sound to be recognized as a /da/.
-
(3)
CV f106ga achieved a 9.2 [dB] shift after attenuation. This case is similar to that of m115ga. The burst in this case is weak. A small reduction in the relative energy of the burst causes the conflicting features to play larger roles. The conflicting features cause the sound to be heard as /ð, d, θ/.
-
(4)
We have not yet been able to explain the relatively small shift in SNR (−2.6 [dB]) for the feature-amplified version of m118ga.
Confusion groups
To quantify how the confusions changed for each modification type (unmodified, feature-amplified, feature-attenuated) for a target plosive, we found the total number of occurrences of a confusion across all talkers at each SNR. Then, the top three confusions at each SNR were compared. The largest confusions are listed in Table TABLE III.. Note that the confusions for the feature-removed versions (−∞ [dB]) are entirely different, and are not shown here. Also, the error is least for the feature-amplified version, and most for the feature-attenuated version.
TABLE III.
Confusion count for the target consonant in column one at any SNR. The top three confusions are listed for the three modifications, along with the maximum number of times the consonant was perceived by listeners at a particular SNR (different for each of the different confusions) for all talkers. The percentage contribution to the total error at that SNR is given in parentheses. The total number of presentations at each SNR was 6 plosives × 21 Listeners = 126. The contribution to the total error for a particular consonant for each case of the modified stimuli are in parentheses. Note that the feature-removed sounds resulted in high entropy errors (the confusions became highly random once the main feature was removed), and are not displayed here.
| Feature- | Feature- | ||
|---|---|---|---|
| Consonant | Unmodified | amplified | attenuated |
| /t/ | /p/: 18 (22%) | /p/: 16 (24%) | /p/: 31 (36%) |
| /k/: 28 (42%) | /k/: 11 (17%) | /k/: 25 (29%) | |
| /h/: 13 (20%) | /h/: 5 (8%) | /h/: 11 (13%) | |
| /k/ | /t/: 23 (26%) | /t/: 8 (13%) | /t/: 23 (27%) |
| /p/: 27 (48%) | /p/: 20 (32%) | /p/: 34 (40%) | |
| /h/: 18 (21%) | /h/: 9 (15%) | /h/: 21 (25%) | |
| /d/ | /g/: 13 (16%) | /g/: 14 (22%) | /g/: 19 (25%) |
| /z/: 17 (21%) | /z/: 16 (25%) | /z/: 17 (22%) | |
| /v/: 11 (13%) | /t/: 8 (13%) | /v/: 19 (26%) | |
| /d/: 19 (26%) | /d/: 9 (27%) | /d/: 30 (53%) | |
| /z/: 13 (12%) | /z/: 13 (15%) | /z/: 22 (22%) | |
| /v/: 19 (19%) | /v/: 10 (13%) | /v/: 17 (17%) |
By comparing the most common confusions, we see that across all modification types, the /ta/ sounds were most confused with /p, k/. This is consistent with our discussion on conflicting features for these sounds (Sec. 4A). There are also a few confusions with /h/, which could be due to noise. In the case of /ka/, the major confusions are /t, p/. But, just as in the case of /ta/, there are many confusions with /h/ as well.
The CV /da/ is confused with /g/. The standard confusion group for /da/ has always been /b,d,g/ (Miller and Nicely, 1955), but we see confusions mainly with /ga/. Some confusions exists with /t/ for the feature-amplified version. This is because /ta/ is a high frequency plosive, similar to /da/, as well. There is also some confusion with /z/ and /v/. These new confusions are not presently understood.
The average unmodified /ga/ has confusions with /d/, but not with /b/. There are also confusions with /k, z, v/. /k/ is an expected response since it has a mid frequency burst as well. Again, confusions with /z/ and /v/ are not presently understood.
CONCLUSIONS
From this study, based on the very high correlation between the burst level relative to the vowel, which we directly manipulated, and the scores, which we measured, we conclude that the burst feature is the primary acoustic feature for plosive consonant identification. The results show the same burst (located in a specific range of frequencies and a specific amount of time before the onset of the vowel) produces, on average, a significant change in perception, for a number of CV’s (/t, k, d, g/, with the vowel /a/) across different talkers. The modifications were made to the clean speech. The change in recognition scores at all SNRs, after modification of the bursts of energy, proves that normal hearing listeners use these bursts for accurate perception, over a wide range of SNRs.
Identifying the precise locations of acoustic features is not always easy, but a number of techniques developed by our previous research (along with our own) have been developed to locate these cues. The main tool is the integration of three very different measures (3DDS), as described in the references (Li and Allen, 2011; Li et al., 2010; Régnier and Allen, 2008). In this research we extend the findings of this research by increasing and decreasing, and then completely removing, the energy in the identified critical-feature regions (Table TABLE I.). Our method uses the time-frequency space using the AIgram (Li and Allen, 2011; Li et al., 2010; Régnier and Allen, 2008) and the short-time Fourier transform with modifications (Allen and Rabiner, 1977).
Our main result is that intelligibility, as measured by the shift in the score as a function of SNR [i.e., Pc(SNR)], was increased or decreased approximately proportional to the magnitude of the burst amplitude modification.
In the case of the feature-removed CVs, the sound was nearly unrecognizable, even at the highest SNR. In the absence of the primary feature, conflicting features play an important role in perception. But, unexpectedly, as the SNR is decreased, the recognition scores increase. This is because the conflicting features are masked by noise, thus raising chance performance. For instance, some of the /da/ samples used in the experiment had well defined F2 onsets. In the absence of burst energy at 2 [kHz], the onset of the transitions were no longer masked, and affected perception. From this, we conclude that conflicting cues are a major part of real speech but not necessarily part of synthetic speech.
There is also no systematic change in the confusion groups following feature amplification or attenuation. It seems significant that we have modified the speech sounds without creating significant new confusions.
In the future, we would like to perform a similar test on hearing impaired listeners, in an effort to improve hearing aid technology.
ACKNOWLEDGMENTS
The authors would like to acknowledge the help provided by Feipeng Li, Bryce Lobdell, Anjali Menon, Len Pan and other members of the Human Speech Research group at the University of Illinois. We also would like to thank Phonak and the ECE department at the University of Illinois for financial support.
APPENDIX A
This RMS was set so as to get the desired SNR in [dB] according to
| (A1) |
where σs is the standard deviation of the speech without noise, and σn is the standard deviation of the noise alone. The SNR was based on the RMS of section of speech from first sample which is greater than 1% of the peak to the last sample which is greater than 1% of the peak of the unmodified signal without noise. The signal played to the subject was s(t) + n(t), where s(t) is the modified or unmodified speech signal and n(t) is the noise waveform with a standard deviation of σn, calculated using Eq. A1, using the standard deviation (σs) of the corresponding unmodified speech sound.
The noise signal was created using MATLAB. First a vector is generated using the function randn(), with a random standard deviation σ. Then, this vector is normalized by σ, and multiplied by σn, to get the noise signal, n(t).
APPENDIX B
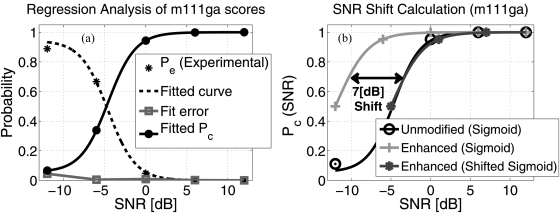
To estimate the curve shift in terms of SNR, we use a minimum mean square error (MMSE) calculation (as shown in Fig. 11). Each CP curve consists of a score, Pc(SNRk) at each of the 5 test SNRs, SNRk. The probability of error, Pe = 1 − Pc is found at each point, for the feature-amplified, feature-attenuated and unmodified sounds (but not for the feature-removed sound). Then, the MATLAB procedure lsqcurvefit () was used to do a nonlinear regression on Pe(SNRk), to fit the sigmoid function [Eq. B1], where is probability of error at chance (i.e., the listener picks a consonant randomly from the set of 18 options). The nonlinear regression determines the parameters λ (scaling) and SNR0 (the Speech Recognition Threshold, defined as the SNR at which the speech sound has 50% recognition score). Parameter λ was constrained to a value between 0 and 1.
| (B1) |
Figure 11 (left) shows the curve estimated from the experimental data.
Figure 11.
(Color online) The gathered data is fit to sigmoids (Eq. B1) for estimating the lateral shift in SNR of the curves after modification. (a) To do this, the Pe = 1 − Pc values at the 5 SNRs is fit to a sigmoid. (b) Each sigmoid of the modified sounds is shifted along the x-axis until the mean squared difference between ordinates of the curves of the unmodified and modified sound is minimized. This resulting shift is taken to be the SNR shift after modification. In the given example, the minimum error occurs for a 7.0 [dB] shift.
With the sigmoids fitted to the raw data, it is now possible to find the shift in the curves of the modified sounds, with respect to the curves of the unmodified sounds, as an SNR. This was done by changing the SNR of the modified sounds by −ΔSNR, causing the curve to shift along the SNR axis (x-axis). Then, the difference in Pc (ordinate) of the modified sound (shifted sigmoid) and the unmodified sound (unshifted sigmoid) was found at SNRs in the range −12+ΔSNR to 12 [dB], for the feature-amplified sounds and −12 to 12-ΔSNR for the feature-attenuated sounds. This range is chosen to stay within the SNR range of the experiment. These differences were squared and summed, giving the total squared error.
Finally, the average squared error was calculated by dividing the total squared error by the number of points at which the difference is found. The number of points in the calculation is (24-ΔSNR)/0.01. This average squared error is known as the mean squared error or MSE. By varying the ΔSNR parameter, we can find that ΔSNR at which the MSE is minimized. We varied the ΔSNR in steps of 0.01 [dB], ranging from −15 to 0 for the feature-amplified sounds, and 0 to 15 for the feature-attenuated sounds, to find the minimum mean squared error (MMSE).
References
- Allen, J. B. (1994) “How do humans process and recognize speech?” IEEE Trans. Speech Audio Process. 2, 567–577. 10.1109/89.326615 [DOI] [Google Scholar]
- Allen, J. B. (2005a) “Consonant recognition and the articulation index,” J. Acoust. Soc. Am. 117, 2212–2223. 10.1121/1.1856231 [DOI] [PubMed] [Google Scholar]
- Allen, J. B., and Li, F. (2009). “Speech perception and cochlear signal processing,” IEEE Signal Process. Mag. 26, 73–77. 10.1109/MSP.2009.932564 [DOI] [Google Scholar]
- Allen, J. B. (2005b). Articulation and Intelligibility (Morgan and Claypool, Colorado: ), p. 124. [Google Scholar]
- Allen, J. B., and Rabiner, L. R. (1977). “A unified approach to short-time Fourier analysis and synthesis,” Proc. IEEE 65, 1558–1564. 10.1109/PROC.1977.10770 [DOI] [Google Scholar]
- Blumstein, S. E., and Stevens, K. N. (1979). “Acoustic invariance in speech production: evidence from measurements of the spectral characteristics of stop consonants,” J. Acoust. Soc. Am. 66, 1001–1017. 10.1121/1.383319 [DOI] [PubMed] [Google Scholar]
- Blumstein, S. E., and Stevens, K. N. (1980). “Perceptual invariance and onset spectra for stop consonants in different vowel environments,” J. Acoust. Soc. Am. 67, 648–662. 10.1121/1.383890 [DOI] [PubMed] [Google Scholar]
- Blumstein, S. E., Stevens, K. N., and Nigro, G. N. (1977). “Property detectors for bursts and transitions in speech perceptions,” J. Acoust. Soc. Am. 61, 1301–1313. 10.1121/1.381433 [DOI] [PubMed] [Google Scholar]
- Cole, R. A., and Scott, B. (1974a). “The phantom in the phoneme: Invariant cues for stop consonants,” Percept. Psychophys. 15, 101–107. 10.3758/BF03205836 [DOI] [Google Scholar]
- Cole, R. A., and Scott, B. (1974b). “Towards a theory of speech perception,” Psychol. Rev. 81, 348–374. 10.1037/h0036656 [DOI] [PubMed] [Google Scholar]
- Cooper, F., Delattre, P., Liberman, A., Borst, J., and Gerstman, L. (1952). “Some experiments on the perception of synthetic speech sounds,” J. Acoust. Soc. Am. 24, 579–606. 10.1121/1.1906940 [DOI] [Google Scholar]
- Dorman, M. F., Studdert-Kennedy, M., and Raphael, L. J. (1977). “Stop consonant recognition: Release bursts and formant transitions as functionally equivalent, context dependent cues,” Percept. Psychophys. 22, 109–122. 10.3758/BF03198744 [DOI] [Google Scholar]
- Fletcher, H. (1921). “An empirical theory of telephone quality,” AT&T Internal Memorandum Case 211031, Report 21839.
- Fousek, P.Svojanovsky, P., Grezl, F., and Hermansky, H. (2004). “New nonsense syllables database—analyses and preliminary ASR experiments,” Proceedings of International Conference on Spoken Language Processing pp. 2749–2752.
- French, N. R., and Steinberg, J. C. (1947). “Factors governing the intelligibility of speech sounds,” J. Acoust. Soc. Am. 19, 90–119. 10.1121/1.1916407 [DOI] [Google Scholar]
- Gordon-Salant, S. (1986) “Recognition of natural and time/intensity altered cvs by young and elderly subjects with normal hearing,” J. Acoust. Soc. Am. 80, 1599–1607. 10.1121/1.394324 [DOI] [PubMed] [Google Scholar]
- Hazan, V., and Simpson, A. (1998). “The effect of cue-enhancement on the intelligibility of nonsense word and sentence materials presented in noise,” Speech Commun. 24, 211–226. 10.1016/S0167-6393(98)00011-9 [DOI] [Google Scholar]
- Kadambe, S., and Burns. R. (2000). “Encoded speech recognition accuracy improvement in adverse environments by enhancing formant spectral bands,” Proceedings of International Conference on Spoken Language Processing, pp. 365–368.
- Kewley-Port, D., Pisoni, D., and Studdert-Kennedy, M. (1983). “Perception of static and dynamic acoustic cues to place of articulation in initial stop consonants,” J. Acoust. Soc. Am. 73, 1778–1793. [DOI] [PMC free article] [PubMed] [Google Scholar]
- Klatt, D. (1972). “Acoustic theory of terminal analog speech synthesis,” Proceedings of the 1972 International Conference on Speech Communication and Processing, pp. 131–135.
- Li, F., and Allen, J. B. (2011). “Manipulation of consonants in natural speech,” IEEE Trans. Audio, Speech, Lang. Process. 19, 496–504. 10.1109/TASL.2010.2050731 [DOI] [Google Scholar]
- Li, F., Menon, A., and Allen, J. B. (2010). “A psychoacoustic method to find the perceptual cues of stop consonants in natural speech,” J. Acoust. Soc. Am. 127, 2599–2610. 10.1121/1.3295689 [DOI] [PMC free article] [PubMed] [Google Scholar]
- Miller, G. A., and Nicely, P. E. (1955). “An analysis of perceptual confusions among some english consonants,” J. Acoust. Soc. Am. 27, 338–352. 10.1121/1.1907526 [DOI] [Google Scholar]
- Ohde, R. N., Haley, K. L., Vorperian, H. K., and McMahon, C. W. (1995). “A developmental study of the perception of onset spectra for stop consonants in different vowel environments,” J. Acoust. Soc. Am. 97, 3800–3812. 10.1121/1.412395 [DOI] [PubMed] [Google Scholar]
- Ohde, R. N., and Stevens, K. N. (1983). “Effect of burst amplitude on the perception of stop consonant place of articulation,” J. Acoust. Soc. Am. 74. 706–714. 10.1121/1.389856 [DOI] [PubMed] [Google Scholar]
- Phatak, S., and Allen, J. B. (2007). “Consonant and vowel confusions in speech-weighted noise,” J. Acoust. Soc. Am. 121, 1212–1226. 10.1121/1.2642397 [DOI] [PubMed] [Google Scholar]
- Phatak, S., Lovitt, A., and Allen, J. B. (2008). “Consonant confusions in white noise,” J. Acoust. Soc. Am. 124, 1220–33. 10.1121/1.2913251 [DOI] [PubMed] [Google Scholar]
- Potter, R. K., Kopp, G. A., and Kopp, H. G. (1966). Visible Speech (Dover, New York: ), pp. 22–27. [Google Scholar]
- Régnier. M., and Allen, J. B. (2008) “A method to identify noise-robust perceptual features: application for consonant /t/,” J. Acoust. Soc. Am. 123, 2801–2814. 10.1121/1.2897915 [DOI] [PubMed] [Google Scholar]
- Sendlmeier, W. F. (1989) “Speech cue enhancement in introvocalic stops,” Clin. Linguist. Phonetics 3, 151–161. 10.3109/02699208908985278 [DOI] [PubMed] [Google Scholar]
- Shannon, C. E. (1948) “A mathematical theory of communication,” Bell Syst. Tech. J. 38, 611–656. [Google Scholar]
- Stevens, K. N., and Blumstein, S. E. (1978). “Invariant cues for place of articulation in stop consonants,” J. Acoust. Soc. Am. 64, 1358–1368. 10.1121/1.382102 [DOI] [PubMed] [Google Scholar]
- Tallal, P., Miller, S. L., Bedi, G., Byma, G., Wang, X., Nagarajan, S., Schreiner, C., Jenkins, W., and Merzenich, M. (1996). “Language comprehension in language learning impaired children improved with acoustically modified speech,” Science 271, 81–84. 10.1126/science.271.5245.81 [DOI] [PubMed] [Google Scholar]
- Wang, M., and Bilger, R. C. (1973). “Consonant confusion in noise: A study of perceptual features,” J. Acoust. Soc. Am. 54, 1148–1166. [DOI] [PubMed] [Google Scholar]


