Abstract
Antivascular ultrasound consisting of low-intensity sonication in the presence of circulating microbubbles of an ultrasound contrast agent has been demonstrated to disrupt blood flow in solid cancers. In this study a mathematical framework is described for the microbubble-induced heating that occurs during antivascular ultrasound. Biological tissues are modeled as a continuum of microbubble-filled vasculature, cells, and interstitial fluids with compressibility equal to the sum of the compressibility of each component. The mathematical simulations show that the absorption of ultrasound waves by viscous damping of the microbubble oscillations induced significant local heating of the tissue vasculature. The extent and the rate of temperature increase not only depends on the properties of the microbubbles and the sonication parameters but is also influenced markedly by the blood flow. Slow flow conditions lead to higher tissue temperatures due to a stronger interaction between microbubbles and ultrasound and reduced heat dissipation. Because tumors have slower blood flow than healthy tissue, the microbubble-induced ultrasound antivascular therapy is likely to affect cancerous tissue more extensively than healthy tissue, providing a way to selectively target the vasculature of cancers.
INTRODUCTION
Since the survival and growth of solid tumors critically depend on the development of new blood vessels (a process known as angiogenesis), in cancer therapies there is great interest in developing techniques that target this network of blood vessels (the tumor neovasculature). There are three broad therapeutic strategies for targeting the tumor neovasculature. The first strategy involves the use of various agents to prevent the process of angiogenesis; the second, often referred to as antivascular therapy, targets the tumor neovasculature; and the third uses the cytotoxicity of conventional therapeutics to inhibit the activity of the endothelial cells lining the walls of the tumor neovasculature.
We have reported a new antivascular approach that uses low-intensity ultrasound and circulating microbubbles to disrupt tumor vasculature (Wood et al., 2005et al.,; Bunte et al., 2006et al.,; Wood et al., 2007et al.,; Wood et al., 2008; Wood et al., 2009; Wood et al., 2010). Tumor blood vessels are known to be structurally weaker and functionally less competent than those in the normal tissues. While the use of high-intensity ultrasound to ablate biological tissues has been known since the 1960 s, and is used currently for treating benign and neoplastic diseases, including uterine fibroids and prostatic carcinomas, the use of low-level ultrasound for specifically disrupting the tumor vascular network is new and relatively unexplored. The ability to target vessels using low-level ultrasound raises new possibilities for treating both superficial and deep-seated cancers.
The antivascular effect is potent and reproducible (Wood et al., 2005et al.,; Goertz et al., 2008et al.,; Chin et al., 2009et al.,). However, the underlying acoustic and biological mechanisms are not fully understood. It has been demonstrated that inertial cavitation (Goertz et al., 2009et al.,) and microbubble-enhanced tissue heating (Fujishiro et al., 1998et al.,; Holt and Roy, 2001; Umemura et al., 2005et al.,; Razansky et al., 2006et al.,) occur under the sonication conditions used for the antivascular ultrasound therapy. Inertial cavitation is also accompanied by sonochemical effects (Sehgal et al., 1977et al.,, Leighton, 1994). Therefore, all mechanisms including thermal, mechanical (cavitation, shear forces, and other nonlinear mechanisms), and sonochemical effects are likely to contribute to antivascular activity. These acoustic mechanisms could act either directly on vascular endothelium or indirectly by triggering tissue response to the thermal, mechanical, or sonochemical challenges.
This study focuses on the role of the intravascular microbubble-induced heating that occurs during the in vivo low-intensity sonication of tissues. Several previous studies have demonstrated that microbubbles enhance ultrasound heating (Leighton, 1994; Fujishiro et al., 1998et al.,; Holt and Roy, 2001; Umemura et al., 2005et al.,; Razansky et al., 2006et al.,). The studies by Razansky et al. (2006) investigated heating in microbubble solutions under static in vitro conditions and did not take into consideration the active role of tissue vasculature and blood flow. Mast et al. (2005) have considered perfusion related heat dissipation during direct heating by ultrasound. In this study we combine these two previous approaches to study heating induced by intravascular microbubbles under conditions of flow; the goal is to obtain a better understanding of the role of microbubble heating during antivascular ultrasound therapy.
MODEL AND METHODS
Absorption of ultrasound by an ensemble of microbubbles in tissue vasculature
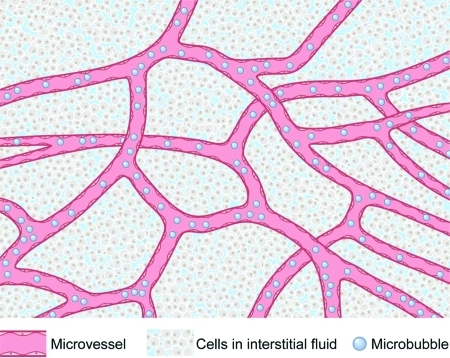
Solid soft tissues are modeled as a compressible nonhomogeneous continuum consisting of a network of microvessels containing microbubbles and blood, embedded in a microenvironment of cells and interstitial fluids [Fig. 1]. The compressibility, βT, of such a medium is given by
| (1) |
In Eq. 1, P is the applied pressure on volume V of the tissue. In the presence of an equilibrium concentration of microbubbles in the microvasculature (achieved by a continuous infusion of microbubbles) the tissue compressibility increases due to the presence of microbubbles. The compressibility of tissue with vasculature containing microbubbles, βTB, can be expressed as a sum of the compressibility of the tissue without bubbles, βT, and the compressibility of the population of microbubbles, βBub, in the vasculature (Leighton, 1994),
| (2) |
The magnitude of βBub, determined by the nature and the size distribution of the bubbles, is considered in Secs. 2, 2.
Figure 1.
Conceptual diagram of biological tissues with microbubbles in the microvasculature.
Ensemble of identical microbubbles
If there are n microbubbles of the same size in a tissue volume V, and v is the volume of a microbubble then the change in volume of all the microbubbles, in the volume V of the tissue in response to the change in pressure, ΔP, is nΔv and the compressibility, βBub, is defined as
| (3) |
where is the microbubble density per unit volume of tissue. When exposed to ultrasound, the microbubbles undergo radial oscillations. At low ultrasound intensities the change in the microbubble radius, ΔR(t), is small compared to the initial microbubble radius, R0, and Eq. 3 yields
| (4) |
where v0 is the volume of a microbubble at equilibirium. When driven by the ultrasound waveform ΔP = −PAeiωt, microbubbles behave as damped oscillators, and ΔR(t) is described by the equation of motion (Leighton, 1994),
| (5) |
where γTot is the dissipative constant that incorporates all processes that dampen bubble wall motion, ω is angular frequency of ultrasound, ω0 is the angular frequency of resonance, and ρB is the density of blood surrounding the microbubbles. According to the Rayleigh–Plesset equation, the resonance frequency of small free bubbles (bubbles without encapsulating shell) is dominated by surface tension and viscosity terms. The resonance frequency of the shelled bubbles, on the other hand, is related to shear modulus, Gsh, and thickness dsh of the shell and is described by (Church, 1995; Hoff et al., 2000et al.,; Hoff, 2001; Razansky et al., 2006et al.,),
| (6) |
where κ is the polytropic constant, and p0 is the atmospheric pressure. Theoretical studies have shown that microbubble oscillations are affected by the vessel wall and the position of the bubbles in the vessel (Sassaroli and Hynynen, 2004). These affects are not considered in this study. Letting , and δt = 2γTot/ω, Eq. 5 simplifies to
| (7) |
For shelled microbubbles the damping constant (δt) has three major components: Mechanical resistance due to shell viscosity, δsh, mechanical resistance from viscous forces, δL, and re-radiation of acoustic energy, δrad (Hoff et al., 2000et al.,; Hoff, 2001; Holt and Roy, 2001),
| (8) |
In Eq. 8, c represents the speed of sound in tissue, μB is the viscosity of blood and, μsh is the shear viscosity of the shell. Of the three damping factors, only the first two (damping due to the shell and viscous liquid) contribute to tissue heating. The damping by the shell, δsh, is the dominant factor in damping the bubble oscillations. For bubbles of between 1 and 2 μm in radius, and for sonication between 1 and 3 MHz, the magnitude of δL and δrad are small and are approximately 5% and 1% of the shell damping, δsh. Combining Eqs. 4, 7 for spherical microbubbles yields a direct relationship between microbubble characteristics and βBub,
| (9) |
Ensemble of bubbles with a size distribution
The microbubble agents used for ultrasound medical imaging and ultrasound antivascular therapy consist of an ensemble of microbubbles of different sizes. The size of microbubbles in the ensembles is asymmetrically distributed about the peak bubble radius, Rp. For an ensemble of microbubbles with size distribution represented by the probability density function , Eq. 9 takes the form (Razansky et al., 2006et al.,)
| (10) |
where , , and δt are functions of R0. Since the wave number for the tissue, with microbubbles, is
| (11) |
Equations 10, 11, the same as that obtained earlier for bubbly liquids (Leighton, 1994; Razansky et al., 2006et al.,), assume the concentration (volume fraction) of the microbubbles in the tissue is small and ρTB ≈ ρT. The wave number kTB is complex, where the real part is the effective wave number of the ultrasound propagation, and the complex component is the attenuation coefficient, αB, of the ultrasound waves due to microbubbles:
| (12) |
In Eq. 12, c is described in cm/s and ω is in cycles/s. Equation 12 is the same as obtained earlier (Razansky et al., 2006). In the limit when there are no microbubbles in the tissue, αB → 0, indicating that Eq. 12 applies to nonattenuating tissues. Biological tissues are known to attenuate ultrasound according to the power law (Bamber, 1986),
| (13) |
where αT is the attenuation coefficient of the tissue, α0 is a constant, and f is the sonication frequency in MHz. The exponent m for soft tissue ranges between 1.1 and 1.3 (Goss et al., 1978et al.,). For attenuating biological tissues, total attenuation, αTB, is the sum of Eqs. 12, 13:
| (14) |
Under the approximation m ≈ 1, αT is ∼0.5 dB/cm/MHz for soft biological tissues (Goss et al., 1978et al.,). In biological tissues only a part of attenuation is due to the absorption of ultrasound. Refraction, reflection, and scattering all contribute to attenuation. The contribution of absorption to attenuation relative to other factors varies with the tissue type. In soft issues, the absorption contribution can range from half to one-third of the total attenuation (Goss et al., 1979et al.,), although there is no universally accepted value for the absorption contribution. It is demonstrated later that the choice of absorption contribution does not significantly affect the results. For the purpose of this study, we assume that half of the energy lost by the ultrasound waves is due to absorption. That is, αT = 0.25 f dB/cm.
In Eq. 14 αTB primarily represents the absorption coefficient of ultrasound from both the tissue and the microbubbles in the vasculature. To determine αTB the probability density function, , as well as the bubble parameters Gsh, dsh, and ush must be known.
In principle, the bubble size distribution could take many forms. A lognormal distribution has been previously proposed to describe the size distribution of commercial microbubble agents (Razansky et al., 2006et al.,),
| (15) |
In Eq. 15, Rp denotes the peak density radius, and σ denotes the standard deviation. The number of bubbles per unit volume of tissue nb is the integral of over all possible bubble radii,
| (16) |
σ in Eq. 15 is determined using the knowledge of the percentage of bubbles below a known radius. For example, the microbubble agent Definity has a peak density radius of 1.1 μm, 98% of its microbubbles have a radius less than 5 μm, and Eq. 16 takes the following form:
| (17) |
Equation 17 is solved iteratively to calculate σ, which for the above-presented example is equal to 0.4. In this study, the attenuation coefficient was calculated for three microbubble distributions A, B, and C corresponding to three different commercial microbubble agents (Table TABLE I.). Although the shell properties depend on the nature of microbubbles, the calculations were performed using fixed shell properties (Razansky et al., 2006et al.,): Gsh = 88.8 MPa, dsh = 15 nm, and μsh = 1.77 Pa s. The absorption coefficient of tissue in the presence of lognormally-distributed microbubbles was calculated by Eq. 14 as a function of frequency and concentration of microbubbles. Sound speed, c, and tissue density, ρT, were assumed to be 1540 m/s and 1060 kg/m3, respectively. For comparison between distributed and identical bubbles, the absorption coefficient was also calculated as a function of frequency for an ensemble of identical bubbles of radius 1.5 and 3 μm.
TABLE I.
Attributes of the microbubble distributions used in calculations of attenuation.
| Microbubble distribution | Peak density radius (μm) | % of bubbles less than peak density radius | σ (standard deviation of bubble distribution) | Bubbles per μl for volume fraction 10−5 | Commercial agent with similar properties |
|---|---|---|---|---|---|
| A | 1.1 | 98% < 5 μm | 0.40 | 165 | Definitya |
| B | 1.7 | 95% < 5 μm | 0.35 | 80 | Optisonb |
| C | 2.37 | — | 0.47 | 9 | Albunexc |
Lantheus Medical Imaging, N. Billerica, MA.
GE Healthcare, Milwaukee, WI.
Molecular Biosystems, San Diego, CA.
The concentration of microbubbles can be measured either as the number of bubbles per unit volume, or as the total volume of bubbles per unit volume of tissue (a dimensionless quantity). The relationship between these two measurements of concentration of bubbles is described by Eq. 18, where is the volume of bubbles per unit volume of tissue (volume fraction), and nb is the number of bubbles per unit volume of the tissue,
| (18) |
The quantity inside the parentheses of Eq. 18 represents the average (mean) volume of a single microbubble. Since the mean bubble volume varies with the size distribution, a fixed volume fraction concentration represents different number of bubbles per unit volume; examples for three distributions of microbubbles are given in Table TABLE I..
Bubble-enhanced heating in the presence of blood flow
In the presence of microcirculation and blood flow, heat deposited by ultrasound is transported away from the region of insonation. The temperature change due to ultrasound heating in the presence of blood flow is determined by the bioheat transfer equation (Pennes, 1948),
| (19) |
In Eq. 19, T is the rise in temperature above an equilibrium temperature, ρTB is the tissue mass density, C is the tissue-volume specific heat, Cb is the blood-volume specific heat, κ is the tissue thermal conductivity, and w is the blood perfusion rate. The first term Q is the rate of heat deposition per unit volume and is determined by the absorption of ultrasound by tissues and microbubbles. The bioheat equation can be solved in detail by numerical methods, iterative methods, or finite element methods. However, under the approximation that sonication intensities are low, the temperature rise induced by the ultrasound beam varies slowly over the insonated tissue region. Thus the heat conduction related effects due to local differences in temperature and heat capacity are small and the second term on the right can be ignored—the resulting first-order ordinary differential equation has a simple solution described by Eq. 20. Under high-intensity sonications, involving rapid increases in temperature, the heat conduction effects could play an important role and must be explicitly considered (Klotz et al., 2010et al.,). Temperature change under minimal heat conduction is described as
| (20) |
where is the final temperature rise, , is the characteristic time, and Q is defined as
| (21) |
where 〈I(x)〉 is the time-averaged ultrasound intensity, and x is distance along the axis of ultrasound propagation. If xmax is the maximum depth at which the ultrasound waves are still strong enough to cause significant heating, the mean heat deposited per unit volume over this distance is (Mast et al., 2005et al.,)
| (22) |
If ξ represents the fraction of the initial ultrasound intensity that still causes significant heating,
| (23) |
| (24) |
For example, if significant heating occurs until the ultrasound waves have attenuated to 5% of their original value, the maximum distance, xmax that can be heated is equal to 1.5/αTB. Combining Eqs. 20, 24 provides a direct relation between temperature change with sonication time and the acoustic and tissue properties,
| (25) |
For the condition that tissue heating only occurs at ultrasound intensities at or above 5% of the initial intensity, ξ = 0.05 and the temperature change with time is described by
| (26) |
Using Eq. 26, temperature change was calculated as a function of frequency, both for tissue alone, and for tissue with microbubbles for varying conditions of microbubble concentrations and flow rates. All of the above-presented calculations were performed assuming that microbubbles were present in the ultrasound beam throughout the sonication time; due to blood flow, microbubbles are only present in the ultrasound beam for part of the sonication time, as discussed below. Therefore, the temperature increases estimated by Eq. 26 represent the upper bounds.
Effect of blood flow on ultrasound–microbubble interaction
The absorption of ultrasound by intravascular microbubbles described by Eq. 14 represents the condition where the same microbubbles are present in the ultrasound beam for the entire duration of sonication. Due to blood flow, the microbubble population in the ultrasound beam is constantly updated and any given group of microbubbles is only present in the ultrasound beam for a limited period of time before flowing out of the insonated region. That is, a given group of microbubbles moving in the vasculature reside in the ultrasound beam for only a fraction (χ) of the insonation time before being replaced by a new group of inflowing bubbles. In effect, the absorption coefficient is reduced by a factor χ and the effective rate of heat deposit [Eq. 24] in the presence of flow takes the following form:
| (27) |
where χ ≤ 1 and is a measure of the efficiency of microbubbles to deposit ultrasound energy as heat under different flow conditions. For stationary microbubbles (zero flow velocity), χ = 1 and the microbubbles are most efficient in depositing ultrasound energy as heat. With increasing flow velocity, the time microbubbles reside in the beam decreases and the transfer of acoustic energy to heat through microbubble oscillations is also reduced. In the limiting condition of high flow velocity the microbubbles transit the beam rapidly, χ approaches zero, and the microbubbles do not have sufficient time to interact with the ultrasound. Under this condition of high flow the microbubbles do not enhance ultrasound heating.
| (28) |
Equation 28 illustrates that microbubble-induced heating depends on multiple factors that include ultrasound wave properties (ξ, I0), vascular flow properties (w, χ), tissue properties (αT, Cb, τ), and microbubble properties (αB). In this study the absorption of ultrasound and the temperature increase in tissues containing intravascular microbubbles were calculated as a function of the blood perfusion rate (w) for different microbubble radii and concentrations, sonication conditions, and microbubble interaction times (χ); the aim was to model the in vivo conditions associated with antivascular ultrasound therapy.
RESULTS
Microbubble ensembles with distributed radii
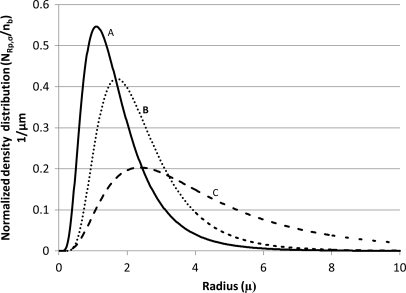
The lognormal distributions of microbubble radii for three different commercial microbubble agents were tabulated (distributions A, B, and C; Table TABLE I.). Although the standard deviation values, σ, are comparable, the distributions for the three agents are significantly different and are influenced by peak density radius, Rp (Fig. 2). For example, while the majority of microbubbles of distribution A are below 2 μm, a significant number of bubbles of distribution C are above 2 μm (Fig. 2).
Figure 2.
Normalized density distribution for microbubble distributions A, B, and C (Table TABLE I.). The peak density radii for the three distributions are 1.1, 1.7, and 2.37 μm and the sigma values are 0.40, 0.35, and 0.47, respectively.
Ultrasound absorption by microbubble ensembles
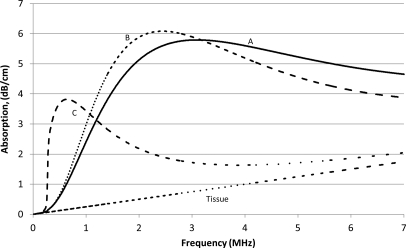
The ultrasound absorption coefficient of the soft tissues containing 10−5 ml microbubbles/ml of tissue was calculated using Eq. 14 (Fig. 3). A volume fraction of 10−5 corresponded to 165 microbubbles/μl for distribution A, 80 microbubbles/μl for distribution B, and 9 microbubbles/μl for distribution C. In all cases, the microbubbles exhibited significant absorption which varied with frequency as a complex asymmetric bell-shaped curve. Tissues with microbubble distribution A exhibited a peak absorption of 5.8 dB/cm at 3.1 MHz. Similarly, tissues with microbubble distributions B and C had peak absorptions of 6.1 and 3.8 dB/cm at 2.4 and 0.64 MHz, respectively. The microbubble distributions with a higher peak density radius achieved maximal absorption at lower frequencies. For example, distribution A, with a peak density radius of 1.10 μm, reached maximum absorption at 3.1 MHz, whereas distribution C, with a higher peak density radius of 2.37 μm, reached maximum absorption at 0.64 MHz.
Figure 3.
Absorption vs frequency curves for biological tissues with microbubbles A, B, and C and tissue alone. The calculations were performed for the microbubble concentration of 10−5 ml of microbubbles/ml of tissue. Note that the absorption of the microbubble ensembles is greater than that of tissues alone, and that the differences between the absorption of the three ensembles are frequency dependent.
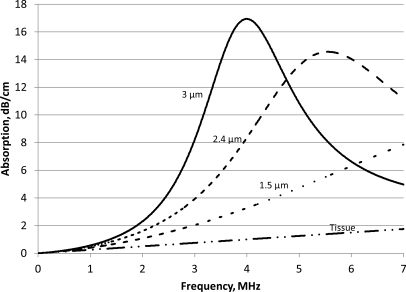
The absorption for an ensemble in which all microbubbles had the same radius (1.5, 2.4, or 3 μm) is shown in Fig. 4. The calculations were performed for the microbubble concentration 10−5 ml microbubbles per ml of tissue, which corresponded to 88 microbubbles/μl of tissue for the 3 μm microbubbles and 707 bubbles/μl of tissue for the 1.5 μm microbubbles. The maximum absorptionsfor bubbles of radius 3, 2.4, and 1.5 μm is 16.9, 14.6, and 8.7 dB/cm, occurring at 3.99, 5.56, and 10.9 MHz, respectively. The absorption of the microbubble populations was greater than that of tissues alone and microbubbles with the higher radius showed greater absorption at a lower frequency than those of a smaller radius. If all bubbles are the same size, the peak absorption occurred close to the bubbles’ resonant frequency. For example, for 3 μm bubbles, the resonant frequency was 4.007 MHz [Eq. 6], and the peak absorption occurred at 3.985 MHz. For 1.5 μm bubbles, the resonance frequency was 11.1 MHz and the peak absorption occurred at 10.9 MHz. In each example, because all of the microbubbles were of the same radius, the resonant frequency for all microbubbles was the same. This led to a higher peak absorption with a narrower peak-width compared to an ensemble in which the microbubbles had a range of radii (Figs. 34).
Figure 4.
Absorption vs frequency for biological tissues with all microbubbles having the same radius, compared to the absorption from tissue only. The numbers on the curve represent the radius of the microbubbles.
Temperature elevation
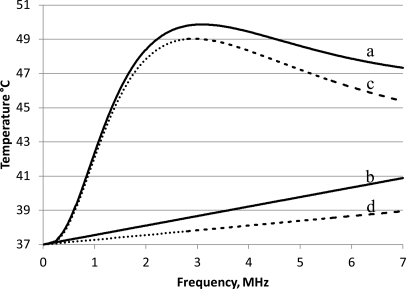
The expected temperature elevation, due to ultrasound absorption in tissues, was calculated with and without microbubbles (distribution A) in the circulating blood [Eq. 26; Fig. 5]. Without microbubbles the temperature increased linearly with frequency, whereas when microbubbles were present in the circulation, temperature peaked at the frequency of maximal ultrasound absorption. With an ultrasound intensity of 2.2 W/cm2 at a frequency of 3.1 MHz, a fractional microbubble volume of 10−5 ml/ml tissue, and a flow rate of 18.7 kg/m3/s, the maximum temperature reached above the body temperature was 49.9 °C (Fig. 5). The calculations were performed for 3 min insonations; a time identical to that which produced significant antivascular effects experimentally (Wood et al., 2005et al.,; Bunte et al., 2006et al.,). Tissue-volume specific heat, C, and blood-volume specific heat, Cb, were assumed to be 3600 and 3720 J/kg/°C, respectively. More than 96% of the temperature rise occurred during 180 s; ultrasound treatments after 3 min increased the temperature marginally above 49.9 to 50.4 °C. The kinetics of temperature change and its temperature dependence are described in more detail later.
Figure 5.
Temperature vs frequency after 3 min of sonication at 2.2 W/cm2 and a blood perfusion rate of 18.7 kg/m3/s. The solid lines show temperature when sonicating with microbubble distribution A (Table TABLE I.), with a fractional volume of 10−5 ml bubbles/ml tissue (curve a), vs temperature when sonicating without microbubbles (curve b), under the assumption that 50% of the attenuation from tissues results in heat absorption. The dotted lines show temperature when sonicating with microbubble distribution A (curve c) vs without microbubbles (curve d), under the assumption that 25% of the attenuation from tissue results in heating.
Although there was heating without microbubbles (due to direct absorption of ultrasound by the tissues), the majority of the heating came from the microbubbles (Fig. 5). For example, at 3.1 MHz (the frequency of maximum ultrasound absorption), the temperature increase in tissues without microbubbles was 1.7 °C above the body temperature, whereas in the presence of microbubbles the temperature increased by 12.9 °C. The absorption using microbubbles distribution A reaches an initial peak at 3.1 MHz. At higher frequency the contribution from the microbubbles to the total is reduced. For example, at 10 MHz the temperature increase from the microbubbles is 4.4 °C, compared to 7.5 °C from direct heating.
In most of the simulations presented in this study, it was assumed that heat absorption is 50% of the attenuation due to tissues. Since there is no consensus on the exact absorption contribution, calculations were also performed for heat absorption being 25% of the attenuation. Both calculations were performed in the presence of microbubble distribution A (Fig. 5). When the percentage of heat absorption is reduced from 50% to 25%, the maximum temperature level reached changed from 49.9 to 49.3 °C, and the frequency which produced the peak temperature rise changed from 3.1 to 3.0 MHz.
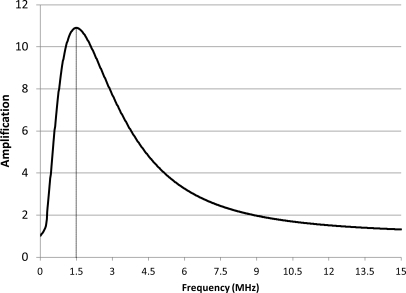
The amplification in the microbubble-induced heating (the ratio of temperature increase in the presence of microbubbles to the increase in tissue alone without microbubbles) was frequency dependent and limited to a narrow band of frequencies (Fig. 6). For the microbubble distribution A, the maximal amplification in bubble-enhanced heating occurred at 1.5 MHz. Both higher and lower frequencies resulted in lower amplification (Fig. 6).
Figure 6.
Temperature amplification (the ratio of temperature increase with and without microbubbles) as a function of frequency for the data shown in Fig. 5. The maximum temperature amplification of 10.9 occurs at 1.5 MHz.
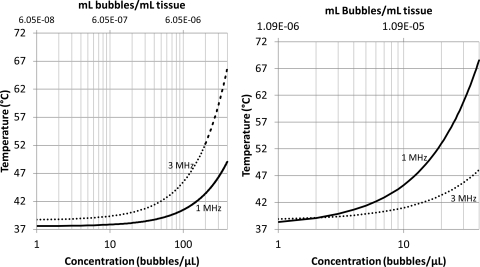
The role of microbubble concentration on temperature elevation was plotted for microbubble distributions A and C [Figs. 7a, 7b]. The temperatures increased nonlinearly with the microbubble concentration. For bubble distribution A and distribution B (not shown) the temperature increased more rapidly at 3 than at 1 MHz. Whereas for distribution C, the temperature increased more rapidly at 1 than at 3 MHz. At low concentrations the temperature elevation was slightly greater at 3 than at 1 MHz; this is because at low enough concentrations, most of the absorption is due to the tissues and not the microbubbles.
Figure 7.
Temperature vs concentration after 3 min of sonication at 2.2 W/cm2 and blood perfusion rate of 18.7 kg/m3/s, for sonication at frequencies of 1 and 3 MHz. (a) (left) The temperature rise using microbubble distribution A (Table TABLE I.), and (b) (right) for distribution C.
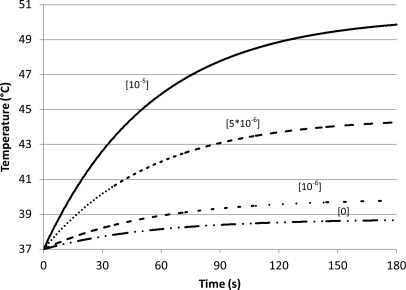
Using Eq. 26 and distribution A, the temperature rise during sonication (in the presence and absence of microbubbles) was plotted (Fig. 8). With increasing insonation time, the temperature rise slowed exponentially as it asymptotically approached a peak value. At higher microbubble concentrations there were higher initial heating rates. The temperature approached its peak value at the same rate, regardless of the concentration of the microbubbles. That is, 96% of the temperature increase occurred in the first 3 min (Fig. 8).
Figure 8.
Temperature vs time for different concentrations of microbubbles [distribution A (Table TABLE I.); insonation at 3 MHz and 2.2 W/cm2; and blood perfusion rate of 18.7 kg/m3/s]. The numbers above each curve represent concentrations of microbubbles in ml bubbles/ml tissue. As the number of microbubbles increases there is a corresponding increase in tissue temperature.
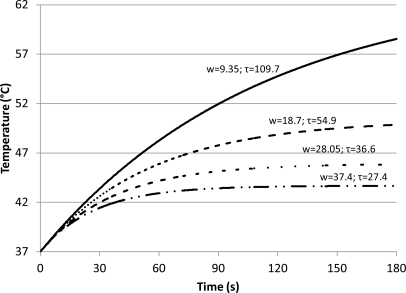
The effect of flow rate on temperature elevation in the presence of a given concentration of microbubbles was plotted (Fig. 9). Lower flow rates resulted in higher temperature; a decrease in the blood flow by half doubled the final temperature. Although changing the blood flow rate did not affect the initial rate of heating, it influenced how quickly the temperature approached its final peak value. At slower blood flow it took longer to reach the maximum temperature. The characteristic time of heating (τ)—a measure of the time it took to reach the peak temperatures—doubled as the flow (w) was reduced to half (Fig. 9).
Figure 9.
Temperature increase at different blood perfusion rates in the presence of microbubble distribution A (Table TABLE I.) at a concentration of 10−5 ml microbubbles/ml tissue. The calculations were performed for ultrasound intensity and frequency of 2.2 W/cm2 and 3 MHz, respectively; the numbers above the curves represent blood flow in units of kg/s/m3. As flow rate increases there is a corresponding decrease in tissue temperature.
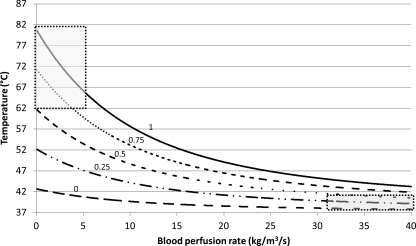
The temperature change when the microbubbles are present in the ultrasound beam for different fractions of insonation time (χ) was computed using Eq. 28 (Fig. 10). The calculations were performed for the sonication time of 3 min at 2.2 W/cm2 and 3 MHz using 10−5 ml microbubbles/ml tissue of microbubble distribution A (Table TABLE I.). The individual curves in Fig. 10 represent temperature change as function of flow for different values of χ. The results show that while at low flow rates there was a significant change in temperature elevation with χ, at high flow rates the curves converge and the dependence on χ becomes weak. Thus, blood flow had a marked affect on temperature rise; all other factors being the same, slower flow results in higher temperature (Figs. 910).
Figure 10.
Temperature increase at different interaction times. Each curve represents temperature change at different blood perfusion rates. The numbers above each curve represent the fraction of sonication time the microbubbles are present in the ultrasound beam. The heating pattern in tumor vessels will correspond to the upper left part of the curve (upper left box), while the normal blood vessels with faster blood flow will follow the heating pattern on the right side of the lowest curve (lower right box).
DISCUSSION AND CONCLUSION
Previous studies have shown that sonication of intravascular microbubbles disrupts the walls of the tumor microvessels (Wood et al., 2007et al.,; Goertz et al., 2008; Chin et al., 2009). The key to successful antivascular treatment is the delivery of sufficient energy to the microbubbles within the lumens of the tumor vasculature. Microbubbles in the circulating blood provide a mechanism for delivering acoustic energy at the site of microvasculature. While multiple mechanisms including cavitation, shear, and heating could contribute to vascular disruption, in this study we have evaluated the role of thermal effects through mathematical modeling of microbubble oscillations driven by low-intensity ultrasound. The compressibility of tissues was modeled as an algebraic sum of the individual components of tissue and microbubbles. When exposed to ultrasound, the microbubbles undergo damped oscillations transforming acoustic energy to heat at the site of the vasculature. Simulations were performed for microbubble ensembles with different size distributions under different experimental conditions of insonation and flow rates. The results showed that the size distribution of the microbubbles in the tissue vasculature had considerable influence on the response of microbubbles to insonation and the absorption of ultrasound and the resultant tissue heating.
Simulations showed that the ultrasound absorption and the temperature change in the presence of a microbubble ensemble (distribution A) at 3 MHz was 2.3 times the absorption and temperature change at 1 MHz. The measured in vivo antivascular activity in murine tumors using the identical microbubble ensemble showed that sonication at a fixed ultrasound intensity of 3 MHz reduced tumor vascularity to 28.8% compared to 14.6% at 1 MHz; a two times greater effect at 3 than at 1 MHz sonication (Wood et al., 2008et al.,). The average temperature measured during treatment at 3 MHz was 5.0 °C compared to 2.6 °C at 1 MHz; a 1.9 times increase from 1 to 3 MHz sonication (Wood et al., 2008et al.,). Given the complexities of biological measurements, these murine tumor results are comparable to those of our model. The frequency relationship, however, varies markedly with the nature of microbubble distribution. In contrast to microbubbles with a lower peak density radius (distribution A), the microbubble distribution with a greater fraction of larger microbubbles (distribution C) exhibited lower ultrasound absorption at 3 MHz and are therefore likely to yield lower intravascular temperatures and reduced antivascular activity at 3 compared to 1 MHz.
All factors being the same, ensembles of identically sized microbubbles had a higher absorption than those with distributed size. The advantage of using single sized bubbles is that they can lead to high temperatures at lower concentrations. However, the ultrasound contrast agents currently in use for imaging and therapy primarily consist of microbubbles with distributed radii.
As compared to tissue alone, the presence of microbubbles in the vasculature has a marked effect on delivering heat energy to the target tissues. With continuous low-intensity ultrasound, the temperature rise is assumed to be slow and the conductive term in the bioheat equation is assumed to be negligible. However, under different sonication conditions involving high-intensity pulsed ultrasound the temperature changes are likely to be rapid and the conductive effects must be considered. The results of this study show that at a low ultrasound intensity (2 W/cm2), a volume fraction of microbubbles as small as 10−5 can enhance local vascular temperatures two to ten times the temperatures achieved by direct absorption of ultrasound by the tissues. These estimates are higher than the temperature enhancement expected from single sized free bubbles using the modified Rayleigh–Plesset equation (Umemura et al., 2005et al.,). For microbubbles with a lower peak density radius (distribution A), the maximum benefit (gain) of using microbubbles occurs at frequencies of 1–3.5 MHz. At higher frequencies the microbubble-induced heating decreased, whereas heating of tissue by direct absorption of ultrasound increased. Since localized heating of the vasculature by microbubbles is more desirable for antivascular therapy than the heating by tissue through direct absorption, the frequency range of 1–3 MHz is most suitable for antivascular therapy for microbubbles with a lower peak density radius (distribution A). For antivascular treatment below 1 MHz, it would be preferable to use microbubbles with an intermediate peak intensity radius (distribution B) due to the higher absorption of ultrasound in that frequency range. The simulations also show that temperature increase is primarily determined by microbubble concentration; larger concentrations yielded higher temperatures. While the magnitude of heating depended on the concentration of microbubbles, the time it took tissue to reach its maximum temperature was determined primarily by the blood flow rates; for example, at slower flow rates it took longer to reach the peak temperature. Individual microbubbles represent localized heat sources. Rather than considering them individually, the present model treats the microbubbles as an aggregate with average thermal and other physical properties. Also, it has been shown that the oscillations of the circulating microbubbles are influenced by the nature of the blood vessels (Sassaoroli and Hynynen, 2004). In a living biological system the size and the properties of the blood vessels vary widely and the significance of these vascular effects on aggregate temperature is not accounted for by the present model and remains to be evaluated.
The net heat generated by microbubbles is markedly affected by the blood flow; two factors are responsible for blood flow related effects. The first is the cooling by the out flow of blood from the heated region according to the bioheat equation. Slow blood flow dissipates less heat and tissues are heated to higher temperatures. The second factor relates to the efficiency or the ability of the microbubbles to deposit heat, which is linked to the time the microbubbles interact with the ultrasound beam. At high flow velocity, microbubbles spend less time in the ultrasound beam, causing less heating before being carried away. In the case of slow or no blood flow, the microbubbles are in the ultrasound beam for the entire treatment time and cause significant heating. The flow dependence of microbubble-enhanced heating has a significant implication on antivascular therapy. Tumor blood vessels are known to have slower blood flow than normal, healthy tissue (Carmeliet and Jain, 2000). Furthermore the network of tumor blood vessels is disorganized and tortuous and is likely to lead to the localized entrapment of microbubbles. Thus, as a result of slow flow and the disorganized nature of the cancer blood vessels, microbubbles are likely to reside in the ultrasound beam longer in cancer tissue than in the normal tissue. Thus, microbubble-induced heating should result in higher temperatures in the cancerous tissue compared to those in the healthy tissue with stronger and organized blood flow. In addition, damage caused due to heating may slow the blood flow in targeted areas further, in turn causing more heating. This temperature differential in tissues with slow and rapid flows makes it possible to selectively disrupt tumor blood vessels without causing significant adverse effect on normal blood vessels.
In conclusion this study developed a model to simulate the diverse conditions of microbubble-induced heating. The model suggests that small concentrations (volume fraction 10−5) of shelled microbubbles with distributed radii when insonated with ultrasound result in a marked heating of vascular volumes. The magnitude and the rate of temperature elevation is highly flow dependent. Due to lower heat dissipation and longer microbubble–ultrasound interactions, slow flow conditions lead to higher temperatures, which allow selective targeting of tumor blood vessels. In the future the result of this study could be useful in guiding and planning antivascular ultrasound therapy for individual patients with cancer.
ACKNOWLEDGMENT
This work was supported by NIH Grant No. CA139657.
References
- Bamber, J. C. (1986). Physical Principles of Medical Ultrasonics, edited by Hill C. R. (Wiley, New York: ), pp 118–186. [Google Scholar]
- Bunte, R. M., Ansaloni, S., Sehgal, C. M., Lee, W. M. F., and Wood, A. K. W. (2006). “Histopathological observations of the antivascular effects of physiotherapy ultrasound on a neoplasm,” Ultrasound Med. Biol. 32, 453–461. 10.1016/j.ultrasmedbio.2005.12.005 [DOI] [PubMed] [Google Scholar]
- Carmeliet, P., and Jain, R. K. (2000). “Angiogenesis in cancer and other diseases,” Nature (London) 407, 249–257. 10.1038/35025220 [DOI] [PubMed] [Google Scholar]
- Chin, C. T., Raju, B. J., Shevchenko, T., and Klibanov, A. L. (2009). “Control and reversal of tumor growth by ultrasound activated microbubbles,” Proceedings of the 2009 IEEE Ultrasonics Symposium, pp. 77–80.
- Church, C. C. (1995). “The effects of an elastic solid surface layer on the radial pulsations of gas bubbles,” J. Acoust. Soc. Am. 97, 1510–1521. 10.1121/1.412091 [DOI] [Google Scholar]
- Fujishiro, S., Mitsumor, M., Nishhimura, Y., Okuno, Y., Nagata, Y., Hiraoka, M., Sano, T., Marume, T., and Takayama, N. (1998). “Increased heating efficiency of hyperthermia using an ultrasound contrast agent: A phantom study,” Int. J. Hyperthermia 14, 495–502. 10.3109/02656739809018250 [DOI] [PubMed] [Google Scholar]
- Goertz, D. E., Karshafian, R., and Hynyen, K. (2008). “Antivascular effects of pulsed low intensity ultrasound and microbubbles in mouse tumors,” Proceedings of the 2008 IEEE Ultrasonics Symposium, pp. 670; –673.
- Goertz, D. E., Karshafian, R., and Hynyen, K. (2009). “Investigating the effects of pulsed low intensity ultrasound and microbubbles in mouse tumors,” Proceedings of the 2009 IEEE Ultrasonics Symposium, pp. 89; –92.
- Goss, S. A., Frizell, L. A., and Dunn, F. (1979). “Ultrasonic absorption and attenuation in mammalian tissues,” Ultrasound Med. Biol. 5, 181–186. 10.1016/0301-5629(79)90086-3 [DOI] [PubMed] [Google Scholar]
- Goss, S. A., Johnston, R. L., and Dunn, F. (1978). “Comprehensive compilation of empirical ultrasonic properties of mammalian tissues,” J. Acoust. Soc. Am. 64, 423–457. 10.1121/1.382016 [DOI] [PubMed] [Google Scholar]
- Hoff, L. (2001). Acoustic Characterization of Contrast Agents for Medical Ultrasound Imaging (Kluwer Academic, Dordrecht), Chap. 5, pp. 105–119. [Google Scholar]
- Hoff, L., Sontum, P. C., and Hovern, J. M. (2000). “Oscillations of polymeric microbubbles: Effect of the encapsulating shell,” J. Acoust. Soc. Am. 107, 2272–2280. 10.1121/1.428557 [DOI] [PubMed] [Google Scholar]
- Holt, R. G., and Roy, R. A. (2001). “Measurements of bubble-enhanced heating from focused, MHz-frequency ultrasound in tissue-mimicking material,” Ultrasound Med. Biol. 27, 1399–1412. 10.1016/S0301-5629(01)00438-0 [DOI] [PubMed] [Google Scholar]
- Klotz, A. R., Lindvere, L., Stefanovic, B., and Hynynen, K. (2010). “Temperature change near microbubbles within a capillary network during focused ultrasound,” Phys. Med. Biol. 55, 1529–1561. 10.1088/0031-9155/55/6/001 [DOI] [PMC free article] [PubMed] [Google Scholar]
- Leighton, T. G. (1994). The Acoustic Bubble (Academic, London: ), Chap. 4, pp. 287–438. [Google Scholar]
- Mast, T. D., Makin, I. R., Faidi, W., Runk, M. M., Barthe, P. G., and Slayton, M. H. (2005). “Bulk ablation of soft tissue with intense ultrasound: modeling and experiments,” J. Acoust. Soc. Am. 118, 2715–2724. 10.1121/1.2011157 [DOI] [PubMed] [Google Scholar]
- Pennes, H. H. (1948). “Analysis of tissues and arterial blood temperatures in the resting human forearm,” J. Appl. Physiol. 1, 93–122. [DOI] [PubMed] [Google Scholar]
- Razansky, D., Einziger, P. D., and Adam. D. R. (2006). “Enhanced heat deposition using ultrasound contrast agent—Modelling and experimental observations,” IEEE Trans Ultrason. Ferroelectr. Freq. Control 53, 137–147. 10.1109/TUFFC.2006.1588399 [DOI] [PubMed] [Google Scholar]
- Sassaoroli, E., and Hynynen, K. (2004). “Forced linear oscillations of microbubbles in blood capillaries,” J. Acoust. Soc. Am. 115, 3235–3243. 10.1121/1.1738456 [DOI] [PubMed] [Google Scholar]
- Sehgal, C., Steer, R. P., Sutherland, R. G., and Verrall, R. E. (1977). “Sonoluminescence of aqueous solutions,” J. Phys. Chem. 81, 2618–2620. 10.1021/j100541a008 [DOI] [Google Scholar]
- Umemura, S., Kawabata, K., and Sasaki, K. (2005). “in vivo acceleration of ultrasonic tissue heating by microbubble agent,” IEEE Trans. Ultrason. Ferroelectr. Freq. Control 52, 1690–1698. 10.1109/TUFFC.2005.1561623 [DOI] [PubMed] [Google Scholar]
- Wood, A. K. W., Ansaloni, S., Ziemer, L. S., Lee, W. M. F., Feldman, M. D., and Sehgal, C. M. (2005). “The antivascular action of physiotherapy ultrasound on murine tumors,” Ultrasound Med. Biol. 31, 1403–1410. 10.1016/j.ultrasmedbio.2005.06.008 [DOI] [PMC free article] [PubMed] [Google Scholar]
- Wood, A. K. W., Bunte, R. M., Cohen, J. D., Tsai, J. H., Lee, W. M.-F., and Sehgal, C. M. (2007). “The antivascular action of physiotherapy ultrasound on a murine tumor: Role of a microbubble contrast agent,” Ultrasound Med. Biol. 33, 1901–1910. 10.1016/j.ultrasmedbio.2007.06.013 [DOI] [PMC free article] [PubMed] [Google Scholar]
- Wood, A. K. W., Bunte, R. M., Price, H., Deitz, M., Tsai, J. H., Lee, W.M. -F., and Sehgal, C. M. (2008). “The disruption of murine tumor neovasculature by low-intensity ultrasound—Comparison between 1 MHz and 3 MHz sonication frequencies,” Acad. Radiol. 15, 1133–1141. 10.1016/j.acra.2008.04.012 [DOI] [PMC free article] [PubMed] [Google Scholar]
- Wood, A. K. W., Bunte, R. M., Schultz, S. M., and Sehgal, C. M. (2009). “Acute increases in murine tumor echogenicity following antivascular ultrasound therapy: A pilot preclinical study,” J. Ultrasound Med. 28, 795–800. [DOI] [PubMed] [Google Scholar]
- Wood, A. K. W., Schultz, S. M., Lee, W.M -F., Bunte, R. M., and Sehgal, C. M. (2010). “Antivascular ultrasound therapy lengthens survival of mice with implanted melanomas,” Ultrasound Med. Biol. 36, 853–857. 10.1016/j.ultrasmedbio.2010.02.001 [DOI] [PMC free article] [PubMed] [Google Scholar]


