

Abstract
The molecular events responsible for obstruction of aqueous humor outflow and the loss of retinal ganglion cells in glaucoma, one of the main causes of blindness worldwide, remain poorly understood. We identified a synonymous variant, c.765C>T (Thr255Thr), in ankyrin repeats and suppressor of cytokine signaling box-containing protein 10 (ASB10) in a large family with primary open angle glaucoma (POAG) mapping to the GLC1F locus. This variant affects an exon splice enhancer site and alters mRNA splicing in lymphoblasts of affected family members. Systematic sequence analysis in two POAG patient groups (195 US and 977 German) and their respective controls (85 and 376) lead to the identification of 26 amino acid changes in 70 patients (70 of 1172; 6.0%) compared with 9 in 13 controls (13 of 461; 2.8%; P = 0.008). Molecular modeling suggests that these missense variants change ASB10 net charge or destabilize ankyrin repeats. ASB10 mRNA and protein were found to be strongly expressed in trabecular meshwork, retinal ganglion cells and ciliary body. Silencing of ASB10 transcripts in perfused anterior segment organ culture reduced outflow facility by ∼50% compared with control-infected anterior segments (P = 0.02). In conclusion, genetic and molecular analyses provide evidence for ASB10 as a glaucoma-causing gene.
INTRODUCTION
Glaucoma is a major cause of blindness affecting 60 million people worldwide (1). Primary open angle glaucoma (POAG), the most common form of glaucoma, is a heterogeneous group of optic neuropathies that leads to optic nerve atrophy and permanent loss of vision. Known risk factors include raised intraocular pressure (IOP), a positive family history, ageing and race (1). POAG is often categorized into clinical entities such as glaucoma with elevated IOP, normal tension glaucoma (NTG) and juvenile open angle glaucoma (JOAG) (2,3).
At least 16 chromosomal loci have been mapped through linkage analysis for POAG (GLC1A-P) (4,5). However, only three POAG genes have been identified so far: myocilin (MYOC/GLC1A; MIM 601652), optineurin (OPTN/GLC1E; MIM 137760) and WD repeat domain 36 (WDR36/GLC1G; MIM 609669) (6–8). In addition, candidate gene studies provide evidence for at least 20 POAG susceptibility genes (9), including TANK-binding kinase 1 (TBK1; MIM 604834), cytochrome P450-1B (CYP1B1; MIM 231300) and neurotrophin-4 (NTF4; MIM 162662) (5,10,11). Recent genome-wide association studies identified variants near caveolin 1 (CAV1; MIM 601047), caveolin 2 (CAV2; MIM 601048), transmembrane and coiled-coil domains 1 (TMCO1) and cyclin-dependent kinase inhibitor antisense RNA associated with POAG (CDKN2B-AS; MIM 613149) (12,13). Despite these findings, the molecular etiology of POAG remains unclear.
We linked glaucoma in a large Oregon family to chromosome 7q35–q36, the GLC1F locus, which encompassed a region of 7.9 Mb or 5.3 cM (14). Identified crossovers refined this region to 2.2 Mb, reducing the number of genes to 42. Mutational analysis of these genes in the family allowed identification of ankyrin repeats and suppressor of cytokine signalling (SOCS) box-containing protein 10 (ASB10) as a novel candidate POAG gene (MIM 603383). Mutation screening of ASB10 in two different POAG cohorts from the USA and Germany and their respective control groups provides further support for ASB10 as the GLC1F gene. ASB10 protein expression pattern in eye tissues and alternative mRNA splicing were evaluated. Silencing of ASB10 mRNA was shown to reduce outflow facility in human anterior segment perfusion culture.
RESULTS
Mutation screening of the genes in the GLC1F region
The original GLC1F region was further refined to 2.24 Mb by identification of crossovers in the disease haplotype in affected family members at rs4401760 (proximal end) and rs73161885 (telomeric end) (Fig. 1). Sequencing of the 42 genes contained in the refined region identified eight missense coding sequence variants, all were previously reported single-nucleotide polymorphisms (SNPs; minor allele frequency > 0.1) in the HapMap database. Thus, we excluded these non-synonymous SNPs in the GLC1F region as causing POAG in the GLC1F family.
Figure 1.

Pedigree analysis of the GLC1F family and disease haplotype. Black symbols denote patients with POAG, and white symbols denote unaffected or unknown status. Genotypes are listed in the order given by the map to the left. The haplotype of the disease chromosome is boxed. Both SNPs that determined the linkage interval (rs4401760 in II-1 and rs73161885 in IV-2 and IV-3) are also shown. The synonymous mutation in ASB10 found in the family is indicated by Thr255Thr (c.765C>T). Note that the T allele of Thr255Thr segregates with the disease haplotype.
Two unreported synonymous variants were identified including c.765C>T (p.Thr255Thr) in ASB10 (NM_080871.3; NP_543147.2) and c.204G>A (p.Gly68Gly) in transmembrane and ubiquitin-like domain containing protein-1 (TMUB1; NM_031434.3; NP_001129516.1). The c.204G>A (p.Gly68Gly) TMUB1 variant was also present in two controls with no clinical signs of glaucoma, making it unlikely that this variant was causal for POAG. The ASB10 variant, c.765C>T (p.Thr255Thr), segregated with glaucoma in the GLC1F family (Fig. 1). This novel variant was not previously reported in the SNP databases (HapMap or dbSNP), the 1000 Genomes database, nor in the 195 POAG cases and 85 controls from the US data set. Thus, ASB10 became a strong candidate gene for the GLC1F locus.
The entire ASB10 gene, including all introns and exons and 3400 bp 5′ to the coding region, was then sequenced in two affected family members and two family members not carrying the disease haplotype, one control and two unrelated POAG patients. No additional rare variants were found in the affected GLC1F family members.
Synonymous mutation Thr255Thr and alternative mRNA splicing
Bioinformatics analysis using ESEfinder (15) predicted that the synonymous variant, c.765C>T (p.Thr255Thr), would reduce exon splice enhancer (ESE) binding for the serine/arginine-rich (SR) proteins that modulate mRNA splicing. The c.765C>T (p.Thr255Thr) mutation is at the center of a predicted ESE site in exon 3, which would result in the loss of a strong SF2/ASF site and would reduce an SF2/ASF(IgM-BRCA1) site (Fig. 2A). ESEs were predicted by this tool cluster in regions where natural enhancers have been experimentally mapped (15).
Figure 2.

Predicted model of ASB10 alternative splicing, ESE sites and splicing in transformed lymphocytes from POAG patients and controls. (A) Graphical representation of in silico ESE finder analysis. Using the normal ASB10 sequence surrounding the synonymous Thr255Thr change, a number of different splice enhancer binding sites are predicted. When the synonymous change (c.765C>T) (surrounded by red box) is introduced, the splice enhancer SF2/ASF site is lost (green bar, lower panel) and the scores of other ESEs are altered. The nucleotides that were analyzed with ESE finder correspond to nucleotides 860–886 of ASB10 cDNA (NM_080871.3). (B) RT-PCR on transformed lymphocyte RNA from four affected GLC1F family members, the unaffected father of two of them and an unrelated control (Cnt) using primers located in exons 2 and 4 of ASB10. In all individuals, a PCR product of 885 bp (exons 2–4) is present, whereas an additional product of 365 bp (exons 2–4) is detected in affected individuals. The identity of the affected individuals and their position in the pedigree is indicated above the graph. This pedigree is a partial pedigree of the family shown in Figure 1. The agarose gel is representative of several different replicates performed. Western blot analysis of ASB10 protein from lymphoblasts from individual IV-3 is shown. A full-length band (48 kDa) and several smaller-molecular-weight bands are detected using the monoclonal V1 antibody. Molecular weight markers (kDa) are shown. (C) Schematic of the ASB10 protein. Ankyrin repeats are indicated by olive ovals. The SOCS box is indicated by a pink box overlapping exon 5. The position of the synonymous change (Thr255Thr) is indicated by a red box. The predicted coding sequence and protein structure when exon 3 is spliced out is also shown. This leads to a premature stop codon with the loss of five ankyrin repeats and the SOCS box.
When ASB10 mRNA splice forms were compared in four affected and an unaffected GLC1F family members and an unrelated control, an 885 bp polymerase chain reaction (PCR) product was observed in all individuals, whereas a second smaller product was observed in the affected GLC1F family members (Fig. 2B). Sequence analysis of this smaller product revealed that exon 3 was absent in this ASB10 transcript. As a consequence of skipping of exon 3, the reading frame is altered and a stop codon is introduced in exon 4 (Fig. 2C). The smaller protein product is predicted to contain two instead of seven ankyrin repeats and the SOCS box is completely absent (Fig. 2C). Western analysis of ASB10 protein from lymphoblasts from one affected GLC1F individual using a monoclonal V1 antibody is shown. A full-length product was detected as well as various smaller molecular weight products.
Mutation screening of ASB10 in two different POAG case and control cohorts
A systematic sequence analysis of all 6 predicted exons of the 3 reported isoforms of ASB10 was carried out in an Oregon cohort of 195 patients and 85 control subjects followed by a second cohort of 977 German glaucoma patients (440 HTG-POAG, 485 NTG and 52 JOAG) and 376 German controls. This analysis led to the identification of 30 amino acid substitutions in the ASB10 protein including one nonsense mutation (Table 1). Among these 30 variants, two amino acid changes (previously reported as SNPs), c.1069C>T (p.Arg357Cys) and c.1159C>A (p.Pro387Thr), were common sequence variants and were detected in patients and control subjects at a similar frequency; thus, we ruled them out from further analysis. Two amino acid changes were found only in controls: c.271G>T (p.Asp91Tyr) and c.470C>T (p.Ala157Val). After excluding the two common variants, 26 amino acid changes in 70 patients were identified accounting for 6.0% (70 of 1172) of the patient population (Table 1). In controls, 9 amino acid changes in 13 subjects were detected, accounting for 2.8% (13 of 461) of the control group. This represents a significant difference between patients and controls [P = 0.008, two-tailed Fisher's exact test; odds ratio (OR) = 2.2, 95% confidence interval (CI) = 1.14–3.0)]. In addition, we detected 12 variants leading to synonymous amino acid changes (Table 1). The c.765C>T (p.Thr255Thr) variant identified in the GLC1F family was also found in one patient from the German patient cohort.
Table 1.
ASB10 sequence variants found in patients and control individuals of the two cohorts
| Exon | Nucleotide alteration | db SNP | Amino acid substitution | Protein domain | Cohort I (USA) |
Cohort II (Germany) |
||
|---|---|---|---|---|---|---|---|---|
| Patientsa (n = 195) | Controlsa (n = 85) | Patientsa (n = 977) | Controlsa (n = 376) | |||||
| Non-synonymous | ||||||||
| 1 | c.55C>T | rs104886462 | p.Pro19 Ser | N-terminal | 1 | 0 | 5 | 0 |
| 1 | c.94C>A | p.Arg32Ser | N-terminal | 1 | 0 | 0 | 0 | |
| 1 | c.116G>A | p.Arg39Gln | N-terminal | 1 | 0 | 0 | 0 | |
| 1* | c.143C>G | p.Thr48Ser* | N-terminal* | 0 | 0 | 1 | 0 | |
| 1* | c.194G>A | p.Gly65Glu* | N-terminal* | 1 | 0 | 0 | 0 | |
| 1* | c.199G>A | p.Val67Met* | N-terminal* | 0 | 0 | 1 | 0 | |
| 1* | c.215G>A | p.Arg72 His* | N-terminal* | 0 | 1 | 10 | 0 | |
| 1* | c.263A>T | p.Asp88Val* | N-terminal* | 0 | 0 | 1 | 1 | |
| 1* | c.271G>T | p.Asp91Tyr* | N-terminal* | 0 | 1 | 0 | 0 | |
| 1* | c.281G>A | p.Arg94Gln* | N-terminal* | 0 | 0 | 1 | 0 | |
| 1* | c.291T>A | p.Asp97Glu* | N-terminal* | 0 | 0 | 1 | 0 | |
| 2 | c.470C>T | p.Ala157Val | Ankyrin | 0 | 0 | 0 | 1 | |
| 2 | c.502C>T | p.Arg168Cys | Ankyrin | 0 | 0 | 1 | 0 | |
| 2 | c.519C>A | p.Cys173X | Ankyrin | 0 | 0 | 1 | 0 | |
| 2 | c.520C>T | rs104886472 | p.Arg174Trp | Ankyrin | 2 | 0 | 1 | 1 |
| 3 | c.545C>T | p.Ala182Val | Ankyrin | 0 | 0 | 1 | 0 | |
| 3 | c.574G>C | rs104886474 | p.Val192Leu | Ankyrin | 1 | 0 | 5 | 0 |
| 3 | c.664C>G | rs61735708 | p.Arg222Gly | Ankyrin | 2 | 1 | 10 | 3 |
| 3 | c.770G>A | p.Arg257His | Ankyrin | 0 | 0 | 1 | 0 | |
| 3 | c.839A>T | p.Gln280Leu | Ankyrin | 0 | 0 | 1 | 0 | |
| 3 | c.865C>T | rs104886480 | p.Arg289Cys | Ankyrin | 3 | 0 | 6 | 2 |
| 3 | c.913G>A | p.Ala305Thr | Ankyrin | 0 | 0 | 1 | 0 | |
| 3 | c.941C>T | rs104886481 | p.Thr314Met | Ankyrin | 0 | 1 | 1 | 0 |
| 3 | c.951C>G | p.His317Gln | Ankyrin | 1 | 0 | 0 | 0 | |
| 3 | c.1021C>T | p.His341Tyr | Ankyrin | 0 | 0 | 1 | 0 | |
| 3 | c.1034G>A | p.Arg345His | Ankyrin | 0 | 0 | 2 | 0 | |
| 4 | c.1069C>T | rs62489646 | p.Arg357Cys | ND | 23 | 9 | 23 | 19 |
| 4 | c.1159C>A | rs919533 | p.Pro387Thr | ND | 13 | 4 | 24 | 16 |
| 5 | c.1273A>G | rs104886487 | p.Ser425Gly | SOCS box | 1 | 0 | 0 | 0 |
| 5 | c.1312C>T | rs3800791 | p.Arg438Cys | SOCS box | 0 | 1 | 4 | 0 |
| Synonymous | ||||||||
| 1 | c.204G>A | rs104886469 | p.Pro68Pro | N-terminal | 0 | 0 | 1 | 2 |
| 1* | c.105T>G | p.Ser35Ser* | N-terminal* | 0 | 0 | 1 | 0 | |
| 1* | c.204C>G | p.Gly68Gly* | N-terminal* | 0 | 0 | 1 | 0 | |
| 1* | c.225G>A | p.Ala75Ala* | N-terminal* | 0 | 0 | 1 | 0 | |
| 3 | c.583C>A | p.Arg195Arg | Ankyrin | 0 | 0 | 1 | 0 | |
| 3 | c.669G>A | rs104886475 | p.Gly223Gly | Ankyrin | 0 | 0 | 2 | 0 |
| 3 | c.753C>T | rs61743170 | p.Ala251Ala | Ankyrin | 22 | 9 | 29 | 5 |
| 3 | c.765C>T | rs104886478 | p.Thr255Thr | Ankyrin | 0 | 0 | 1 | 0 |
| 3 | c.825G>C∼ | rs2253592 | p.Ala275Ala | Ankyrin | 88/31 | 39/12 | 460/134 | 215/33 |
| 3 | c.981C>T | rs61734407 | p.Leu327Leu | Ankyrin | 0 | 0 | 5 | 2 |
| 3 | c.1047G>T | p.Gly349Gly | ND | 0 | 0 | 1 | 0 | |
| 5 | c.1227G>A | p.Ser409Ser | SOCS box | 6 | 2 | 20 | 4 | |
ASB10 reference sequence is NM_080871.3 and NP_543147.2 (isoform 3); if marked by *, then it is NM_001142459.1 and NP_001135931.2 (isoform 1). ND, not determined.
aThe number in these columns represent heterozygotes except in the case where there are two numbers, then the first number is the number of heterozygotes and the second number represents the number of individuals homozygous for the minor allele.
Characterization of the non-synonymous variants
The detected non-synonymous amino acid changes are distributed over the entire ASB10 protein sequence (Fig. 3, Table 1). In silico function prediction of the effect of the amino acid change was performed for all of the variants except the nonsense change (p.Cys173X), which is predicted to result in a shortened protein product and the two common variants (rs62489646 and rs919533), as these are previously reported SNPs that had no significant differences in frequency between the cases and controls. Although ASB10 isoforms exhibit approximately equal number of positively and negatively charged amino acids, the identified mutations affect mainly basic residues, such as arginine and histidine. All variants were broadly classified into three categories: (1) those that affect both the charge and polarity of ASB10, (2) those that only change the polarity and (3) those that have no effect either on the charge or polarity. Twenty-one of the 28 changes (75%) alter the charge and/or polarity of ASB10 (Table 2). Sixteen of the 21 variants (76%) change the charge of the protein's and the majority of them (14 of 16) lead to the loss of positive net charge.
Figure 3.

ASB10 protein domain structure and location of non-synonymous variants identified in this study. Schematic representation of the protein domains highlighting the location of the 7 ankyrin-repeat domain (ANK) and the C-terminal SOCS box domain (SOCs). All amino acid changes identified in the patient cohorts are listed above; changes identified only in the control groups are listed below the structure.
Table 2.
Effect of non-synonymous amino acid changes on the biophysical properties of ASB10 protein and on structure stability
| Mutations | Loss of positive charge | Loss of negative charge | Charge unaffected, polarity affected | Charge and polarity unaffected | Functional effect | Patients (n = 1172) | Controls (n = 461) | Phenotype |
|---|---|---|---|---|---|---|---|---|
| Pro19Ser | X | Impaired | 6 | 0 | 6 POAG | |||
| Arg32Ser | XX | Impaired | 1 | 0 | 1 POAG | |||
| Arg39Gln | XX | Impaired | 1 | 0 | 1 POAG | |||
| Thr48Ser* | X | Non-impaired | 1 | 0 | 1 NTG | |||
| Gly65Glu* | X | Impaired | 1 | 0 | 1 POAG | |||
| Val67Met* | X | Non-impaired | 1 | 0 | 1 POAG | |||
| Arg72His* | X | Impaired | 10 | 1 | 1 JOAG, 5 NTG, 4 POAG | |||
| Asp88Val* | XX | Impaired | 1 | 1 | 1 POAG | |||
| Asp91Tyr* | XX | Impaired | 0 | 1 | ||||
| Arg94Gln* | XX | Impaired | 1 | 0 | 1 JOAG | |||
| Asp97Glu* | X | Non-impaired | 1 | 0 | 1 NTG | |||
| Ala157Val | X | Non-impaired | 0 | 1 | ||||
| Arg168Cys | XX | Impaired | 1 | 0 | 1 POAG | |||
| Arg174Trp | XX | Impaired | 3 | 1 | 3 POAG | |||
| Ala182Val | XS | Impaired | 1 | 0 | 1 POAG | |||
| Val192Leu | XS | Impaired | 7 | 0 | 4 POAG, 3 NTG | |||
| Arg222Gly | XX | Impaired | 12 | 4 | 5 POAG, 7 NTG | |||
| Arg257His | X | Impaired | 1 | 0 | 1 POAG | |||
| Gln280Leu | XS | Impaired | 1 | 0 | 1 NTG | |||
| Arg289Cys | XX | Impaired | 9 | 2 | 5 POAG, 4 NTG | |||
| Ala305Thr | XS | Impaired | 1 | 0 | 1 NTG | |||
| Thr314Met | X | Impaired | 1 | 1 | 1 NTG | |||
| His317Gln | X | Impaired | 1 | 0 | 1 POAG | |||
| His341Tyr | X | Impaired | 1 | 0 | 1 NTG | |||
| Arg345His | X | Impaired | 2 | 0 | 1 POAG, 1 NTG | |||
| Ser425Gly | X | Impaired | 1 | 0 | 1 POAG | |||
| Arg438Cys | XX | Impaired | 4 | 1 | 2 POAG, 2 NTG | |||
| Total | 70 | 13 | ||||||
| Impaired total | 67 | 12 |
Mutations that potentially lead to the loss of a positively or negatively charged residue are marked by ‘XX’ and are listed in the first and second columns, respectively. As histidine is only partially charged at physiological pH, mutations involving this residue are marked by a single ‘X’ to highlight the milder effect. The fourth column lists mutations that have no effect on either charge or polarity of ASB10. Mutations located in a region of known three-dimensional structure were evaluated for their effect on protein stability. Mutations which are predicted to significantly decrease the protein stability due to steric clashes (Fig. 5) are marked by a superscript ‘S’. ASB10 ref. seq. is NM_080871.3 and NP_543147.2 (isoform 3); if marked by *, then it is NM_001142459.1 and NP_001135931.2 (isoform 1). In this analysis, we excluded the nonsense change (p.Cys173X) and the two common variants (p.Arg357Cys and p.Pro387Thr).
To obtain insights into a possible structural role of these mutations, ankyrin repeats of ASB10 were modeled on the known crystal structure of human ankryinR. The basic residues of the ankyrin repeats, including many of the changed residues, are mainly located on the protein surface (Fig. 4B). Interestingly, most of these residues are not involved in the formation of salt bridges, suggesting that they are not key to stabilization of the ankyrin-fold itself. These residues may alter the isoelectric point of ASB10, thereby possibly affecting cellular localization or reducing protein solubility.
Figure 4.
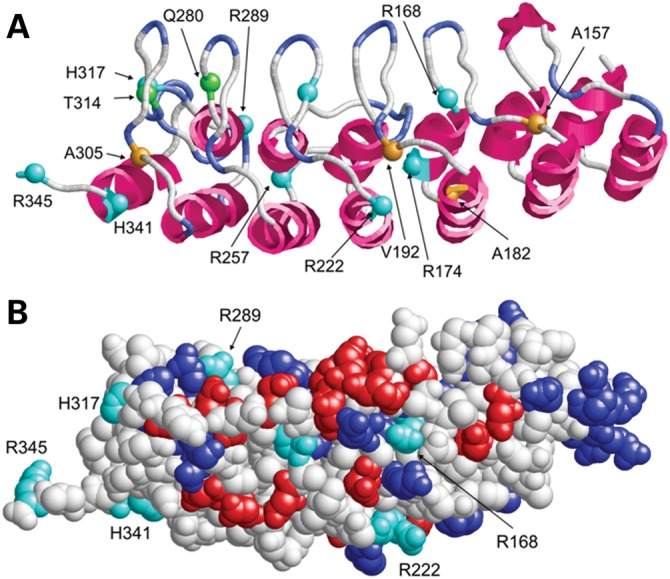
Structure (A) and surface presentation (B) of the ankyrin-repeat region of ASB10 (comprising residues 100–345 of isoform 3). The ASB10 ankyrin repeat was modeled on the crystal structure of human AnkR. (A) Sequence position, for which mutations were found, are shown as balls and are labeled. Charged, polar and non-polar sites of mutation are colored cyan, green and orange, respectively. (B) Acidic and basic residues are colored in red and blue, respectively. Basic residues, which were found to be mutated in POAG patients, are shown in cyan and labeled. Note that the latter group of basic residues does not form salt bridges with acidic residues, suggesting that they play only a minor role for protein stability.
The ankyrin repeat is one of the most common repeat motifs, folding into a helix–loop–helix structure with a β-hairpin/loop region projecting outward from the helices at 90° (Fig. 4A). The ankyrin-repeat motif is defined by its fold rather than its specific function. The inner face of the loops and anti-parallel helices of the clusters of ankyrin repeats usually form a specific protein-binding pocket (16). Many of the variants located in the ankyrin repeats are in the fold between the helices and loops (Fig. 4A). Potentially, these mutations could change the shape or binding residue positions within the concave L-shaped binding pocket.
Detailed molecular modeling of the ankyrin-repeat region was also carried out for several amino acid changes that did not affect the charge of the protein (Table 2). We hypothesized that these would affect protein folding and structure. Four amino acid changes (c.545C>T, p.Ala182Val; c.574G>C, p.Val192Leu; c.839A>T, p.Gln280Leu; and c.913G>A, p.Ala305Thr) clearly introduced bulkier side chains, which produced steric clashes and therefore are likely to decrease protein stability or significantly change protein conformation (Fig. 5A–D). The Asp91Tyr variant found in a control is located in a region that may adopt less-defined structure and may therefore more easily accommodate these amino acid changes. Ala157Val is located within the ankyrin-repeat region and a valine is present at this position in several homologous ankyrin-repeat proteins, thus may be in a region less sensitive to this difference.
Figure 5.
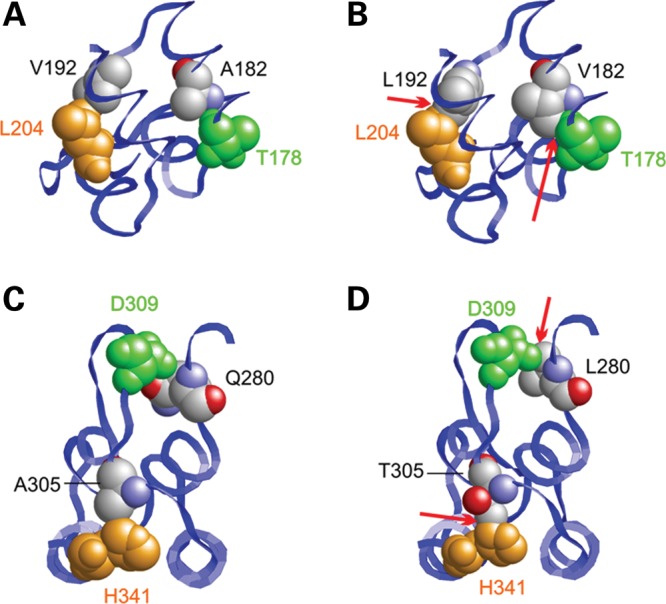
Mutations causing steric clashes in the ankyrin-repeat region. (A–D) Effect of the Ala182Val, Val192Leu, Gln280Leu and Ala305Thr mutations. In the wild-type (A), Ala182 and Val192 form tight interactions with Thr178 and Leu204, respectively. In the wild-type (C), Gln280 and Ala305 form tight interactions with Asp309 and His341, respectively. The longer side chains present in all mutants (B, D) lead to clashes with the neighboring residues (marked by red arrows) potentially resulting in decreased protein stability.
Taking into account only those variants affecting protein charge/polarity and probably protein conformation or stability, a total of 24 variants in 68 patients (including the nonsense mutation) (67 of 1172; 5.7%) and 8 variants in 12 healthy subjects (12 of 461; 2.6%) were observed (Table 2). This difference between patients and controls validates the ASB10 risk effect (P = 0.007, two-tailed Fisher's exact test; OR = 2.3, 95% CI = 1.2–4.3).
The frequency of the potentially detrimental mutations was similar between the phenotype groups, when accounting for the small number of JOAG patients analyzed: 6.2% in high-tension POAG, 5.2% in NTG and 3.8% in JOAG. These missense variants were almost equally distributed between patients with high IOP (6.0%, combined POAG and JOAG) and patients with normal IOP values (5.2%, NTG).
Localization of ASB10 in ocular tissues
To investigate the expression pattern of ASB10 in the human eye, we evaluated ASB10 mRNA profiles from several ocular tissues from normal donor eyes (n = 4). Quantitative real-time (qRT)-PCR showed good expression levels in most regions with the highest expression levels in the iris, moderate levels in the trabecular meshwork, the lamina and the optic nerve, slightly lower levels in the ciliary body, retina and choroid, and very low levels in the lens (Fig. 6).
Figure 6.

Quantitative determination of ASB10 mRNA expression levels in human ocular tissues using RT-PCR technology (n = 4). The expression levels were normalized against GAPDH and the results are expressed as copy number ASB10/GAPDH. Co, cornea; Trab, trabecular meshwork; Cil, ciliary body; Ret, retina; Chor, choroid; Lam, lamina cribrosa; Opt, opticus, n.d., not detected.
Immunohistochemical studies were performed to further characterize ASB10 protein localization. ASB10 protein was found in human TM cells, the outer TM beams and in the juxtacanalicular region. It was also present in the endothelial cells of the inner and outer walls of Schlemm's canal (Fig. 7A). A negative control using phosphate-buffered saline (PBS) instead of a primary antibody is shown for comparison (Fig. 7B). ASB10 protein was detected by western immunoblot of extracts of cultured primary human trabecular meshwork (HTM) cells (Fig. 7C). A band corresponding to full-length ASB10 protein (∼48 kDa) was detected in the cell lysate. The identities of the other bands are unknown at this time.
Figure 7.

Immunofluorescence of human TM tissue. (A) Human TM tissue showed ASB10 expression throughout the beams and in the juxtacanalicular region of the HTM. (B) A negative control using PBS instead of the primary antibody. SC, Schlemm's canal. (C) Western immunoblot analysis of ASB10 protein from cultured primary human TM cells. A band corresponding to the predicted size of full-length ASB10 was detected in RIPA cell lysates. All results shown are representative of HTM cells derived from three different individuals. Molecular weight markers are shown (kDa). Scale bar, 20 μm. DAPI labeled nuclei (blue).
In the ciliary body, ASB10 was mainly observed in the cytoplasm and perinuclear region of pigmented ciliary epithelial cells covering the ciliary processes, with minimal expression in non-pigmented epithelial cells (Fig. 8A and B). In the retina, ASB10 was localized to retinal ganglion cells and individual neurons in the inner nuclear layer, where it revealed a distinct nuclear expression pattern. Photoreceptor cell nuclei in the outer nuclear layer were largely negative, but a pronounced fluorescence was observed at the level of the outer limiting membrane between photoreceptor cell bodies and inner segments (Fig. 8C and D). Antibody binding was abolished when an irrelevant antibody or PBS was used instead of the primary antibody (similar to that shown in Fig. 7B).
Figure 8.

Immunofluorescence of ASB10 protein in ciliary processes (A, B) and retina (C, D) of a normal human donor eye (age, 63 years). (A, B) Positive ASB10 immunostaining (green) is seen in the cytoplasm and perinuclear region of the pigmented ciliary epithelial layer. (C, D) Positive ASB10 immunostaining (green) can be localized to the nuclei (red) of retinal ganglion cells, individual neurons in the inner nuclear layer and to the outer limiting membrane. Smaller cell nuclei, probably belonging to retinal astrocytes, are negative (D′, arrow) (BV, blood vessel; CE, ciliary epithelium; CS, ciliary stroma; INL, inner nuclear layer; NFL, nerve fiber layer; NPE, non-pigmented ciliary epithelium; OLM, outer limiting membrane; ONL, outer nuclear layer; PC, posterior chamber; PE, pigmented ciliary epithelium; RGL, retinal ganglion cell layer; magnification: (A, C) ×100 in and (B, D) ×250.
Effect of ASB10 silencing on outflow facility
In order to test whether ASB10 affected aqueous humor outflow facility, the control point for IOP regulation, we used RNAi silencing to knockdown expression of ASB10 mRNA in human anterior segment perfusion culture. ASB10 short, hairpin RNA (shRNA)-containing lentivirus was generated and shown to knockdown ASB10 gene expression in cultured HTM cells by ∼50% as quantified by qRT-PCR (Fig. 9B). Immunofluorescence showed that ASB10 protein was highly reduced in ASB10 shRNA-containing lentivirus-infected HTM cells compared with control lentivirus-infected cells or a mock infection negative control (Fig. 9A). Western blot analysis and densitometry showed a ∼40% reduction of ASB10 protein in cell lysates of shASB10-infected TM cells (Fig. 9C). When shASB10 lentivirus was applied to human eyes in perfusion culture, outflow facility was reduced by ∼50% by 48 h, when compared with control shRNA lentivirus (Fig. 10A). qRT-PCR of tissue extracts after outflow experiments show that ASB10 mRNA levels were significantly reduced ∼95% in shASB10-infected TM (n = 5) when compared with control shRNA-infected TM (n = 3; Fig. 10B). Finally, ASB10 immunostaining was performed on shASB10-infected eyes post-silencing. In control shRNA-infected TM (Fig. 10C), ASB10 (red) was found associated with TM cells and throughout the TM, in a pattern similar to the normal uninfected TM shown in Figure 7A. However, in shASB10-silenced eyes, there was a dramatic reduction in the amount of ASB10 immunostaining. Fibronectin was used as a counter-stain (green) in both images. There is some co-localization (yellow) of fibronectin and ASB10, which suggests a portion of ASB10 may be extracellular. Gross morphology of the TM was not obviously altered in hematoxylin and eosin-stained sections (not shown).
Figure 9.

ASB10 gene knockdown by shRNA lentivirus. (A) Immunofluorescence of HTM cells mock-infected (left) or infected with control shRNA lentivirus (center) or shASB10 lentivirus (right) using an ASB10 polyclonal antibody. DAPI stains the nucleus (blue). Inset shows a negative control with PBS instead of primary antibody. Scale bars, 20 µm. (B) qRT-PCR analysis of HTM cells infected with 106 pfus of shASB10 or control shRNA lentivirus. (C) Western analysis of ASB10 protein knockdown in HTM cells using the polyclonal antibody. HTM cells were infected with 106 pfus of shASB10 or control shRNA lentivirus for 6 days. Molecular weight markers are shown (kDa).
Figure 10.

Effects of shASB10 on outflow facility in human anterior segment perfusion culture. (A) shASB10 or control shRNA lentivirus was applied to human anterior segments in perfusion culture at time point 0. The number of replicates is shown. Error bars represent the standard error of the mean. Outflow facility was measured for a further 5 days. *P = 0.002 flow rates just prior to application versus at 120 h as determined by a paired Student's t-test. **P = 0.01 control shRNA versus shASB10 by an unpaired Student's t-test. (B) qRT-PCR of ASB10 mRNA levels in TM tissue extracts after outflow experiments. ASB10 mRNA levels were reduced ∼95% in shASB10-infected TM (n = 5) when compared with control-infected TM (n = 3). *P = 0.02 as determined by an unpaired Students's t-test. (C, D) ASB10 immunostaining (red) of tissue post-silencing of control (C) and shASB10-infected (D) TM. Fibronectin (green) was used as a counter-stain in both images. Note that the confocal settings were identical for each image and the images were representative of five shASB10-infected eyes and three controls. DAPI was used to stain the nuclei blue. Scale bars, 20 µm.
DISCUSSION
We present genetic and molecular evidence to support the conclusion that ASB10 is the GLC1F POAG gene. ASB10 is a member of the ankyrin repeats and SOCS box-containing protein family, which contains at least 18 proteins (ASB1–ASB18) (17). In all 18 members, two common functional domains have been identified by in silico analysis: the ankyrin-repeat region, that is often involved in specific protein–protein interactions (18) and an SOCS box region, which can serve as a generic adapter directing the degradation of proteins targeted by the ankyrin-repeat region (19). ASB10 is predicted to contain seven ankyrin repeats and a C-terminal SOCS box; no other identifiable domains are present (Fig. 3) (20). The ASB10 gene contains six exons; the ankyrin repeats are encoded by exons 2 and 3, whereas exon 5 encodes the SOCS box domain. According to the US National Center for Biotechnology Information (NCBI) database, ASB10 undergoes alternative mRNA splicing to form three different transcripts. Isoform 1 (NM_001142459.1) is the longest, isoform 2 (NM_001142460.1) lacks exon 4, and isoform 3 (NM_080871.3) uses an alternate 5′ exon and encodes a unique, shorter N terminus. Kile et al. (20) showed that, in ASB1-deficient mice, ASB10 mRNA is expressed in heart and skeletal muscle. No other papers on ASB10 expression or function are apparent in the literature. Both the interacting protein(s) and the function of ASB10 have yet to be elucidated.
After identification of the synonymous mutation, c.765C>T (p.Thr255Thr), which segregates in the GLC1F family, we examined the complete coding regions of ASB10 in order to identify potential mutations in two replicate POAG populations of European origin, one from Oregon and the other from Germany. We identified several different amino acid changes in ASB10 in almost 6% of cases. Analysis of the biophysical properties of these missense variants showed that the majority of them (Table 2) change the charge of the ASB10 protein. Although the exact physiological role of these variants still need to be clarified, we can speculate that the loss of positive charge and the resulting lowering of the isoelectric point might affect the cellular localization or protein solubility. These mutations are also positioned such that they would likely change the shape of the ASB10 ankyrin-repeat binding pocket. Molecular modeling of the four missense variants that do not change the charge of the ASB10 protein (c.545C>T, p.Ala182Val; c.574G>C, p.Val192Leu; c.839A>T, p.Gln280Leu; and c.913G>A, p.Ala305Thr) revealed that they could destabilize the ankyrin-repeat domain, thus affecting protein stability. The truncated ASB10 alternatively spliced form generated by the c.765C>T (p.Thr255Thr) mutant or the nonsense stop-codon mutant c.519C>A (p.Cys173X) would remove several ankyrin repeats and the SOCS box, likely changing the binding pocket and other functions. Reduction in protein stability is also a possible consequence of some of the mutations.
To determine the putative effect of a decreased amount of ASB10 protein, we used lentivirus to deliver a silencing vector (shASB10) into the TM in anterior segment perfusion culture. Silencing of ASB10 expression in human anterior segment resulted in a reduction in outflow facility by ∼50%. TGF-β2 treatment, which is elevated in the aqueous humor of POAG patients (21), results in a similar decrease in outflow facility with the consequent increase in IOP (22–24). Thus, reduction of ASB10 expression in the TM impacts outflow facility, the primary regulator of IOP, which is typically increased in POAG patients.
Taking into account also the specific expression pattern of ASB10 in retinal ganglion cells, one could hypothesize a dual role of this protein in the pathogenesis of glaucoma. Impaired ASB10 may affect the trabecular meshwork outflow in the anterior segment and lead to retinal ganglion cell degeneration in the retina. Further studies will be required to delineate the specific function of ASB10 and the molecular mechanisms that lead to glaucoma.
In conclusion, we present evidence supporting the idea that the GLC1F gene is ASB10. These results represent the first molecular analysis of the ASB10 gene including both protein and mRNA expression in ocular tissues and demonstration of a role in IOP regulation.
MATERIALS AND METHODS
Ethics approval and consent
Human subjects
Ethics approval was obtained from the Oregon Health & Science University (OHSU) Institutional Review Board (Portland, OR, USA), the Kaiser Permanente Northwest Center for Health Research Institutional Review Board (Portland, OR, USA) and from the ethics review boards of the Medical Faculties of the University of Erlangen-Nuremberg, Würzburg and Tübingen (Germany). This study was conducted in accordance with the tenets of the Declaration of Helsinki. Informed consent was obtained from all participants.
Donor tissue
Informed consent to tissue donation was obtained from the donors or their relatives, and the protocol of the study was approved by the local ethics committee and adhered to the tenets of the Declaration of Helsinki for experiments involving human tissue.
Study populations
All patients and controls were of non-Hispanic European ancestry.
Oregon cohort
We recruited 140 POAG subjects from Kaiser Permanente Northwest (Portland, OR, USA) and 55 from Casey Eye Institute, OHSU (Portland, OR, USA). The age of the patients ranged from 34 to 93 with a mean age of 72.5 ± 11.5 years; 60% were females and 43% had a family history of glaucoma. Eighty-five control subjects were recruited at the Casey Eye Institute in Portland, OR, USA; 62% were females. The age of the control subjects ranged from 50 to 85 with a mean age of 70 ± 10.3 years. All control subjects had been examined by an ophthalmologist (J.R.S.) to determine that they had no signs of glaucoma as described including IOP' (<21 mmHg).
German cohort
The second group studied included patients and control subjects of German (European) origins. The group of patients consisted of 977 subjects: 440 had high-tension POAG (IOP > 21 mmHg), 52 had a JOAG and 485 were NTG. The 376 control subjects were recruited from the same geographic region as the patients. All individuals underwent standardized clinical examinations for glaucoma at the University Eye Hospital in Erlangen, Tübingen and Würzburg.
Altogether, the age of patients ranged from 14 to 96 with a mean age of 66.5 ± 14.1 years, 61% were females and 37% had a family history of glaucoma. The age of control subjects ranged from 34 to 97 with a mean age of 72.1 ± 6.9 years; 59.8% were females. IOP ranged from 11 to 65 mmHg with a mean of 28.3 ± 9.3 in patients with high-pressure POAG. In controls and NTG patients, IOP was <21 mmHg with a mean of 19.2 ± 2.1.
Clinical examination
Clinical examination and diagnosis of the Oregon and German patients have been documented previously (11,14,25–28). In brief, primary POAG was clinically defined as an optic neuropathy with the following findings: optic nerve head excavation with thinning of the neuroretinal rim, often with ‘Drance’-type nerve fiber layer hemorrhages, notching, pitting, significant focal loss or general loss of retinal fiber layer, and visual field defects consistent with the disc changes (28). POAG cases were enrolled in the study if they met one or more of the following criteria: (1) treatment for POAG had been instigated prior to our study and had been examined to confirm that they have POAG; (2) two or more of the following findings were present: (a) optic nerve head and/or nerve fiber layer analysis was compatible with moderately advanced glaucomatous damage (i.e. a vertical cup/disk ratio >0.7 with or without erosion of the rim) (29); (b) abnormal Humphrey glaucoma hemifield test; (c) untreated IOP of 24 mmHg measured by Goldman applanation tonometry (30); (3) glaucomatous field defects on Humphrey perimetry. Glaucoma cases secondary to trauma or anterior segment dysgenesis were excluded. Exclusion criteria for secondary OAG included exfoliation glaucoma, trauma, uveitis or steroid-induced glaucoma.
IOP was measured using a recently calibrated Goldmann applanation tonometer. A combined anesthetic and fluorescein product was applied before determining IOP. Optic disc appearance was classified at the time of examination using a slit-lamp biomicroscope with pupil dilation. After dilation, the sizes of the cups were evaluated using the standard method of a reference spot from a direct ophthalmoscope or using a 78-diopter lens.
PCR and sequencing
Screening of the cases and controls was identical. Primers were designed to amplify each exon with surrounding intronic sequence in order to cover all coding sequences, 5′ and 3′ untranslated regions and mRNA splice regulatory signals. Primers were designed using Primer3 through the UCSC Human Genome Browser ExonPrimer command (http://genome.ucsc.edu/cgi-bin/hgGateway). Primers were obtained from Integrated DNA Technologies, Inc. (San Diego, CA, USA).
Genomic DNA was obtained from human blood by a standard salting-out procedure (31) and with automated techniques (AutoGenFlex 3000; Autogen, Holliston, MA, USA) using DNA chemistry (Flexigene; Qiagen, Hilden, Germany). PCR reagents and FastStart® Taq Polymerase were obtained from Roche Applied Science Division (Indianapolis, IN, USA), and REDTaq® Polymerase from Sigma-Aldrich (St. Louis, MO, USA). PCR was performed on genomic DNA according to standard touchdown protocols on a Gene Amp PCR System 9700s (Applied Biosystems, Inc., Foster City, CA, USA). PCR products were purified using ExoSAP-IT® according to the manufacturer's instructions (USB Corporation, Cleveland, OH, USA) with AMPure Agencourt on a Biomek NX96 platform (BeckmanCoulter, Fullerton, CA, USA). All PCR products were separated by agarose gel electrophoresis. Purified products were sequenced on an ABI 3130XL Genetic Analyzer at the Oregon Clinical and Translational Research Institute (OCTRI), on an ABI Prism 377 DNA Sequencer at the Portland Veterans Administration Medical Center core facility, or by Amplicon Express (Pullman, WA, USA) and on an ABI 3730 Sequence Analyzer at the Human Genetics Institute in Erlangen (Germany). Sequencing chromatograms were analyzed using Sequencher® 4.9 and 4.10.1 (Gene Codes Corporation, Ann Arbor, MI, USA).
The identified ASB10 DNA variants were submitted to the Human Variation with Clinical Impact site at NCBI. The rs numbers, which were subsequently assigned, are used as reference numbers in Table 1.
Statistical analysis
We used standard χ2 or Fisher's exact tests to assess differences in allele frequencies between cases and controls for identified genetic variants. Paired Student's t-test was used for flow analysis and unpaired Student's t-test was used for comparison of expression of shRNA to shASB10.
Computational methods
The tools SMART (32) and GlobPlot (33) were used to detect globular domains and disordered regions in ASB10. The amino acid composition and ratio of charged residues for different ASB10 isoforms were calculated with ProtParam (34). Modeling of the ankyrin-repeat region of ASB10 was performed with Modeller 6.2 (35) using the crystal structure of human ankyrinR (PDB code 1n11) (36) as the template. Minimization of the structure and modeling of the mutations were done with Sybyl7.3 (Tripos, Inc., St. Louis, MO, USA). Figures were prepared using RasMol (37).
ASB10 expression analysis on eye tissues
For qRT-PCR, ocular tissues were obtained from four human donor eyes (age: 81.2 ± 4.5 years, two females, two males) without any known ocular disease. These eyes were obtained at autopsy and were processed within 8 h after death.
Total RNA was extracted from various ocular tissues using the RNeasy Kit (Qiagen, Hilden, Germany), which included an on-column DNase I digestion step. Single-strand cDNA synthesis was performed using 0.1 µg of total RNA, 200 U Superscript II reverse transcriptase (Invitrogen, Karlsruhe, Germany) and 500 ng oligo-dT primers (Roche Diagnostics, Mannheim, Germany) in 20 µl of reaction volume.
qRT-PCR was performed using the MyIQ thermal cycler and software (Biorad, Munich, Germany). All samples were analyzed in duplicates. Primers (Eurofins, Anzing, Germany) for ASB10 and GAPDH (Supplementary Material, Table S1) were designed in the last exon to detect all ASB10 splice variants by means of Primer 3 software. For quantification, serially diluted standard curves of plasmid-cloned cDNA were run in parallel, and amplification specificity was checked using melt curve and sequence analyses using the Prism 3100 DNA-sequencer (Applied Biosystems, Foster City, CA, USA). For normalization of gene expression levels, mRNA ratios were expressed relative to the GAPDH house-keeping gene.
Immunostaining
Immunohistochemistry was performed on normal human donor eyes (age range, 49–80 years).
Trabecular meshwork tissue
Paraffin-embedded sections
Anterior segments from normal donor eyes were fixed in 10% neutral-buffered formalin and embedded in paraffin. Serial 5 μm radial sections were cut approximately perpendicular to Schlemm's canal (OHSU Knight Cancer Institute, Portland, OR, USA). Sections were then deparaffinized, rehydrated, blocked with the CAS block and immunostained with a rabbit polyclonal primary antibody to ASB10 (Sigma, St. Louis, MO, USA) and a 594 nm Alexa Fluor-conjugated donkey anti-rabbit secondary antibody (Invitrogen, Carlsbad, CA, USA) (38). Some sections were also immunostained with mouse anti-fibronectin (BD Transduction Laboratories, San Jose, CA, USA) and 488 nm Alexa Fluor-conjugated donkey anti-mouse secondary antibody (Invitrogen). Sections were imaged using a laser scanning confocal microscope (FV1000; Olympus, San Diego, CA, USA).
Retina and ciliary body tissue
Ocular tissues were embedded in optimal cutting temperature compound and frozen in liquid nitrogen-cooled isopentane. Cryostat-cut sections (6 µm) were fixed in cold acetone, blocked with 10% normal goat serum and incubated in primary antibody (anti-ASB10, rabbit, affinity isolated; Sigma-Aldrich) diluted 1:250 in PBS overnight at 4°C. Antibody binding was detected by Alexa 488-conjugated secondary antibody (Invitrogen) and nuclear counterstaining was performed with propidium iodide (Sigma-Aldrich). In negative control samples, the primary antibody was replaced by PBS or equimolar concentrations of an irrelevant primary rabbit antibody. Sections were analyzed by standard epifluorescence (BX51, Olympus Optical Co., Hamburg, Germany).
Western immunoblot
Primary HTM cells isolated from donor tissue were grown to confluence in medium-glucose Dulbecco's modified Eagles medium (DMEM) containing 10% fetal bovine serum and 1% penicillin–streptomycin–fungizone (39–42). Lymphoblasts from the Oregon GLC1F family were cultured as below. For HTM cells, media was exchanged to 5 ml of serum-free DMEM for 72 h and cells were extracted with 0.5 ml of radioimmunoprecipitation assay (RIPA) buffer [25 mm Tris–HCl, pH 7.2, 150 mm NaCl, 1% NP-40, 1% sodium deoxycholate and 0.1% sodium dodecyl sulfate (SDS)] containing protease inhibitor cocktail (Sigma-Aldrich). Lymphoblasts were pelleted, washed with PBS and extracted with 0.1 ml of RIPA buffer. Protein concentration was determined with the BCA Protein Assay Kit (Pierce, Rockford, IL, USA). Proteins in RIPA cell lysates (30 μl) were separated on 10% SDS–polyacrylamide Ready gels (BioRad Laboratories, Hercules, CA, USA) under reduction conditions. After transfer to nitrocellulose, western blots were blocked with Odyssey blocking buffer (Li-Cor Biosciences, Lincoln, NE, USA), probed with a monoclonal ASB10 primary antibody that recognizes the V1 isoform (Abcam, Cambridge, MA, USA) and detected using an IRDye800 goat anti-mouse secondary antibody (Li-Cor Biosciences). Membranes were scanned on an Odyssey Infrared imaging system with Odyssey 2.0 software.
Identification of exon splicing enhancer sites
An online bioinformatics tool, ESE Finder, was used to predict ESE sites surrounding the T255T sequence. SR proteins bind to ESE consensus motifs and promote exon definition by recruiting spliceosomal components (43). The following threshold values were used: 1.956 for SF2/ASF, 1.867 for SF2/ASF (IgM-BRCA-1), 2.383 for SC35, 2.67 for SRp40 and 2.676 for SRp55. A score is considered high when these threshold values are exceeded, which indicates a potentially significant ESE (15).
Lymphoblast culture, RNA isolation and cDNA transcription
Transformed lymphoblasts were prepared from blood samples from GLC1F family members by the Oregon Clinical and Translational Research Institute at OHSU, Portland, OR, USA. The immortalized lymphoblasts were grown to confluence in a T75 flask in RPMI 1640 medium supplemented with Glutamax 1, 25 mm HEPES (Invitrogen, Carlsbad, CA, USA) and 10 000 μg/ml Streptomycin. Total RNA was isolated from confluent cells using TRIzol reagent (Invitrogen) according to the manufacturer's instructions. To ensure removal of genomic DNA, RNA samples were treated with the DNA-free treatment kit (Ambion, Carlsbad, CA, USA). RNA quality and quantity was assessed spectrophotometrically. cDNA was reverse-transcribed from total RNA (∼1 μg) in 20 μl of reaction volume using Superscript III reverse transcriptase (Invitrogen) (44,45). Standard RT-PCR was performed using primers in exons 2 (5′-ATACGAAGAGGAGCTGACCACCC-3′) and 4 (5′-TGCAGAGTTTCAGGAGTCACCA-3′). Products were separated by agarose gel electrophoresis.
Generation of ASB10 shRNA silencing lentivirus
We generated shRNA vectors in order to silence the ASB10 gene as described previously (46). Briefly, shRNAs were designed using the online BLOCK-iT RNAi designer (Invitrogen). The sequence of the ASB10 shRNA was 5′-CACCGACTCTGGTCTCTGACATACGCGAACGTATGTCAGAGACCAGAGTC-3′, which targets sequence in exon 2. An shRNA control was also designed (5′-CACCCATCACTCCATGTTGGAACTTCGAAAAGTTCCAACATGGAGTGATG-3′) that did not target any other known human gene when blasted against the NCBI database. Double-stranded 21 nucleotide shRNA oligonucleotides were annealed and cloned into the pENTR/U6 vector using T4 ligase (Invitrogen). After the correct sequence was confirmed by DNA sequencing, the shRNA cassette was transferred into the pLenti6/BLOCK-iT-DEST vector (HIV-based lentiviral vector) by recombination using the Gateway LR clonase II enzyme (Invitrogen) and purified using the Endo-free Plasmid Maxiprep Kit (Qiagen).
To generate replication-incompetent lentivirus, 3 µg of pLenti ASB10 silencing plasmid was co-transfected into the 293FT cell line with 9 µg of ViraPower packaging mix using Lipofectamine 2000 (Invitrogen). Lentivirus-containing supernatants were harvested 72 h post-transfection centrifuged to pellet cell debris and stored at −80°C until use.
Viral titers were determined by adding various dilutions of lentivirus (ranging from 10−2 to 10−6 in DMEM with 10% fetal calf serum, or a mock infection) to HT1080 cells (ATCC, Manassas, VA, USA) in culture with 6 µg/ml Polybrene (Sigma). Following blasticidin (1 µg/ml) selection for 7 days, the number of crystal violet-stained plaques was counted for each lentiviral dilution to determine plaque formation units (pfus).
Verification of gene knockdown and reduction of ASB10 protein by immunofluorescence
Primary TM cells were infected with 106 pfus of shASB10 or control shRNA lentivirus. After 72 h, total RNA was isolated using cells-to-cDNA lysis buffer (Ambion) and cDNA was generated using Superscript III reverse transcription. qRT-PCR was performed as described previously (44). Results were expressed as fold change relative to control shRNA-infected HTM cells.
Primary HTM cells were cultured on collagen I-coated BioFlex membranes (Flexcell International Corp., Hillsborough, NC, USA). shASB10 or control shRNA lentivirus (106 pfus) was added to the cells for 4 days, and immunofluorescence was performed using a rabbit anti-ASB10 polyclonal antibody (Sigma) and an Alexa Fluor 594-conjugated secondary antibody. Coverslips were mounted in ProLong gold mounting medium containing the nuclear stain 4′,6-diamidino-2-phenylindole (DAPI). Immunofluorescence images were obtained using a laser scanning confocal microscope (Olympus Fluoview, Westmont, IL, USA). Western blots were performed on shASB10 and control-infected HTM cells. Cells were infected for 3 days and serum-free medium was added for 72 h. ASB10 in control and silenced TM cells was evaluated with the polyclonal ASB10 antibody (Sigma). Densitometry was used to quantitate each band, which was normalized to total protein in the RIPA extracts.
Lentiviral infection of perfused anterior segments
Human anterior segments were perfused with serum-free DMEM at a constant pressure (8.8 mmHg) until flow rates stabilized at an average flow rate of 1–7 µl/min (38,46,47). Lentivirus (108 pfus) was applied to the perfusion chambers by media exchange (indicated by time point 0) and outflow facility was measured for a further 5–7 days. Change in outflow facility was determined by normalizing the average outflow rate prior to treatment, and data from individual eyes were then combined. The number of eyes used for each treatment is noted in the figure legend. A paired Student's t-test was used to determine the significance comparing flow rates immediately prior to treatment with those at the end of the experiment or an unpaired t-test to compare control and shASB10-infected eyes. P < 0.05 was considered significant. Following the experiment, TM tissue was dissected from the anterior segment, homogenized with Trizol reagent and qRT-PCR was performed.
SUPPLEMENTARY MATERIAL
FUNDING
This work was supported by the National Institutes of Health Grants (EY010555, EY011650, EY010572, EY019643, EY003279, EY008247, MH059490), Grant SFB 539 from the German Research Foundation and UL1 R024140, and an unrestricted grant from Research to Prevent Blindness to the Casey Eye Institute. There are no commercial relationships.
ACKNOWLEDGEMENTS
We thank Genevieve J. Long, PhD, for her assistance in editing and Gail Marousek at the Portland Veterans Administration Medical Center Core DNA Sequencing Facility, N. Donna Gaudette, Renee Sykes, Shawn Westaway, PhD, and Olga Zwenger for their assistance in sequencing. The authors thank Ruth Phinney at Oregon Lions Eye Bank for coordinating human eye procurement.
Conflict of Interest statement. None declared.
REFERENCES
- 1.Quigley H.A. Glaucoma. Lancet. 2011;377:1367–1377. doi: 10.1016/S0140-6736(10)61423-7. doi:10.1016/S0140-6736(10)61423-7. [DOI] [PubMed] [Google Scholar]
- 2.Drance S.M., Sweeney V.P., Morgan R.W., Feldman F. Studies of factors involved in the production of low tension glaucoma. Arch. Ophthalmol. 1973;89:457–465. doi: 10.1001/archopht.1973.01000040459003. doi:10.1001/archopht.1973.01000040459003. [DOI] [PubMed] [Google Scholar]
- 3.Goldwyn R., Waltman S.R., Becker B. Primary open-angle glaucoma in adolescents and young adults. Arch. Ophthalmol. 1970;84:579–582. doi: 10.1001/archopht.1970.00990040581004. doi:10.1001/archopht.1970.00990040581004. [DOI] [PubMed] [Google Scholar]
- 4.Allingham R.R., Liu Y., Rhee D.J. The genetics of primary open-angle glaucoma: a review. Exp. Eye Res. 2009;88:837–844. doi: 10.1016/j.exer.2008.11.003. doi:10.1016/j.exer.2008.11.003. [DOI] [PMC free article] [PubMed] [Google Scholar]
- 5.Fingert J.H., Robin A.L., Stone J.L., Roos B.R., Davis L.K., Scheetz T.E., Bennett S.R., Wassink T.H., Kwon Y.H., Alward W.L., et al. Copy number variations on chromosome 12q14 in patients with normal tension glaucoma. Hum. Mol. Genet. 2011;20:2482–2494. doi: 10.1093/hmg/ddr123. doi:10.1093/hmg/ddr123. [DOI] [PMC free article] [PubMed] [Google Scholar]
- 6.Monemi S., Spaeth G., DaSilva A., Popinchalk S., Ilitchev E., Liebmann J., Ritch R., Heon E., Crick R.P., Child A., et al. Identification of a novel adult-onset primary open-angle glaucoma (POAG) gene on 5q22.1. Hum. Mol. Genet. 2005;14:725–733. doi: 10.1093/hmg/ddi068. doi:10.1093/hmg/ddi068. [DOI] [PubMed] [Google Scholar]
- 7.Rezaie T., Child A., Hitchings R., Brice G., Miller L., Coca-Prados M., Heon E., Krupin T., Ritch R., Kreutzer D., et al. Adult-onset primary open-angle glaucoma caused by mutations in optineurin. Science. 2002;295:1077–1079. doi: 10.1126/science.1066901. doi:10.1126/science.1066901. [DOI] [PubMed] [Google Scholar]
- 8.Stone E.M., Fingert J.H., Alward W.L., Nguyen T.D., Polansky J.R., Sunden S.L., Nishimura D., Clark A.F., Nystuen A., Nichols B.E., et al. Identification of a gene that causes primary open angle glaucoma. Science. 1997;275:668–670. doi: 10.1126/science.275.5300.668. doi:10.1126/science.275.5300.668. [DOI] [PubMed] [Google Scholar]
- 9.Fuse N. Genetic bases for glaucoma. Tohoku J. Exp. Med. 2010;221:1–10. doi: 10.1620/tjem.221.1. doi:10.1620/tjem.221.1. [DOI] [PubMed] [Google Scholar]
- 10.Pasutto F., Chavarria-Soley G., Mardin C.Y., Michels-Rautenstrauss K., Ingelman-Sundberg M., Fernandez-Martinez L., Weber B.H., Rautenstrauss B., Reis A. Heterozygous loss-of-function variants in CYP1B1 predispose to primary open-angle glaucoma. Invest. Ophthalmol. Vis. Sci. 2010;51:249–254. doi: 10.1167/iovs.09-3880. doi:10.1167/iovs.09-3880. [DOI] [PubMed] [Google Scholar]
- 11.Pasutto F., Matsumoto T., Mardin C.Y., Sticht H., Brandstatter J.H., Michels-Rautenstrauss K., Weisschuh N., Gramer E., Ramdas W.D., van Koolwijk L.M., et al. Heterozygous NTF4 mutations impairing neurotrophin-4 signaling in patients with primary open-angle glaucoma. Am. J. Hum. Genet. 2009;85:447–456. doi: 10.1016/j.ajhg.2009.08.016. doi:10.1016/j.ajhg.2009.08.016. [DOI] [PMC free article] [PubMed] [Google Scholar]
- 12.Burdon K.P., Macgregor S., Hewitt A.W., Sharma S., Chidlow G., Mills R.A., Danoy P., Casson R., Viswanathan A.C., Liu J.Z., et al. Genome-wide association study identifies susceptibility loci for open angle glaucoma at TMCO1 and CDKN2B-AS1. Nat. Genet. 2011;43:574–578. doi: 10.1038/ng.824. doi:10.1038/ng.824. [DOI] [PubMed] [Google Scholar]
- 13.Thorleifsson G., Walters G.B., Hewitt A.W., Masson G., Helgason A., DeWan A., Sigurdsson A., Jonasdottir A., Gudjonsson S.A., Magnusson K.P., et al. Common variants near CAV1 and CAV2 are associated with primary open-angle glaucoma. Nat. Genet. 2010;42:906–909. doi: 10.1038/ng.661. doi:10.1038/ng.661. [DOI] [PMC free article] [PubMed] [Google Scholar]
- 14.Wirtz M.K., Samples J.R., Rust K., Lie J., Nordling L., Schilling K., Acott T.S., Kramer P.L. GLC1F, a new primary open-angle glaucoma locus, maps to 7q35-q36. Arch. Ophthalmol. 1999;117:237–241. doi: 10.1001/archopht.117.2.237. [DOI] [PubMed] [Google Scholar]
- 15.Cartegni L., Wang J., Zhu Z., Zhang M.Q., Krainer A.R. ESEfinder: a web resource to identify exonic splicing enhancers. Nucleic Acids Res. 2003;31:3568–3571. doi: 10.1093/nar/gkg616. doi:10.1093/nar/gkg616. [DOI] [PMC free article] [PubMed] [Google Scholar]
- 16.Mosavi L.K., Minor D.L., Jr, Peng Z.Y. Consensus-derived structural determinants of the ankyrin repeat motif. Proc. Natl Acad. Sci. USA. 2002;99:16029–16034. doi: 10.1073/pnas.252537899. doi:10.1073/pnas.252537899. [DOI] [PMC free article] [PubMed] [Google Scholar]
- 17.Li J.Y., Chai B.X., Zhang W., Liu Y.Q., Ammori J.B., Mulholland M.W. Ankyrin repeat and SOCS box containing protein 4 (Asb-4) interacts with GPS1 (CSN1) and inhibits c-Jun NH2-terminal kinase activity. Cell Signal. 2007;19:1185–1192. doi: 10.1016/j.cellsig.2006.12.010. doi:10.1016/j.cellsig.2006.12.010. [DOI] [PMC free article] [PubMed] [Google Scholar]
- 18.Sedgwick S.G., Smerdon S.J. The ankyrin repeat: a diversity of interactions on a common structural framework. Trends Biochem. Sci. 1999;24:311–316. doi: 10.1016/s0968-0004(99)01426-7. doi:10.1016/S0968-0004(99)01426-7. [DOI] [PubMed] [Google Scholar]
- 19.Piessevaux J., Lavens D., Peelman F., Tavernier J. The many faces of the SOCS box. Cytokine Growth Factor Rev. 2008;19:371–381. doi: 10.1016/j.cytogfr.2008.08.006. doi:10.1016/j.cytogfr.2008.08.006. [DOI] [PubMed] [Google Scholar]
- 20.Kile B.T., Metcalf D., Mifsud S., DiRago L., Nicola N.A., Hilton D.J., Alexander W.S. Functional analysis of Asb-1 using genetic modification in mice. Mol. Cell. Biol. 2001;21:6189–6197. doi: 10.1128/MCB.21.18.6189-6197.2001. doi:10.1128/MCB.21.18.6189-6197.2001. [DOI] [PMC free article] [PubMed] [Google Scholar]
- 21.Tripathi R.C., Li J., Chan W.F., Tripathi B.J. Aqueous humor in glaucomatous eyes contains an increased level of TGF-beta 2. Exp. Eye Res. 1994;59:723–727. doi: 10.1006/exer.1994.1158. doi:10.1006/exer.1994.1158. [DOI] [PubMed] [Google Scholar]
- 22.Bachmann B., Birke M., Kook D., Eichhorn M., Lutjen-Drecoll E. Ultrastructural and biochemical evaluation of the porcine anterior chamber perfusion model. Invest. Ophthalmol. Vis. Sci. 2006;47:2011–2020. doi: 10.1167/iovs.05-1393. doi:10.1167/iovs.05-1393. [DOI] [PubMed] [Google Scholar]
- 23.Fleenor D.L., Shepard A.R., Hellberg P.E., Jacobson N., Pang I.H., Clark A.F. TGFbeta2-induced changes in human trabecular meshwork: implications for intraocular pressure. Invest. Ophthalmol. Vis. Sci. 2006;47:226–234. doi: 10.1167/iovs.05-1060. doi:10.1167/iovs.05-1060. [DOI] [PubMed] [Google Scholar]
- 24.Gottanka J., Chan D., Eichhorn M., Lutjen-Drecoll E., Ethier C.R. Effects of TGF-beta2 in perfused human eyes. Invest. Ophthalmol. Vis. Sci. 2004;45:153–158. doi: 10.1167/iovs.03-0796. doi:10.1167/iovs.03-0796. [DOI] [PubMed] [Google Scholar]
- 25.Pasutto F., Mardin C.Y., Michels-Rautenstrauss K., Weber B.H., Sticht H., Chavarria-Soley G., Rautenstrauss B., Kruse F., Reis A. Profiling of WDR36 missense variants in German patients with glaucoma. Invest. Ophthalmol. Vis. Sci. 2008;49:270–274. doi: 10.1167/iovs.07-0500. doi:10.1167/iovs.07-0500. [DOI] [PubMed] [Google Scholar]
- 26.Weisschuh N., Wolf C., Wissinger B., Gramer E. Variations in the WDR36 gene in German patients with normal tension glaucoma. Mol. Vis. 2007;13:724–729. [PMC free article] [PubMed] [Google Scholar]
- 27.Wirtz M.K., Konstas A.G., Samples J.R., Kaltsos K., Economou A., Dimopoulos A., Georgiadou I., Petersen M.B. Myocilin variations and familial glaucoma in Taxiarchis, a small Greek village. Mol. Vis. 2008;14:774–781. [PMC free article] [PubMed] [Google Scholar]
- 28.Wirtz M.K., Samples J.R., Kramer P.L., Rust K., Topinka J.R., Yount J., Koler R.D., Acott T.S. Mapping a gene for adult-onset primary open-angle glaucoma to chromosome 3q. Am. J. Hum. Genet. 1997;60:296–304. [PMC free article] [PubMed] [Google Scholar]
- 29.Hitchings R.A., Wheeler C.A. The optic disc in glaucoma. IV: optic disc evaluation in the ocular hypertensive patient. Br. J. Ophthalmol. 1980;64:232–239. doi: 10.1136/bjo.64.4.232. doi:10.1136/bjo.64.4.232. [DOI] [PMC free article] [PubMed] [Google Scholar]
- 30.Pohjanpelto P.E., Palva J. Ocular hypertension and glaucomatous optic nerve damage. Acta Ophthalmol. (Copenh) 1974;52:194–200. doi: 10.1111/j.1755-3768.1974.tb00367.x. doi:10.1111/j.1755-3768.1974.tb00367.x. [DOI] [PubMed] [Google Scholar]
- 31.Miller S.A., Dykes D.D., Polesky H.F. A simple salting out procedure for extracting DNA from human nucleated cells. Nucleic Acids Res. 1988;16:1215. doi: 10.1093/nar/16.3.1215. doi:10.1093/nar/16.3.1215. [DOI] [PMC free article] [PubMed] [Google Scholar]
- 32.Schultz J., Copley R.R., Doerks T., Ponting C.P., Bork P. SMART: a web-based tool for the study of genetically mobile domains. Nucleic Acids Res. 2000;28:231–234. doi: 10.1093/nar/28.1.231. doi:10.1093/nar/28.1.231. [DOI] [PMC free article] [PubMed] [Google Scholar]
- 33.Linding R., Russell R.B., Neduva V., Gibson T.J. GlobPlot: exploring protein sequences for globularity and disorder. Nucleic Acids Res. 2003;31:3701–3708. doi: 10.1093/nar/gkg519. doi:10.1093/nar/gkg519. [DOI] [PMC free article] [PubMed] [Google Scholar]
- 34.Gasteiger E., Hoogland C., Gattiker A., Duvaud S., Wilkins M.R., Appel R.D., Bairoch A. The Proteomics Protocols Handbook. New York: Humana Press; 2005. [Google Scholar]
- 35.Sanchez R., Sali A. Comparative protein structure modeling: introduction and practical examples with modeller. Methods Mol. Biol. 2000;143:97–129. doi: 10.1385/1-59259-368-2:97. [DOI] [PubMed] [Google Scholar]
- 36.Michaely P., Tomchick D.R., Machius M., Anderson R.G. Crystal structure of a 12 ANK repeat stack from human ankyrinR. EMBO J. 2002;21:6387–6396. doi: 10.1093/emboj/cdf651. doi:10.1093/emboj/cdf651. [DOI] [PMC free article] [PubMed] [Google Scholar]
- 37.Sayle R.A., Milner-White E.J. RASMOL: biomolecular graphics for all. Trends Biochem. Sci. 1995;20:374. doi: 10.1016/s0968-0004(00)89080-5. doi:10.1016/S0968-0004(00)89080-5. [DOI] [PubMed] [Google Scholar]
- 38.Keller K.E., Bradley J.M., Kelley M.J., Acott T.S. Effects of modifiers of glycosaminoglycan biosynthesis on outflow facility in perfusion culture. Invest. Ophthalmol. Vis. Sci. 2008;49:2495–2505. doi: 10.1167/iovs.07-0903. doi:10.1167/iovs.07-0903. [DOI] [PMC free article] [PubMed] [Google Scholar]
- 39.Polansky J.R., Weinreb R.N., Baxter J.D., Alvarado J. Human trabecular cells. I. Establishment in tissue culture and growth characteristics. Invest. Ophthalmol. Vis. Sci. 1979;18:1043–1049. [PubMed] [Google Scholar]
- 40.Stamer W.D., Seftor R.E., Williams S.K., Samaha H.A., Snyder R.W. Isolation and culture of human trabecular meshwork cells by extracellular matrix digestion. Curr. Eye Res. 1995;14:611–617. doi: 10.3109/02713689508998409. doi:10.3109/02713689508998409. [DOI] [PubMed] [Google Scholar]
- 41.Alexander J.P., Samples J.R., Van Buskirk E.M., Acott T.S. Expression of matrix metalloproteinases and inhibitor by human trabecular meshwork. Invest. Ophthalmol. Vis. Sci. 1991;32:172–180. [PubMed] [Google Scholar]
- 42.Kelley M.J., Rose A.Y., Song K., Chen Y., Bradley J.M., Rookhuizen D., Acott T.S. Synergism of TNF and IL-1 in the induction of matrix metalloproteinase-3 in trabecular meshwork. Invest. Ophthalmol. Vis. Sci. 2007;48:2634–2643. doi: 10.1167/iovs.06-1445. doi:10.1167/iovs.06-1445. [DOI] [PubMed] [Google Scholar]
- 43.Cartegni L., Chew S.L., Krainer A.R. Listening to silence and understanding nonsense: exonic mutations that affect splicing. Nat. Rev. Genet. 2002;3:285–298. doi: 10.1038/nrg775. doi:10.1038/nrg775. [DOI] [PubMed] [Google Scholar]
- 44.Keller K.E., Kelley M.J., Acott T.S. Extracellular matrix gene alternative splicing by trabecular meshwork cells in response to mechanical stretching. Invest. Ophthalmol. Vis. Sci. 2007;48:1164–1172. doi: 10.1167/iovs.06-0875. doi:10.1167/iovs.06-0875. [DOI] [PubMed] [Google Scholar]
- 45.Vittal V., Rose A., Gregory K.E., Kelley M.J., Acott T.S. Changes in gene expression by trabecular meshwork cells in response to mechanical stretching. Invest. Ophthalmol. Vis. Sci. 2005;46:2857–2868. doi: 10.1167/iovs.05-0075. doi:10.1167/iovs.05-0075. [DOI] [PubMed] [Google Scholar]
- 46.Keller K.E., Acott T. Segmental versican expression in the trabecular meshwork and involvement in outflow facility. Invest. Ophthalmol. Vis. Sci. 2011;52:5049–5057. doi: 10.1167/iovs.10-6948. doi:10.1167/iovs.10-6948. [DOI] [PMC free article] [PubMed] [Google Scholar]
- 47.Keller K.E., Aga M., Bradley J.M., Kelley M.J., Acott T.S. Extracellular matrix turnover and outflow resistance. Exp. Eye Res. 2009;88:676–682. doi: 10.1016/j.exer.2008.11.023. doi:10.1016/j.exer.2008.11.023. [DOI] [PMC free article] [PubMed] [Google Scholar]