Abstract
A computational model of the glucagon/insulin-driven liver glucohomeostasis function, focusing on the buffering of glucose into glycogen, has been developed. The model exemplifies an ‘engineering’ approach to modelling in systems biology, and was produced by linking together seven component models of separate aspects of the physiology. The component models use a variety of modelling paradigms and degrees of simplification. Model parameters were determined by an iterative hybrid of fitting to high-scale physiological data, and determination from small-scale in vitro experiments or molecular biological techniques. The component models were not originally designed for inclusion within such a composite model, but were integrated, with modification, using our published modelling software and computational frameworks. This approach facilitates the development of large and complex composite models, although, inevitably, some compromises must be made when composing the individual models. Composite models of this form have not previously been demonstrated.
Keywords: computational modelling, glucose homeostasis, liver, systems biology
1. Introduction
The construction of predictive models of complete biological systems that can be used to develop the understanding of integrated biological function is a key aim of systems biology. Biological modelling efforts have followed two general approaches. The first is simulation, where a usually restricted set of processes is modelled with fidelity and detail. This places heavy demands on biological data, in both quality and quantity [1]. Alternatively, physiological behaviours are modelled with the aim of capturing the underlying control principles governing the behaviour of interest, with only key biological mechanisms characterized and parametrized in detail [2]. The most comprehensive modelling effort to date—the Hunter/Noble model of the heart [3,4]—provides a hybrid between these two approaches.
Mathematical modelling of biological systems has been conspicuously successful in two particular circumstances: small models of specific, well-characterized system elements, e.g. in electrophysiology [5]; or larger models based on high-throughput data and extensive, thoroughly understood simplification methods, e.g. in metabolic flow analysis [6]. Models that are both comprehensive and detailed, system-level models, covering a variety of interacting phenomena crossing many scales, are few [4], and those that exist have been extremely time-consuming and expensive in effort.
This paper presents the development of a model of glucose homeostasis, based principally on liver function, employing a novel ‘engineering’ approach for generating composite, multi-scale models. The approach allows for the construction of a flexible, large-scale system model by combining component sub-models that may be individually modified, and their number and/or complexity increased or decreased as appropriate. This allows some components to be characterized in greater detail than others, and has the flexibility to enable component substitution to refine characterizations when focus on the role of particular biological mechanisms is required.
Glucose homeostasis is an example of rein control [7]. Insulin and glucagon, both generated in the pancreas, instruct the liver to, respectively, store and release glucose, thereby achieving glucose homeostasis. Insulin activates the storage of glucose in hepatocytes as a polymer, glycogen [8]. Glucagon triggers the release of glucose from glycogen, which is broken down and built up by two enzymes, glycogen phosphorylase and glycogen synthase, with active and inactive forms differentiated by phosphorylation. The degree of activation of these enzymes is determined by the equilibrium between other enzymes, which also have inactive and active forms, in a series of phosphorylative epicycles [9]. Insulin and glucagon affect these enzyme equilibria via intracellular second messengers including cyclic adenosine monophosphate (cAMP), calcium, inositol trisphosphate (IP3), protein kinase A (PKA) and others [10–13]. Insulin secretion by the pancreas is triggered at about 4 mM blood glucose, while glucagon secretion is inhibited at about 7 mM [14]. In addition, liver glycogen storage is controlled directly by glucose and its phosphorylated forms [15], by the glucose-sensitive use of glucose in other organs of the body [16], and by non-pancreatic hormones (not modelled in this paper).
The principal pathology of glucose homeostasis is diabetes. A key test of models of the liver–pancreas interaction in achieving glucose homeostasis is type 2 diabetes, where the liver has reduced sensitivity to insulin. Models can be tested by reference to continuously measured blood glucose trajectories [17]. One feature of such measurements is the presence of blood glucose oscillations with periods ranging from half an hour to 2 h, termed ultradian insulin oscillations (e.g. [18,19]). Much of the focus in trying to understand the genesis of these oscillations has been on pancreatic (insulin production) dynamics [20]. However, the role of the liver has been of increasing interest in recent years [21] and modelling liver–pancreas feedback has a relatively long history [22].
Liu & Tang [23] and Liu et al. [24] have modelled glucose homeostasis focusing specifically on the dynamics of the insulin signalling pathway along with the action and kinetics of key enzymes involved in the process of glucose mobilization by glycogen phosphorylase and glycogen synthase in the liver. These authors construct a ‘flat’ model consisting of approximately 30 differential equations with 70 parameters. Their model is parametrized from the literature and from fitting to high-level data (also obtained from the literature). These authors' model performed well in some circumstances in qualitatively matching experimental insulin production data. The model could also produce stable oscillations known to occur in both blood glucose and insulin concentrations, although these did not qualitatively match some features of the empirically observed oscillations.
This paper shows how an engineering approach, which exploits modularity in a fundamental way, can be employed successfully to construct a detailed, multi-scale model of a major physiological system: the glucose homeostasis system. The model can be tuned and validated against existing data, and is capable of generating interesting and novel outputs, which potentially are of clinical interest. Our model is constructed to be amenable to further elaboration through refinement of existing components and the addition of new components, without requiring major reorganizations at each step. Problems in physiology usually involve many parts of the organism. Measurements taken either in vivo at the level of the organism or in vitro at the level of the cell inevitably are affected by connected systems and any potential treatments would also affect the whole organism. This integrated aspect of physiology makes it important to be able to model many interconnected systems.
Modularity has significant advantages for the construction of complex system models. (i) Modularity aids understanding by presenting a system in distinct functional units. (ii) Different researchers can work on each module separately, distributing effort and expertise. (iii) Modifications can be made to one module without affecting others. If desired, a module can be replaced entirely. (iv) Modules may be re-used as part of other projects and a library of models may be gradually accumulated. (v) Algorithms based on division of a system into elements based on differing spatial or temporal scales can be used to integrate modular components [25]. (vi) Different components can be encoded in different computational environments, languages and tools depending on developer preferences. (vii) Modules may be independently validated or tested.
The incremental development of a single, gradually expanding model, with each refinement being made only when the existing elements have been well validated, is necessarily slow. The present approach allows models to be added together to create a complex composite model for tuning, validation and generation of results for analysis. The strategy deliberately makes use of models of individual elements that are already available in the literature. This has been made possible by a software framework [26–28] which allows models to be tied together in a model management system. The models are linked together after being wrapped using a composite model description language (CMDL), an XML-based language that can be used to specify composite models [26]. The language supports specification of structure and implementation details for composite models, along with the interfaces provided by each sub-model. At the level of computational implementation, where it is inconvenient or costly to link distinct components into a single large ‘flat’ model, problems such as inconsistencies in structure or time scales between components can be managed by an adaptation of the numerical technique known as ‘waveform relaxation’, originally developed for parallel computation [25]. This is a numerical technique for computing solutions to a system of ordinary differential equations (ODEs) that enables the integration of independent sub-systems (or modules) by using the outputs of sub-systems as inputs to others and vice versa. The algorithm makes it possible to integrate models of different mathematical forms independently of the solution technique that might be employed for individual components.
2. Building a composite model for glucose homeostasis
The composite model brings together a series of sub-models, some taken from or based on established models and others developed ab initio, of aspects of the physiology of glucose homeostasis. The current choice of component models is determined by the minimal physiology that needs to be represented to describe the basic features of the glucose homeostasis system and key elements of its control. Some sub-models represent the physiology at a greater level of detail than others.
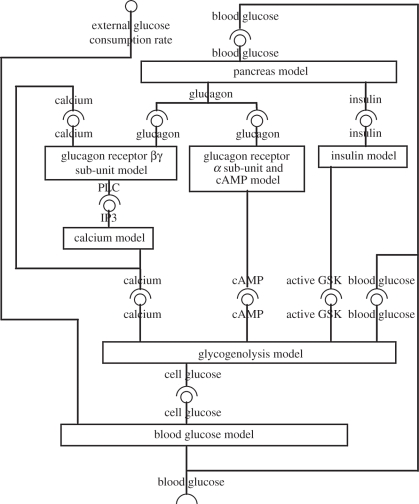
Seven component models describe the major elements of glucose homeostasis, with multiple feedback relationships between sub-models, and an overarching feedback cycle: liver → blood → pancreas → liver. This cycle is moderated via the blood by dietary intake of glucose and active consumption of glucose in organism activity. The model aims to mimic quantitatively the behaviour of glucose regulation following external stimuli to the liver both in a healthy state and with diabetes. The interchange between glucose and glycogen is influenced by four factors: glucagon via calcium, glucagon via cAMP, insulin and directly by cellular glucose levels. These factors impinge upon a central model that represents the computation carried out by competing enzyme phosphorylation equilibria. These nested feedback structures, and the inputs and outputs of each component model, are represented in figure 1.
Figure 1.
Schematic showing the interactions between the seven component models that make up the composite glucose homeostasis model. A model's required input is represented by a circle symbol; a model's output by a claw symbol. The input to the composite model is the rate of external glucose supply (positive values) or demand (negative values) and the output is the concentration of blood glucose.
Five of the seven models represent aspects of hepatocyte physiology. The models treat the whole body of hepatocytes across the liver as a single cellular component, and the parameters reflect this. Complexities introduced by metabolic zonation [29] and inter-hepatocyte communication through direct cell–cell communication channels will be considered in future models. The two remaining components are a simple model of the pancreas and a model mediating between pancreas and liver representing blood transport.
Each component model is first described independently, together with, for the more complex models, some example results obtained when the model is considered separately. This allows independent verification of the component's behaviour in a context which does not depend on its embedding within the larger system. The mathematical descriptions of each sub-model and its parameters are given in the electronic supplementary material (appendix A) and all models are available at http://www.compbio.org./models.html. A summary of the models is given in table 1.
Table 1.
The component models of the glucose homeostasis system.
| model name | biology | source | units | computational language | inputs | outputs to |
|---|---|---|---|---|---|---|
| G-protein model A | glucagon receptor βγ sub-units, desensitization, PLC | [34,32,33] | M,s | Mathematica | G,B | B |
| calcium model B | IP3, calcium oscillations | [36] | M,s | XPPAUT | B | B,F |
| cAMP model C | glucagon receptor α sub-unit, cAMP, PKA | ab initio | arbitrary, h | Mathematica | G | F |
| insulin model D | insulin receptor, PIP, GSK | ab initio | arbitrary, min | XPPAUT | G | F |
| blood model E | metabolic demand, transmembrane glucose transport | ab initio | M,s | XPPAUT | F | F,G |
| glycogen model F | control of glycogen phosphorylase and synthase | [12,15,8,9] | M blood equiv. | XPPAUT | B,C,D,E | F |
| pancreas model G | glucagon and insulin production | ab initio | arbitrary, min | Mathematica | F | A,C,D |
2.1. Glucagon receptor model (A)
This module represents the activation of a G-protein-coupled receptor by a hormone stimulus. The G-protein-coupled receptor is an important element of many signalling pathways, and this module can, therefore, be used as a component of several signalling systems. Receptor activation of the G-protein causes GDP for GTP exchange, which results in conformational changes in the G-protein and separation of the Gα sub-unit from Gβγ sub-units. Both GTP-bound Gα and Gβγ are able to regulate effectors [30,31].
Activation of the α sub-unit is considered under the cAMP model. The glucagon receptor model describes activation of the βγ sub-units of the G-protein and is based on Nauroschat & an der Heiden [32] and Riccobene et al. [33]. We have added the known effect that calcium increases receptor inactivation [34]. The processes modelled are: ligand–receptor binding and dissociation, receptor sequestration and desequestration and its dependence on receptor phosphorylation state, receptor phosphorylation and its dependence on active G-protein and ligand-binding, G-protein activation and inactivation and its dependence on calcium and phospholipase C (PLC), and the production of PLC by active G-protein.
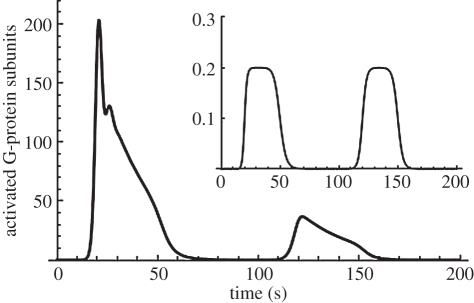
Model results in figure 2 show the characteristic initial rise then fall seen in G-protein responses to glucagon stimulation (inset), which compares well with the results in Bridgette et al. [35]. A sustained stimulus produces a transient response. A second glucagon stimulus reveals desensitization of the G-protein receptor [33].
Figure 2.
Behaviour of the glucagon receptor model. The main panel illustrates the G-protein response (number of activated G-protein sub-units in the cytoplasm) to a repeated glucagon stimulus of 0.2 µM (shown in inset). The response exhibits desensitization to the second stimulus. The PLC* response is similar (not shown).
2.2. Calcium model (B)
This describes the calcium signalling pathway activated by IP3, taken from Höfer [36]. It is a simplification of Höfer's model in which all switch-like response curves are unified as a Hill function with a common coefficient, as discussed in Hetherington et al. [37]. The model includes IP3-dependent calcium entry through the cell membrane, calcium- and IP3- dependent release of calcium by the endoplasmic reticulum (ER), and the ER and membrane calcium pumps. The parameters were obtained from Höfer [36] as explained in Hetherington et al. [37].
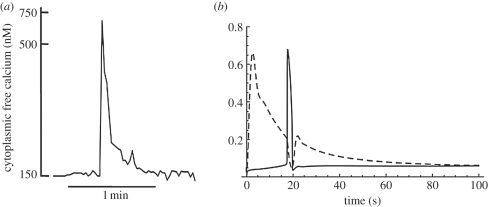
Höfer's model was developed to describe the calcium oscillations induced by vasopressin and epinephrine. However, glucagon generates only a single calcium transient [38]. Figure 3a shows a single calcium transient recorded experimentally, while figure 3b shows results generated by linking the glucagon receptor model to the calcium model and illustrates the transient IP3 response generated by 5 nM glucagon together with the consequent single calcium transient.
Figure 3.
(a) The experimental calcium response to 5 nM glucagon (after Mine et al. [38]). (b) The output from a two-component model obtained by coupling the G-protein receptor model and the calcium model. The models are coupled by assuming that the IP3 driving function for the calcium model is proportional to the PLC output of the receptor model. The graphs show the response to a glucagon stimulus of 5 nM.
The G-protein and calcium models are coupled by PLC/IP3 and calcium. The G-protein model produces an output of PLC that generates IP3, the input to the calcium model. The scaling between PLC and IP3 is assumed to be linear and is determined by the scaling parameter GSPLC, a component of the composite model (see electronic supplementary material, appendix B). This was set as 1 µm active PLC generates 100 µm IP3, so that, given the range of values of PLC produced by the receptor model, the range of values of the IP3 variable is as expected in calcium oscillation modelling [34,36]. The calcium output generated by the calcium model is fed back as an input into the G-protein model.
2.3. Cyclic adenosine monophosphate model (C)
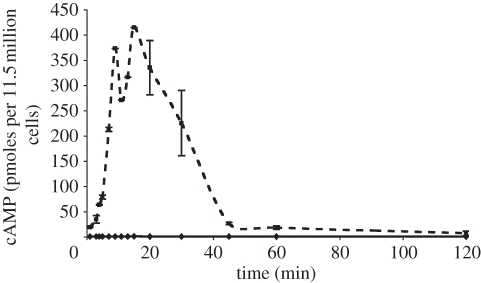
This model, developed ab initio, represents activation of the G-protein α sub-unit of the glucagon receptor model (A), which has different dynamics from the βγ sub-unit associated with the calcium pathway described above. Key modelled processes are the activation of the receptor, the production of cAMP by the active receptor complex, the elevated rate of cAMP production by activated receptor, the activation of PKA and the potential nuclear localization of PKA, which will become important when the current composite model is extended to cover the transcriptional changes that result from hormonal stimulation of hepatocytes. Like the calcium component, the cAMP model is based largely on Hill function response dynamics. Receptor–ligand binding dynamics are assumed fast, so that the ligand-bound receptor is not a separate quantity, but rather obtained from the total receptor population by multiplication by an appropriate function, L(t) (electronic supplementary material, equation A 3.3). Parameter values were based on inspection of our experimental data: an example of experimental measurements of cAMP production in hepatocytes in response to glucagon is shown in figure 4. Details of the methods used in our experiments are given in the electronic supplementary material (appendix D).
Figure 4.
Glucagon causes an increase in intracellular cAMP. Ordinate: cAMP expressed as femto-moles per 1.5 million cells. Abscissa: time after the addition of glucagon. Diamonds with solid line, cortisol; squares with dashed line, cortisol + glucagon.
2.4. Insulin model (D)
The current composite model uses a very simple, ab initio model for the insulin receptor and associated pathway. This model declares that the controlling species that tends to increase the amount of active (α-form) glycogen synthase kinase (GSK) has a threshold response to insulin with a relaxation time delay. The representative variable for this pathway's effects on glycogen is the proportion of inactivated GSK-3. The inactive β-form is the phosphorylated form, so that an increase in the GSK variable results in increased glycogen synthesis activity.
2.5. Blood model (E)
The blood model was developed ab initio to describe the movements of glucose between the blood, the liver and the pancreas. Blood glucose is transported into the hepatocyte, where it is converted into glucose-6-phosphate. The membrane glucose transporter (GLUT) is passive, but selective, transporting only glucose, and not glucose-6-phosphate. As a result, the transport appears to be active, with glucose apparently pumped into the cell with a slower transport time constant than might be expected for a strictly passive GLUT. In this and the glycogenolysis models (F—see §2.6), a single intracellular glucose pseudo-concentration variable represents the effective total glucose and glucose-6-phosphate. This illusory-pump model fits the data for a perfusive radiolabelling experiment in pigs in Munk et al. [39], where it was found necessary to consider separately a forward clearance rate into cells (the effective pumping) and a reverse rate out of the cells. The apparent active pumping of glucose actually represents the glucose to glucose-6-phosphate equilibrium—the GLUT pump itself is known to be an effective rapid passive transporter. The radiolabelling methods of Munk et al. [39] cannot distinguish between intracellular glucose and glucose held in the cell as glycogen or in the phosphorylated form so that an apparent increase in cellular glucose pseudo-concentration above the concentration in the surrounding medium will reflect glucose held in other forms. The advective effects of blood circulation are neglected—the blood is treated as a single effective volume, in contact with liver and pancreas and mediates communication between the two via the blood glucose concentration variable gB (see electronic supplementary material, appendix A).
An important input to this model, which is also an input to the composite model, represents feeding, exercise and the basic metabolic drain of the (unmodelled) rest of the body. This exogenous rate of input/output of blood glucose is denoted by M. We define M = 0 to be zero net glucose supply/demand, so that M = 0 can be considered to be a situation where a person is given a glucose drip that exactly matches the constant metabolic demand of the resting state. An increase in M represents an increase in blood glucose, as, for example, after feeding. A fall in M represents a fall in blood glucose, as, for example, during fasting. This device allows us to avoid representing the rest of the body as a separate component.
The model involves a quantity, denoted vf, that represents the effective volume ratio of liver cytoplasm to blood volume, so that a unit concentration fall of cellular glucose in the liver produces vf units of blood glucose concentration increase. The transmembrane glucose transport parameters are based on the values in Munk et al. [39], where the steady-state ratio of cellular pseudo-concentration to blood concentration is somewhat over unity, and the time scale of response (k2 in the study of Munk et al. [39]) is of the order of 1 min. The selection of appropriate values for vf is explained below as this choice is complicated by the process of model composition.
2.6. Glycogenolysis model (F)
Many factors control glycogen breakdown and synthesis. This model incorporates direct control by cellular glucose and glucose-6-phosphate, based on the model in Cardenas & Goldbeter [15], control by calcium ions, based on the model in Gall et al. [12], control by cAMP via PKA, and by insulin via GSK, based on the representations in Bollen et al. [8] and King [9]. The model includes direct control of glucose by glucose, in addition to pancreatic hormone control. In order to reconcile these four competing inputs, one could, in principle, model the full enzyme kinetic scheme consisting of glycogen phosphorylase and synthase, their phosphatases and kinases, and the additional phosphatases and kinases involved. This phosphorylation cycle cascade is, however, extremely complicated and not sufficiently well characterized experimentally for detailed dynamical modelling to be possible. Instead, a simplified, pragmatic approach has been chosen. The overall decision system, whereby the protein cycles that compute the behaviour in terms of the cell's second messengers, rather than being modelled in detail, is represented using fuzzy logic [40]. A Boolean logical expression, based on each of the four inputs, determines whether glycogen build-up and breakdown are on or off. This Boolean expression is extended to the domain where the four inputs are not themselves Boolean variables, but, rather, intermediate degrees of cellular activity in the unit interval 0–1. The model is completed by defining a simple saturating function to represent the saturating kinetics of the enzymes, and specifying response times for these activities to the inputs.
In developing the model, the logical expressions were explored to achieve a model consistent with known behaviour. Parameter values for this model were based on Gall et al. [12] and Cardenas & Goldbeter [15], obtained from the enzyme kinetics database BRENDA [41].
2.7. Pancreas model (G)
To complete the glucohomeostatic feedback cycle, we need a pancreas model responsible for the production of the hormones glucagon and insulin. In order to retain a focus on hepatic physiology, we developed ab initio a particularly simple pancreas model, in which the release of glucagon or insulin follows time-delayed threshold responses. This is modelled using a logarithmic response to the ratio of blood glucose to a fixed reference level, defined so that there is a zone within which the rate of glucagon or insulin release is small, but which rises steeply as the perimeter of this zone is approached. An additional factor not modelled directly is the timescale of the circulation between pancreas and liver, which is represented using only the pancreatic and liver response times.
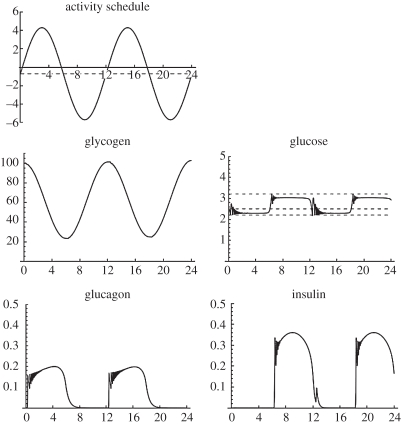
Figure 5 shows the consequences of an imposed activity cycle obtained by coupling this simple pancreas model to a similarly simple liver model, incorporating the actions of glycogen phosphorylase, assumed here to be controlled only by glucagon, and glycogen synthase, assumed here to be controlled only by insulin. Positive activity values represent glucose comsumption by the body and negative values glucose intake from feeding. The example assumes two cycles in a 24 h period.
Figure 5.
Output from a simple glucose homeostasis model consisting of the pancreas model coupled with a high-level liver model. Horizontal axes are time in hours. Vertical axes are concentrations in arbitrary units.
Oscillations in blood glucose concentration about the reference level at the system's natural frequency are induced by the periodic activity-feeding (glucose demand–supply) function M(t). However, additional, high-frequency oscillations are superimposed on this cycle. In the full composite model, these will be identified with the ultradian glucose oscillations [19]. It is interesting that these oscillations appear even in this very coarse-grained model as an emergent property of pancreas–liver feedback dynamics. The frequency of the oscillations observed here and in early runs of the composite model is faster than observed experimentally for ultradian oscillations. This arises from values for enzyme kinetics taken from the BRENDA database, which are probably inappropriate (see §4).
3. Model tuning and validation
3.1. Tuning the model parameters
The seven models described above must now be composed together, matching each input to the appropriate output, as indicated in figure 1. The scalings of time and of the transferred variables must be made consistent, and, for the most part, follow from the units indicated above for each component model (table 1). Scaling factors introduce parameters to the composite model that are not present in any of the original component models. For example, one model may use the number of molecules and another molarity. A volume parameter must be introduced to produce appropriate scaling between such component models. Where the additional parameter occurs only through multiplying combinations of other parameters it can, if desired, be removed by a reparametrization of the composite model. The choice is either to have additional parameters or reduced parameters that are less easily identified with biological properties. Details are given in the electronic supplementary material (appendix B).
Model tuning was done manually: first using the most appropriate published data and then modifying parameters, while maintaining consistency where parameters were not independent, to fit with available experimental data. We began with parameters selected for individual models. Details of the procedure used for tuning the composite model are given in the electronic supplementary material (appendix C).
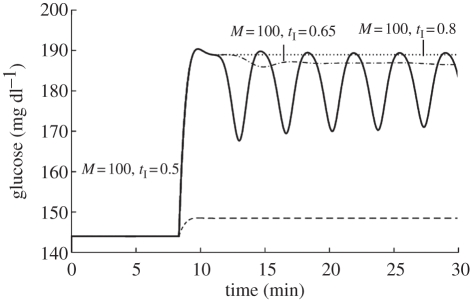
In initial runs of the model using the preliminary parameter estimates, the liver was cleared of glucose extremely rapidly, with ultradian glucose oscillations displaying an excessively high frequency, but with the relative amplitude of the first peak to other peaks of the oscillations, and shape, being broadly correct (figure 6).
Figure 6.
Response of the composite model to a glucose challenge for values of the external glucose input (M) and insulin sensitivity as indicated.
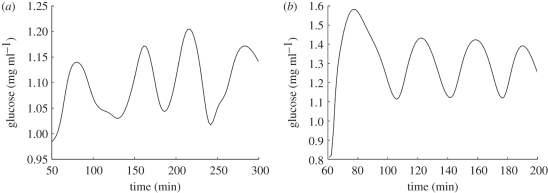
As discussed in the electronic supplementary material (appendix B) competition between components and mixing of enzyme and substrate will be slowed by diffusion in the intracellular space. This was accommodated by slowing down the relevant processes by reducing rate constants or, equivalently, increasing characteristic times (reciprocals of rate constants). The model was then shown to fit published data well (figure 7).
Figure 7.
(a) Ultradian oscillations in blood glucose recorded during continuous enteral nutrition with 90 cal h−1 [18]. (b) The oscillatory response of the model to an equivalent sustained glucose challenge after modification of the parameter values.
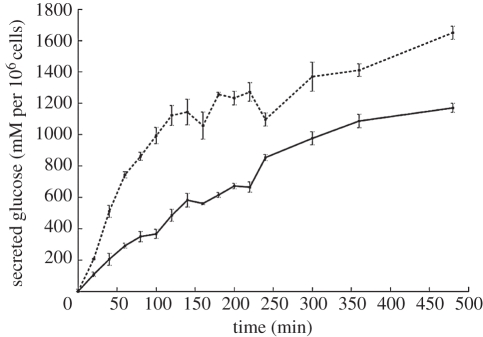
The tuning was also checked by comparison of time scales with direct experiment in which the rate of glucose release from cultured hepatocytes was determined. Figure 8 shows the release of glucose from primary, cultured hepatocytes that had been loaded with glucose by the addition of insulin to glucose-containing culture medium overnight. At time zero, the bathing medium was replaced by medium lacking glucose and the glucose released into the medium monitored over the next 8 h in the absence and presence of glucagon. Glucose release was relatively slow and occurred with a time course consistent with the model using the adjusted parameter values. The production of cAMP by glucagon-treated hepatocytes referred to above and illustrated in figure 4 similarly displayed a relatively slow time course, consistent with the model using the adjusted parameter values.
Figure 8.
Glucose secreted by cultured rat hepatocytes in response to the addition of glucagon to the culture medium at t = 0. Data used for model parametrization. Dashed line, 10 nM glucagon; solid line, control.
3.2. Model validation
Individual models were fitted from small-scale data and the degree of fit of the composite model compared with the behaviour of the overall glucose homeostasis system. Parameters were chosen for each component model and the models validated individually against appropriate experimental observations. Scaling parameters needed for model composition were identified from the definition of the models' units and appropriate data where possible. Where parameters remained to be determined, these were tuned as part of the validation of the composite model, based on higher scale observations of the whole system as described above. The component models' parameters were not further tuned to obtain an optimal fit to experimental results for the whole system. We have required only that the model gives a reasonable description of the key qualitative features of the whole system and shows order-of-magnitude quantitative fidelity.
Validation was based on the following criteria:
— existence of a homeostatic response to a range of glucose challenges;
— existence and correct behaviour of ultradian oscillations under appropriate conditions; and
— match to observed experimental behaviour in response to a glucagon challenge [14].
A fundamental validation step is to examine glucose variation in the presence of a challenge to homeostasis. This was achieved by either inserting (feeding) or removing (exercise) excess glucose from the blood (represented by the activity function M(t) in the blood glucose model (E)—see electronic supplementary material, appendix A). This approximates to an oral glucose tolerance test (OGTT), although, for modelling convenience, a sudden-onset, subsequently sustained glucose input is used: M(t) = M, a constant (mM s−1), for t ≥ τ0, the time of onset. This matches the conditions of continuous enteral nutrition employed by Simon et al. [18] and figure 7 shows that the tuned model (figure 7b) qualitatively reproduces their observations (figure 7a) reasonably well.
Since cAMP control of glycogen phosphorylase via the α sub-unit of the G-protein is probably dominant in hepatocytes [42,43], in order to restrict the number of potential parameters and variables to be explored, we have inactivated the G-protein βγ sub-unit (A) and calcium (B) modules for the results presented below, removing that entire arm from the model structure (figure 1)—see electronic supplementary material (appendix A, equations (A 6.9) and (A 6.10)). The modular structure of the composite model makes such adjustment extremely simple.
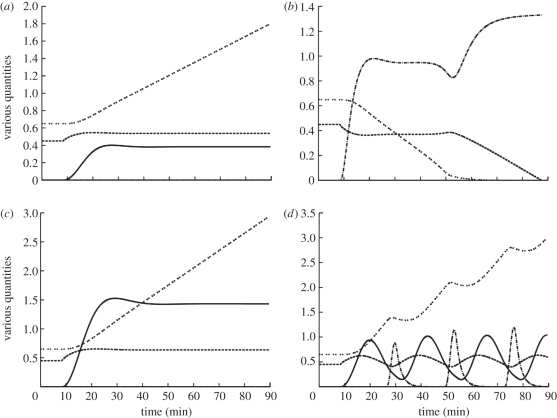
Figure 9 explores the behaviour of the tuned model to different challenges. The first is the consequence of a small glucose input (M = 5) or demand (M = −5), which produce a raised or decreased steady-state glucose concentration and a steadily rising or falling glycogen level (figure 9a,b). There is a small shift in the blood glucose level, because the homeostatic machinery stimulates glycogen synthesis or breakdown, just enough to cope with the glucose supply or demand. For a negative glucose input, reflecting an increase in demand or reduced glucose supply (figure 9b), glucagon rises to mobilize glucose from glycogen stores and blood glucose first falls to a new, lower stable state. This is maintained until the glycogen store is exhausted and glucose homeostasis then fails, with blood glucose falling away to life-threatening levels, mimicking extreme glucose deficit.
Figure 9.
Composite model output for various constant glucose inputs M. Units are millimolar for blood glucose, millimolar blood glucose equivalent for glycogen, arbitrary units of the pancreas model for glucagon and insulin, and units of M for external glucose supply. (a) Low glucose supply, M = 5. (b) Low glucose demand, M = −5. (c) High glucose input, M = 10, but with low insulin sensitivity, tI = 0.8. (d) High glucose input, M = 10, but with high insulin sensitivity, tI = 0.1. Dashed line, glucose; double dotted line, glycogen; dashed dotted line, glucagon; solid line, insulin.
For high levels of glucose input (M =10), blood glucose can be maintained at physiological levels provided that the enzyme GSK retains a normal sensitivity to insulin. Figure 9c shows that even if GSK resistance to insulin is increased (from a normal value of tI = 0.5 to tI = 0.8 in model D; electronic supplementary material, appendix A 4) normal glucose homeostasis can still be maintained by the direct glucose control mechanism because a rise in cellular glucose concentration stimulates glycogen synthesis despite the reduced sensitivity to insulin that prevents a fully hormone-driven response. While this could be another indication of the robustness of the system, it nevertheless suggests that small reductions in insulin sensitivity, such as might occur early in the diabetic response, can be accommodated through the direct glucose control mechanism and therefore could be masked, potentially delaying diagnosis of type 2 diabetes.
Figure 9d shows that if GSK resistance to insulin is lower than normal, so that insulin sensitivity increases, then, for M = 10 and an insulin sensitivity of 0.1, all parameters oscillate. By the time the liver responds to changes in pancreatic hormones, the blood glucose level has been driven too far in the opposite direction and the pancreas response remains out of phase with the liver response, producing varying glucose levels. In extreme cases, large oscillations result in acute temporary hypoglycaemia. Once the glucose concentration drops to such low values, other physiological factors not modelled would play an important role, so the subsequent course of the model after the first extreme oscillation is not valid.
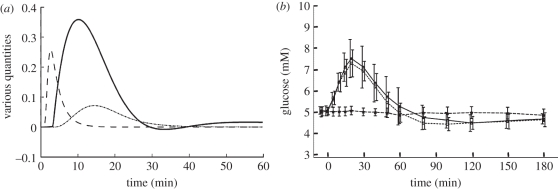
It is of interest to consider other challenges to the glucose homeostasis system, in particular a glucagon challenge, as proposed in Lockton & Poucher [44]. This provides a useful test of model reliability, since this virtual experiment was not performed until after the model content and parameters were settled. Figure 10 compares results from the model with those obtained by Lockton & Poucher [44], who challenged fasting subjects with a bolus of glucagon and monitored the rise in blood glucose, taken to be the consequence of glycogenolysis. The model produces a transient increase in blood glucose (figure 10a) that matches their results (figure 10b). They note also that the initial glucagon challenge is accompanied by a transient rise in insulin. The model (figure 10a) also shows a transient rise in insulin after an initial glucagon challenge. Additionally, the model reproduces the transient hypoglycaemia following glucagon challenge noted in Lockton & Poucher's experiments, although the time scale of the model response is about twice as fast. The results of Simon & Brandenberger [19] make it clear that there is substantial variation in time scales from individual to individual. However, the discrepancy in time scales between model and experiment is most probably due to the buffering effect of other tissues, not modelled. Detailed additional tuning of model parameters does not seem warranted given the satisfactory degree of qualitative similarity in the responses of model and experiment.
Figure 10.
Response to a glucagon challenge. (a) The response of the model after parameter modification to an external input of 1 unit of glucagon (in units of the pancreas model) for 60 s at t = 60 s (g dl−1). Blood glucose is in units of g dl−1 relative to the blood glucose reference level. Glucagon and insulin are in arbitrary units relative to their respective receptor EC-50 (median effective concentration). (b) The experimentally observed blood glucose response to a glucagon challenge. (Adapted from [44].) Note the qualitative similarity between the glucose transient observed experimentally and that produced by the model. Solid line, glucose; dashed line, glucagon; dotted line, insulin.
4. Discussion
This paper presents an effective approach to building large-scale system models that allow sub-models to be composed, using existing models where possible, while ensuring that model couplings are syntactically correct as well as physiologically sensible, to create a complex composite model for tuning, validation and generation of results for analysis. The composite model of glucose homeostasis presented here builds on the modelling efforts of previous workers. The model crosses biological scales from individual molecules up to whole organism phenomena. As a result of this work, a number of issues arise.
Modularization requires the biology to be broken up into components. The restrictions of experimental work, imposed by technical limitations, can effectively split a system into components so that biologists rarely analyse a complete system. However, precise division of the biology into non-overlapping components is not always possible either experimentally or in models. This means that some modules may generate duplication in the sense that the same process participates in more than one component model, and these processes may need to be instantiated separately in the different model components. This is most likely when using previously published models to construct a composite model. However, for both modelling and physiological reasons, this may prove justifiable. For example, it may be reasonable to use a relatively simple model to obtain inputs for a module that it affects only in some minor features, and a more detailed model of the same component to obtain inputs to a different module that is affected significantly. This strategy may provide advantages in terms of computational time. Apparent duplication also may be necessary when common molecules are used in different biological pathways (modelled separately), but which do not result in cross talk owing to physical separation, or also potentially to scaffold proteins which contribute to the structuring of the intracellular environment. For example, one model's input function may be a function of another model's state variables. A typical example for ODE modelling is where species A exists in two compartments, each with its own model, and the rate of flux depends on the concentration of A in both compartments. One can express the function for flux as a separate term in each model, and pass the concentration in each compartment to the model of the other in an iterative process [25]. However, it is essential to maintain consistent parameter choices.
In this study, the assignment of values to model parameters revealed the importance of using data acquired under experimental conditions appropriate to the model. Parameter values need to be determined under realistic, rather than idealized, experimental conditions. It is important to use effective rate constants that incorporate delays owing, for example, to diffusion of molecules through the cytoplasm and competition for substrates. Values deposited in databases such as BRENDA are usually derived from measurements made on purified enzymes under ‘ideal’ (supersaturated) conditions, in a stop flow apparatus where mixing is virtually instantaneous. These values are more than likely to be unphysiological.
The primary advantage of an integrative approach to building complex system models lies in the reuse of existing modelling work, which speeds the process of model building and exploits existing intellectual capital. With such a ‘model-based engineering’ approach, which scales modelling techniques to the substantial challenges faced, the full potential of multi-scale modelling in systems biology can be realized. This approach brings its own problems, as detailed above. However, the findings of our model make it clear that composite models constructed in this way can generate interesting biological hypotheses, potential experiments or theoretical advances at a much better effort-to-benefit ratio than would be possible with ab initio detailed modelling. The detailed experimental data that are necessary to underpin simulation are usually generated by focusing on particular elements of a process, according to the experimental techniques available. It is rarely possible to analyse large numbers of variables and parameters simultaneously, and obtain a uniform level of quantitative detail at all relevant levels. Thus, a pragmatic, modular integrative approach that allows components to be individually brought to a quality suitable for use in larger constructs is advantageous.
Once insights have been obtained, it may be possible (and instructive) to design simplified and abstracted models to obtain these features. However, such models will then be ‘stand-alone’ and will inevitably lose many of the subtle interplays between sub-systems that a ‘systems biology’ approach to physiology seeks to capture. This latter aspect will almost certainly be of critical importance when these models are extended and refined enough to be of use in a diagnostic clinical setting (a key long-term goal). Simplified and abstracted models will not have the comprehensiveness and flexibility for this.
The model itself demonstrates direct glucose control of the system, i.e. apancreatic stabilization of blood glucose, illustrating the general concept of robustness through redundancy in evolutionary theory. Functional glucohomeostasis has been observed after pancreatectomy [42,43]. If a suitable experimental model can be found, investigation of whether this is due to direct glucose control would be of value.
In the companion paper [45], the behaviour of the composite model is explored more fully.
Acknowledgements
This work was funded as a Beacon Project of the UK Department of Trade and Industry (DTI). We thank the DTI for their support. T. S. was funded by a CoMPLEX EPSRC Doctoral Training Centre Studentship. We have enjoyed useful discussions with Jonathan Ashmore and Rajiv Jalan.
References
- 1.Bray D., Levin M. D., Lipkow K. 2007. The chemotactic behavior of computer-based surrogate bacteria. Curr. Biol. 17, 12–19 10.1016/j.cub.2006.11.027 (doi:10.1016/j.cub.2006.11.027) [DOI] [PubMed] [Google Scholar]
- 2.Smallwood R., Holcombe M. 2006. The epitheliome project: multiscale agent-based modeling of epithelial cells. In Proc. Biomedical Imaging: Macro to Nano. 3rd IEEE Int. Symp., Rotterdam, The Netherlands, 14–17 April 2010, pp. 816–819 New York, NY: IEEE; 10.1109/ISBI.2006.1625043 (doi:10.1109/ISBI.2006.1625043) [DOI] [Google Scholar]
- 3.Hunter P., Robbins P., Noble D. 2002. The iups human physiome project. Pflugers Arch. 445, 1–9 10.1007/s00424-002-0890-1 (doi:10.1007/s00424-002-0890-1) [DOI] [PubMed] [Google Scholar]
- 4.Noble D. 2002. Modeling the heart–from genes to cells to the whole organ. Science 5560, 1678–1682 10.1126/science.1069881 (doi:10.1126/science.1069881) [DOI] [PubMed] [Google Scholar]
- 5.Hodgkin A., Huxley A. 1952. A quantitative description of membrane current and its application to conduction and excitation in nerve. J. Physiol. 117, 500–544 [DOI] [PMC free article] [PubMed] [Google Scholar]
- 6.Maher A., Kuchel P., Ortega F., de Atauri P., Centelles J., Cascante M. 2003. Mathematical modelling of the urea cycle. A numerical investigation into substrate channelling. Eur. J. Biochem. 270, 3953–3961 10.1046/j.1432-1033.2003.03783.x (doi:10.1046/j.1432-1033.2003.03783.x) [DOI] [PubMed] [Google Scholar]
- 7.Saunders P. T., Koeslag J. H., Wessels J. A. 2000. Integral rein control in physiology. II. a general model. J. Theor. Biol. 206, 211–220 10.1006/jtbi.2000.2118 (doi:10.1006/jtbi.2000.2118) [DOI] [PubMed] [Google Scholar]
- 8.Bollen M., Keppens S., Stalmans W. 1998. Specific features of glycogen metabolism in the liver. Biochem. J. 336, 19–31 [DOI] [PMC free article] [PubMed] [Google Scholar]
- 9.King M. W. 2005. The medical biochemistry page. See http://themedicalbiochemistrypage.org/
- 10.Chiavaroli C., Bird G. S. J., James W., Putney J. 1994. Delayed ‘all-or-none’ activation of inositol 1,4,5-trisphosphate-dependent calcium signaling in single rat hepatocytes. J. Biol. Chem. 269, 25 570–25 575 [PubMed] [Google Scholar]
- 11.Fang X., Yu S. X., Lu Y., Jr, Woodgett R. C., Jr, Mills G. B. 2000. Phosphorylation and inactivation of glycogen synthase kinase 3 by protein kinase A. Proc. Natl Acad. Sci. USA 97, 11 960–11 965 10.1073/pnas.220413597 (doi:10.1073/pnas.220413597) [DOI] [PMC free article] [PubMed] [Google Scholar]
- 12.Gall D., Baus E., Dupont G. 2000. Activation of the liver glycogen phosphorylase by Ca2+ oscillations: a theoretical study. J. Theor. Biol. 207, 445–454 10.1006/jtbi.2000.2139 (doi:10.1006/jtbi.2000.2139) [DOI] [PubMed] [Google Scholar]
- 13.Sedaghat A. R., Sherman A., Quon M. J. 2002. A mathematical model of metabolic insulin signaling pathways. Am. J. Physiol. Endocrinol. Metab. 283, 1084–1101 10.1152/ajpendo.00571.2001 (doi:10.1152/ajpendo.00571.2001) [DOI] [PubMed] [Google Scholar]
- 14.Vieira E., Salehi A., Gylfe E. 2007. Glucose inhibits glucagon secretion by a direct effect on mouse pancreatic alpha cells. Diabetologia 50, 370–379 10.1007/s00125-006-0511-1 (doi:10.1007/s00125-006-0511-1) [DOI] [PubMed] [Google Scholar]
- 15.Cardenas M. L., Goldbeter A. 1996. The glucose-induced switch between glycogen phosphorylase and glycogen synthase in the liver: outlines of a theoretical approach. J. Theor. Biol. 182, 421–426 10.1006/jtbi.1996.0182 (doi:10.1006/jtbi.1996.0182) [DOI] [PubMed] [Google Scholar]
- 16.Syed N. A. 2001. Regulation of glycogen synthase and glycogen phosphorylase by insulin in HepG2 cells. PhD thesis, University of Saskatchewan, Canada [Google Scholar]
- 17.Ludvigson J., Isacson E. 2003. Clinical use of glucose sensors in the treatment of diabetes in children and adolescents. Pract. Diabetes Int. 20, 7–12 10.1002/pdi.430 (doi:10.1002/pdi.430) [DOI] [Google Scholar]
- 18.Simon C., Brandenberger G., Follenius M. 1987. Ultradian oscillations of plasma glucose, insulin and C-peptide in man during continuous enteral nutrition. J. Clin. Endocrinol. Metab. 64, 669–674 10.1210/jcem-64-4-669 (doi:10.1210/jcem-64-4-669) [DOI] [PubMed] [Google Scholar]
- 19.Simon C., Brandenberger G. 2002. Ultradian oscillations of insulin secretion in humans. Diabetes 51(Suppl. 1), S258–S261 10.2337/diabetes.51.2007.S258 (doi:10.2337/diabetes.51.2007.S258) [DOI] [PubMed] [Google Scholar]
- 20.Tolic I. M., Mosekilde E., Sturis J. 2000. Modeling the insulin-glucose feedback system: the significance of pulsatile insulin secretion. J. Theor. Biol. 207, 361–375 10.1006/jtbi.2000.2180 (doi:10.1006/jtbi.2000.2180) [DOI] [PubMed] [Google Scholar]
- 21.Meier J. J., Veldhuis J. D., Butler P. C. 2005. Pulsatile insulin secretion dictates systemic insulin delivery by regulating hepatic insulin extraction in humans. Diabetes 54, 1649–1656 10.2337/diabetes.54.6.1649 (doi:10.2337/diabetes.54.6.1649) [DOI] [PubMed] [Google Scholar]
- 22.Sturis J., Polonsky K. S., Mosekilde E., Cauter E. V. 1991. Computer model for mechanisms underlying ultradian oscillations of insulin and glucose. Am. J. Physiol. Endocrinol. Metab. 260, E801–E809 [DOI] [PubMed] [Google Scholar]
- 23.Liu W., Tang F. 2008. Modeling a simplified regulatory system of blood glucose at molecular levels. J. Theor. Biol. 252, 608. 10.1016/j.jtbi.2008.02.021 (doi:10.1016/j.jtbi.2008.02.021) [DOI] [PubMed] [Google Scholar]
- 24.Liu W., Hsin C., Tang F. 2009. A molecular mathematical model of glucose mobilization and uptake. Math. Biosci. 221/2, 121–129 10.1016/j.mbs.2009.07.005 (doi:10.1016/j.mbs.2009.07.005) [DOI] [PubMed] [Google Scholar]
- 25.Li L., Seymour R. M., Baigent S. 2008. Integrating biosystem models using waveform relaxation. EURASIP J. Bioinform. Syst. Biol. 2008, 308 623–308 641 10.1155/2008/308623 (doi:10.1155/2008/308623) [DOI] [PMC free article] [PubMed] [Google Scholar]
- 26.Margoninski O., Saffrey P., Hetherington J., Li L., Finkelstein A., Warner A. 2006. A specification language and a framework for the execution of composite models in systems biology. LNCS Trans. Comput. Syst. Biol. VII. 4230, 163–184 [Google Scholar]
- 27.Saffrey P., Margoninski O., Hetherington J., Varela-Rey M., Yamaji S., Finkelstein A., Bogle D., Warner A. 2007. End-to-end information management for systems biology. LNCS Trans. Comput. Syst. Biol. VIII. 4780, 77–91 [Google Scholar]
- 28.Hetherington J., et al. 2007. Addressing the challenges of multiscale model management in systems biology. Comput. Chem. Eng. 31, 962–979 10.1016/j.compchemeng.2006.10.004 (doi:10.1016/j.compchemeng.2006.10.004) [DOI] [Google Scholar]
- 29.Niels G., Bjorn Q. (eds) 1991. Regulation of hepatic function. Copenhagen, Denmark: Alfred Benzon Symposium, Munksgard [Google Scholar]
- 30.Grishina G., Berlot C. H. 1997. Identification of common and distinct residues involved in the interaction of alphai2 and alphas with adenylyl cyclase. J. Biol. Chem. 272, 20 619–20 626 10.1074/jbc.272.33.20619 (doi:10.1074/jbc.272.33.20619) [DOI] [PubMed] [Google Scholar]
- 31.Ford C. E., et al. 1998. Molecular basis for interactions of G protein betagamma subunits with effectors. Science 280, 1271–1274 10.1126/science.280.5367.1271 (doi:10.1126/science.280.5367.1271) [DOI] [PubMed] [Google Scholar]
- 32.Nauroschat J., an der Heiden U. 1997. A theoretical approach to G-protein modulation of cellular responsiveness. J. Math. Biol. 35, 609–627 10.1007/s002850050068 (doi:10.1007/s002850050068) [DOI] [PubMed] [Google Scholar]
- 33.Riccobene T. A., Omann G. M., Linderman J. J. 1999. Modeling activation and desensitization of G-protein coupled receptors provides insight into ligand efficiency. J. Theor. Biol. 200, 207–222 10.1006/jtbi.1999.0988 (doi:10.1006/jtbi.1999.0988) [DOI] [PubMed] [Google Scholar]
- 34.Kummer U., Olsen L., Dixon C., Green A., Bornberg E. 2000. Switching from simple to complex oscillations in calcium signaling. Biophys. J. 79, 1188–1195 10.1016/S0006-3495(00)76373-9 (doi:10.1016/S0006-3495(00)76373-9) [DOI] [PMC free article] [PubMed] [Google Scholar]
- 35.Bridgette J., Anita S., Brenda W., William H. R., Doris L., Agnes S., Roger B., Cr B. 1997. Beta-2-adrenergic receptor desensitization, internalization, and phosphorylation in response to full and partial agonists. J. Biol. Chem. 272, 23 871–23 879 10.1074/jbc.272.38.23871 (doi:10.1074/jbc.272.38.23871) [DOI] [PubMed] [Google Scholar]
- 36.Höfer T. 1999. Model of intercellular calcium oscillations in hepatocytes: synchronization of heterogeneous cells. Biophys. J. 77, 1244–1256 10.1016/S0006-3495(99)76976-6 (doi:10.1016/S0006-3495(99)76976-6) [DOI] [PMC free article] [PubMed] [Google Scholar]
- 37.Hetherington J., Warner A., Seymour R. M. 2006. Simplification and its consequences in biological modelling: conclusions from a study of calcium oscillations in hepatocytes. J. R. Soc. Interface 10, 319–331 10.1098/rsif.2005.0101 (doi:10.1098/rsif.2005.0101) [DOI] [PMC free article] [PubMed] [Google Scholar]
- 38.Mine T., Kojima I., Ogata E. 1993. Role of calcium fluxes in the action of glucagon on glucose metabolism in rat hepatocytes. Am. J. Physiol. 265, 35–42 [DOI] [PubMed] [Google Scholar]
- 39.Munk O. I., Bass L., Roelsgaard K., Bender D., Hansen S. B., Kelding S. 2001. Liver kinetics of glucose analogs measured in pigs by PET: importance of dual-input blood sampling. J. Nucl. Med. 42, 439–441 [PubMed] [Google Scholar]
- 40.Kosko B. 1994. Fuzzy thinking. New York, NY: Harper Collins Publishing [Google Scholar]
- 41.Schomburg I., Chang A., Hofmann O., Ebeling C., Schomburg D. 2002. Brenda: a resource for enzyme data and metabolic information. Trends Biochem. Sci. 27, 54–56 10.1016/S0968-0004(01)02027-8 (doi:10.1016/S0968-0004(01)02027-8) [DOI] [PubMed] [Google Scholar]
- 42.Hers H. G. 1990. Mechanisms of blood glucose homeostasis. J. Inherit. Metab. Dis. 13, 395–410 10.1007/BF01799497 (doi:10.1007/BF01799497) [DOI] [PubMed] [Google Scholar]
- 43.Jethwa P., Lala A., Webber J., Buckels J., Bramhall S., Mirza D. 2006. Diabetic control after total pancreatectomy. Dig. Liver Dis. 38, 420–422 10.1016/j.dld.2006.01.022 (doi:10.1016/j.dld.2006.01.022) [DOI] [PubMed] [Google Scholar]
- 44.Lockton J. A., Poucher S. M. 2007. Single dose glucagon (0.5 mg iv bolus) administration in healthy human volunteers is a robust model for assessment of glycogenolysis: characterisation of the glucose excursion after glucagon challenge. J. Pharmacol. Toxicol. Methods 55, 86–90 10.1016/j.vascn.2006.03.009 (doi:10.1016/j.vascn.2006.03.009) [DOI] [PubMed] [Google Scholar]
- 45.Sumner T., et al. 2012 A composite computational model of liver glucose homeostasis. II. Exploring systems behaviour. J. R. Soc. Interface 9, 701–706 [DOI] [PMC free article] [PubMed] [Google Scholar]


