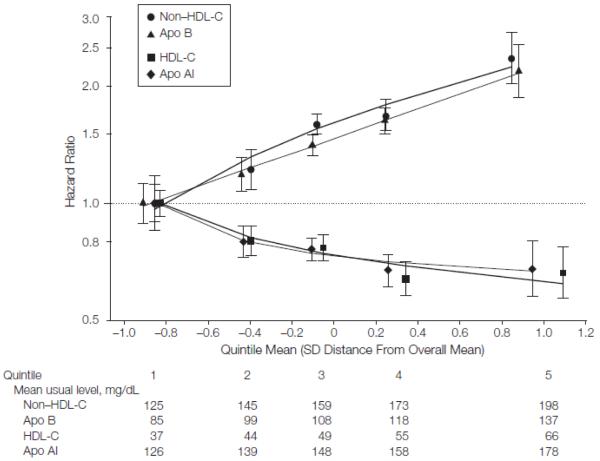
Figure 3.
Hazard Ratios for Coronary Heart Disease Across Fifths of Usual Lipids or Apolipoproteins
Analyses were based on 91 307 participants (involving 4499 cases) from 22 studies. Regression analyses were stratified, where appropriate, by sex and trial group and adjusted for age, systolic blood pressure, smoking status, history of diabetes mellitus, and body mass index; furthermore, analyses of non-HDL-C were adjusted for HDL-C and loge triglyceride, analyses of apolipoprotein B (apo B) were adjusted for apolipoprotein AI (apo AI) and loge triglyceride, analyses of HDL-C were adjusted for non-HDL-C and loge triglyceride, and analyses of apo AI were adjusted for apo B and loge triglyceride. Studies with fewer than 10 cases were excluded from analysis. Sizes of data markers are proportional to the inverse of the variance of the hazard ratios. Referent groups are lowest fifths. Lines are fitted by first-degree fractional polynomial regression of log hazard ratios on mean SD score. Error bars indicate 95% confidence intervals. The y-axis is shown on a log scale. The x-axis is shown on a Z-transformed scale.

