

The performance of distributed human intelligence is not significantly different from that of computer-aided detection (CAD) for colonic polyp classification; the use of distributed human intelligence may provide insights that guide future CAD development.
Abstract
Purpose:
To assess the diagnostic performance of distributed human intelligence for the classification of polyp candidates identified with computer-aided detection (CAD) for computed tomographic (CT) colonography.
Materials and Methods:
This study was approved by the institutional Office of Human Subjects Research. The requirement for informed consent was waived for this HIPAA-compliant study. CT images from 24 patients, each with at least one polyp of 6 mm or larger, were analyzed by using CAD software to identify 268 polyp candidates. Twenty knowledge workers (KWs) from a crowdsourcing platform labeled each polyp candidate as a true or false polyp. Two trials involving 228 KWs were conducted to assess reproducibility. Performance was assessed by comparing the area under the receiver operating characteristic curve (AUC) of KWs with the AUC of CAD for polyp classification.
Results:
The detection-level AUC for KWs was 0.845 ± 0.045 (standard error) in trial 1 and 0.855 ± 0.044 in trial 2. These were not significantly different from the AUC for CAD, which was 0.859 ± 0.043. When polyp candidates were stratified by difficulty, KWs performed better than CAD on easy detections; AUCs were 0.951 ± 0.032 in trial 1, 0.966 ± 0.027 in trial 2, and 0.877 ± 0.048 for CAD (P = .039 for trial 2). KWs who participated in both trials showed a significant improvement in performance going from trial 1 to trial 2; AUCs were 0.759 ± 0.052 in trial 1 and 0.839 ± 0.046 in trial 2 (P = .041).
Conclusion:
The performance of distributed human intelligence is not significantly different from that of CAD for colonic polyp classification.
© RSNA, 2012
Supplemental material: http://radiology.rsna.org/lookup/suppl/doi:10.1148/radiol.11110938/-/DC1
Introduction
Colorectal cancer is the second leading cause of cancer death in Americans (1). Colorectal cancer is a largely preventable disease because the removal of colorectal polyps, the precursor to malignancy, is known to be curative in most patients. Tests that are effective at detecting colorectal polyps include colonoscopy and computed tomographic (CT) colonography (2). Both colonoscopy and CT colonography are tests that are performed and interpreted by trained physicians. In the past few years, computer-aided polyp detection software has been developed and has been shown to improve the diagnostic performance of CT colonography when findings are interpreted by radiologists (3–7).
Despite their promise, computer-aided detection (CAD) systems have yet to achieve their full potential in clinical practice. In the laboratory, CAD systems may have high sensitivity (>90%) for detecting polyps in the relevant size range (6 mm or larger). Unfortunately, radiologists often ignore CAD true-positive polyp findings, leading to relatively low radiologist sensitivity with the assistance of CAD (3). While the reasons for such errors are unclear, perceptual errors are suspected (8). We can learn more about these errors and develop strategies to reduce them by conducting observer performance experiments. Unfortunately, observer performance experiments are time consuming and expensive because of the limited availability and high demand for radiologists’ time.
CAD systems are ideally trained on large databases of proved cases. Typical database sizes range from hundreds to thousands of cases. Acquisition and annotation of the data are expensive and time-consuming steps in database creation. Alternatives to creating large databases would be highly desirable.
A recent innovation is the availability of distributed human intelligence, also known as crowdsourcing. In distributed human intelligence, embodied by the commercial system Amazon Mechanical Turk (MTurk, https://www.mturk.com; Amazon.com, Seattle, Wash), large numbers of laypeople (referred to as knowledge workers [KWs]) can be recruited to perform simple tasks distributed to them over the Internet. Today, the tasks are usually simple classification tasks that involve looking at data—for example, an image or text—and then selecting a multiple-choice response that best describes the data. Workers are typically paid a small amount of money, on the order of a few cents, to complete a task. Tasks typically take the worker less than 1 minute to complete, although more highly paid and time-consuming tasks can also be accommodated. The use of distributed human intelligence to understand and improve human perception of CAD images and perhaps reduce the need for or cost of developing large training databases has not yet been explored.
The purpose of this project was to assess the diagnostic performance of distributed human intelligence for the classification of polyp candidates identified with CAD for CT colonography. We show the accuracy, low cost, and reproducibility of one strategy and discuss training issues for accomplishing this task.
Materials and Methods
This study was approved by the Office of Human Subjects Research of the National Institutes of Health, both for the retrospective use of the anonymized patient data sets and for the participation of the KWs, in compliance with Health Insurance Portability and Accountability Act guidelines. The requirement for informed consent was waived.
Case Selection
Twenty-four patients were randomly selected from three medical centers from a database of patients originally accrued during the study described by Pickhardt et al (9). Sample size was chosen on the basis of a power analysis (for Student t test with power of 80%, a of 5%, effect size of 3%, and data variation of 5%) for paired responses that may be correlated. Each patient had at least one polyp of 6 mm or larger that was confirmed with histopathologic evaluation following optical colonoscopy, and each polyp confirmed with optical colonoscopy was also detected with CT colonography. Among the selected patients, there were 26 confirmed polyps of 6 mm or larger. Baseline patient and polyp characteristics are shown in Table 1.
Table 1.
Baseline Patient and Polyp Characteristics
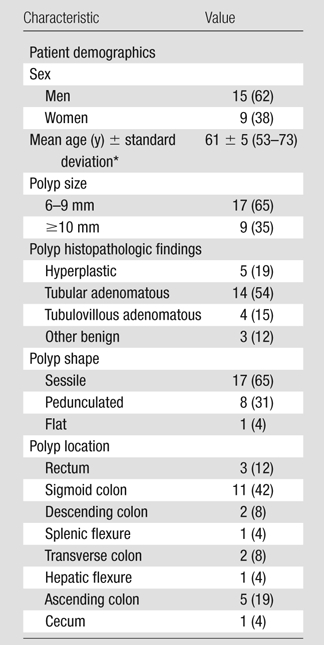
Note.— Twenty-four patients and 26 polyps were included. Numbers in parentheses are percentages, except where otherwise indicated. Percentages were rounded, and those for polyp location do not add up to 100% as a result.
Numbers in parentheses are the range.
Bowel Preparation and CT Scanning
Patients underwent a standard 24-hour colonic preparation (10). Each patient was scanned in the supine and prone positions during a single breath hold by using a four- or eight-channel CT scanner (LightSpeed or LightSpeed Ultra; GE Healthcare Technologies, Waukesha, Wis). CT scanning parameters included 1.25- to 2.5-mm section collimation, 15 mm/sec table speed, 1-mm reconstruction interval, 100 mAs, and 120 kVp (11).
CAD Algorithm
CT images were transferred to a computer server and were analyzed by using a computer-aided polyp detection software package described previously (11–19). Leave-one-patient-out testing was used for CAD training to compare performance by using a support vector machine (SVM) committee classifier. For each patient treated as the test case in the leave-one-patient-out test paradigm, CAD was trained by using the other 23 cases to create a set of polyp detections and their associated SVM committee classifier scores for the test case. The SVM scores range from 0 to 1, with higher scores representing higher confidence that the polyp candidate is a true polyp. This procedure was repeated for each patient to create a final set of 2374 detections among all patients, for an average of 99 polyp candidates per patient, split among supine and prone CT scans.
Experimental Data Set Selection
Forty-seven of the 2374 detections made by CAD represented a total of 26 true polyps confirmed with optical colonoscopy. Two polyps were detected on only the supine scan, four polyps were detected on only the prone scan, 19 polyps were detected once on each of the supine and prone scans, and one polyp was detected twice on the supine and once on the prone scans. To create a manageable data set of polyp candidates with the highest probability of being true-positive results, an SVM score threshold of 0.6 or greater was chosen for this study. On the basis of free-response receiver operating characteristic analysis (20,21), this threshold corresponded to a CAD false-positive rate of 10.2 false polyp detections per patient while still maintaining a sensitivity of 0.88 for true polyp detection. An additional eight detections were discarded because of inadequate software rendering, all of which corresponded to false-positive detections from a single scan. Of the 268 remaining detections, 31 detections represented 23 confirmed true polyps. After applying the threshold level of 0.6 or greater to the SVM scores, nine polyps were detected on only the supine scan, six polyps were detected on only the prone scan, and eight polyps were detected once on each of the supine and prone scans. Each of these detections was labeled a priori as “easy,” “moderate,” or “difficult” by an expert radiologist with more than 10 years of experience with CT colonography in a research setting (R.M.S.) on the basis of perceived difficulty for a reader to correctly classify a detection as a true polyp or a false polyp. Easy detections were those in which it was decided that the categorization of the detection as true- or false-positive would be immediately obvious at a glance, with limited training. Difficult detections were those in which the categorization was not immediately obvious and might require additional knowledge or information (eg, additional training or additional viewpoints such as the alternate supine or prone view) or detections in which the finding looked like an obvious polyp but was not a polyp, on the basis of the reference standard. Moderate detections were those of intermediate difficulty.
Distributed Human Intelligence
We employed the MTurk Web service to find anonymous workers to perform polyp classification on our data set. MTurk is an Internet-based crowdsourcing platform that allows requesters to easily distribute small computer-based tasks to a large number of untrained KWs. KWs receive a small monetary reward from the requester for each human intelligence task (HIT) that they complete.
For this study, we believed that KWs with minimal training would be able to recognize differences in three-dimensional shapes and other features of polyp candidates on CT colonographic images that would allow them to perform accurate polyp classification. We generated and published one HIT on the MTurk platform for each CAD polyp candidate and asked 20 KWs to label each HIT as a true polyp or false polyp. By combining the results from multiple KWs who each worked on a different set of polyp candidates, we were able to create a system of distributed human intelligence that reflected the KWs’ collective judgment.
For each HIT, KWs were given some background information about colonic polyps and were shown a set of five images of the polyp candidate: two three-dimensional reconstructions of the polyp candidate with and without a blue CAD mark, and three two-dimensional CT scan sections from axial, sagittal, and coronal views, with a white square outlining each polyp candidate. The KWs were also shown sets of example images as part of training prior to evaluating the test cases: five labeled examples of true polyps and six examples of false polyps. Appendix E1 (online), along with Figures E1 through E5 (online), shows an example of a HIT, and Figures E6 through E16 (online) show example images for training. Real polyps (Figs E6–E10 [online], corresponding to images 1–5 in Appendix E1 [online]) are on the left, and fake polyps (Figs E11–E16 [online], corresponding to images 1–6 in Appendix E1 [online]) are on the right. Three-dimensional reconstructions were generated by using software for virtual colonoscopy (V3D-Colon; Viatronix, Stony Brook, NY). KWs were blinded to the proportion of polyp candidates that were true-positive and true-negative results in the data set.
Each KW was allowed to complete an assignment of labeling a specific polyp candidate only once, but there were no restrictions on the number of assignments that a KW could complete. The KWs were given a monetary reward of $0.01 U.S. dollar and a maximum of 20 minutes to complete each assignment. KWs needed to have an approval rating of greater than 95% on the MTurk platform to participate in this study. A KW’s approval rating is defined as the ratio of assignments approved by MTurk requesters to the total number of assignments submitted by a KW, and it is part of each KW’s MTurk profile. Each KW is identified only by an identification number assigned by the MTurk platform.
This entire experiment was conducted twice to assess for reproducibility and consistency between trials (22), with exactly 4 weeks between the start dates for the two trials. KWs were allowed to participate in both trials, but were not explicitly asked to do so, and could complete a particular HIT once for each trial.
Statistical Methods
The primary objective was to compare the area under the receiver operating characteristic (ROC) curve (AUC) of the KWs with the AUC of CAD for polyp classification. The unit of analysis for constructing the ROC curves was the CAD polyp candidates (detections). Sensitivity was defined as the fraction of true polyps correctly classified. Specificity was defined as the fraction of false polyps correctly classified. Polyp classification for CAD was based on the SVM score for each detection. Polyp classification for KWs was based on the combined KW score calculated as the ratio of votes for a true polyp to the total number of votes for each detection. Higher scores are expected to indicate higher confidence that the detection represents a true polyp. Empirical ROC curves were constructed and analyzed. AUCs were calculated as Wilcoxon-Mann-Whitney statistics. AUCs were compared by using a univariate z-score test statistic for correlation of areas from parametric ROC curves, for paired and unpaired data as appropriate, by using ROC analysis software (ROCKIT 0.9.1; Charles E. Metz, University of Chicago, Chicago, Ill) (23). Detections were assumed to be independent.
Several secondary analyses were performed. AUCs for KWs and CAD were compared for detections stratified by difficulty, as described above, and by size of true polyps at optical colonoscopy. AUCs were also compared for KWs who participated in both trial 1 and trial 2 to assess for improvements in performance between the two trials. Experiment characteristics, patterns of KW behavior, and distributions of KW scores were described and compared for the two trials. Confidence intervals (CIs) for rates were based on a normal approximation to the Poisson distribution. Proportions were compared with the Fisher exact test or the χ2 test with Yates correction. Means were compared with the Student t test. A difference with P ≤ .05 was considered significant.
Bootstrap statistical analysis was conducted to simulate the performance expected with fewer KWs per polyp candidate (24). This analysis was done by resampling, with replacement, of between three and 20 KWs for each polyp candidate to generate a new set of KW scores, and then calculating an AUC from the resulting empirical ROC curve. This procedure was repeated 10 000 times to generate a bootstrap distribution, which gives a robust estimate of the expected sampling distribution, for each number of KWs per polyp candidate.
All statistical analyses described above were also applied to a filtered-response data set that excluded assignments completed by KWs who voted for detections as true polyps more than 99% of the time and who completed at least 40 assignments, since these KWs were presumably unreliable.
All data collection and analyses were performed with the Amazon MTurk Web interface, a spreadsheet application (Microsoft Office Excel 12.0, Microsoft, Redmond, Wash), a database management system (Microsoft Office Access 12.0; Microsoft), and the ROC analysis software (ROCKIT). Numbers are reported as values ± standard deviation unless otherwise specified.
Results
Performance Comparison
The detection-level AUCs for KWs in trial 1, KWs in trial 2, and CAD are shown in Table 2. All of these AUCs were not significantly different from each other. Corresponding ROC curves are shown in Figure 1.
Table 2.
Detection-level AUCs for KWs in Trials 1 and 2 and CAD according to Detection Type
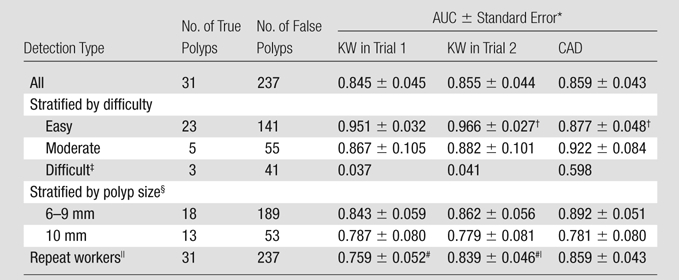
Results of statistical comparisons between AUCs for KWs in trial 1, KWs in trial 2, and CAD are all not significant except as noted.
AUC for easy detections for KWs in trial 2 is significantly higher than AUC for CAD (P = .039).
Statistical comparisons for difficult detections were not possible because of the small number of true detections, and thus no standard error was indicated.
Stratification was based on size of true polyps, as determined with optical colonoscopy. False polyps were grouped with true polyps from the same cases.
Repeat workers (n = 24) are KWs who participated in both trials 1 and 2.
AUC for all detections on the basis of votes from repeat workers significantly higher in trial 2 compared with trial 1 (P = .041).
Figure 1:

Comparison of ROC curves for CAD, KWs in trial 1, and KWs in trial 2. All three classifiers show similar performance, with AUCs of 0.859, 0.845, and 0.855, respectively.
Performance Stratified by Detection Difficulty
The detection-level AUCs for detections stratified by difficulty are shown in Table 2. For easy detections, the AUCs for KWs were higher than the AUC for CAD, reaching significance in trial 2. The AUCs for KWs for easy detections were higher than the AUCs for moderate detections, but they did not reach significance. For moderate detections, the AUCs for KWs were not significantly different from the AUC for CAD. Statistical comparisons for difficult detections were not calculated because of the small number of true detections. Corresponding ROC curves are shown in Figure E17 (online).
Performance Stratified by Polyp Size at Optical Colonoscopy
The detection-level AUCs for detections from cases with true polyps stratified by size are shown in Table 2. None of the AUC pairings were found to be significantly different.
Performance for Repeat Workers
Repeat workers are KWs who participated in both trial 1 and trial 2. The detection-level AUCs for the repeat workers are shown in Table 2. The AUC for repeat workers in trial 2 was significantly higher than the AUC for the same KWs in trial 1. The AUC for the repeat workers in trial 2 was not significantly different from the AUC for CAD. Corresponding ROC curves are shown in Figure E18 (online).
There were 24 repeat workers between trial 1 and trial 2, representing 16% of the 150 KWs in trial 1 and 24% of the 102 KWs in trial 2. Repeat workers accounted for 38% (2039 of 5360) of assignments completed in trial 1 and 39% (2098 of 5360) of assignments completed in trial 2, representing an average of 7.6 assignments per polyp candidate ± 1.2 (standard deviation) for trial 1 and 7.8 assignments per polyp candidate ± 0.9 (standard deviation) for trial 2. On average, repeat workers completed more assignments per trial, 85.0 assignments ± 101.9 (standard deviation) for trial 1 and 87.4 assignments ± 115.2 (standard deviation) for trial 2, than all KWs combined (P = .004 for trial 1).
Experiment Characteristics
For trial 1, all HITs were completed in 3.5 days. For trial 2, all HITs were completed in 3.0 days. The average submission rates were 64.0 (95% CI: 62.3, 65.7) and 73.7 (95% CI: 71.7, 75.6) assignments per hour for trial 1 and trial 2, respectively. The submission rates were steady throughout the experiment, with moderate diurnal variations.
KW Characteristics
There were 150 KWs who participated in trial 1 and 102 KWs who participated in trial 2. For trial 1, 68% (3646 of 5360) of all assignments were labeled as true polyps by KWs, compared with 66% (3534 of 5360) in trial 2. The average amount of time spent on each assignment was 35.5 seconds ± 53.3 (standard deviation) in trial 1 and 24.1 seconds ± 44.8 (standard deviation) in trial 2. There was no correlation found between KW accuracy and time spent on each assignment (R2 = 0.004). For KWs who completed more than 16 assignments, the mean sensitivity was 0.89 (standard deviation, 0.17; range, 0.33–1.00) and mean specificity was 0.36 (standard deviation, 0.27; range, 0–0.80).
On average, each KW completed 35.7 assignments ± 71.5 (standard deviation) in trial 1 and 52.5 assignments ± 90.6 (standard deviation) in trial 2. In trial 1, 57% (86 of 150) of KWs completed five or fewer assignments, compared with 53% (54 of 102) in trial 2. There were 11 and 15 KWs in trial 1 and trial 2, respectively, who each completed more than 200 assignments, representing 52% (2779 of 5360) of all completed assignments in trial 1 and 70% (3768 of 5360) of all completed assignments in trial 2. Although the majority of KWs completed five or fewer assignments, the KWs who each completed more than 200 assignments represented the majority of assignments completed (Fig E19 [online]).
KW Scores
Table 3 shows average KW scores from distributed human intelligence and average SVM scores from CAD for true detections, false detections, and detections stratified by difficulty and by polyp size at optical colonoscopy. The average KW score for true detections was significantly higher than the average KW score for false detections for trial 1 and trial 2 (P < .0001 for both trials).
Table 3.
Average KW Scores for True Detections, False Detections, and Detections Stratified by Difficulty and Polyp Size at Optical Colonoscopy
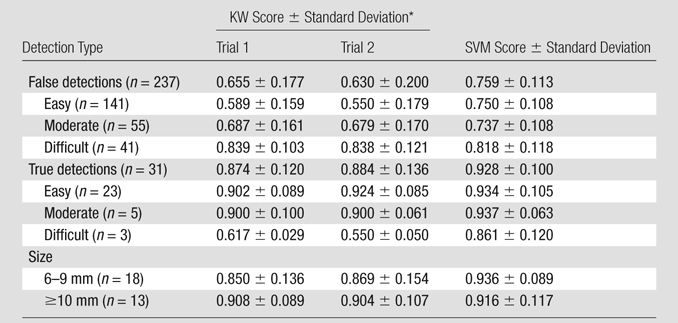
All P values comparing KW scores for trials 1 and 2 in each row were not significant.
When true polyps were stratified by difficulty, KW scores for easy and moderate detections were significantly higher than KW scores for difficult detections for both trials (P < .001 for all comparisons). When true polyps were stratified by size at optical colonoscopy, the average KW score for detections of 6–9-mm polyps was not significantly different from the average KW score for detections of 10 mm or larger polyps. When false polyps were stratified by difficulty, the average KW score for easy detections was significantly lower than the average KW score for moderate detections (P < .0001 for both trials), which was significantly lower than the average KW score for difficult detections (P < .0001 for both trials). The KW scores were not significantly different between trial 1 and trial 2 for all strata. Figure 2a shows the distribution of KW scores for true polyps and false polyps, stratified by difficulty.
Figure 2a:

Histogram of detections stratified according to KW score (calculated as ratio of votes for true polyp to total number of votes for each detection) for (a) true polyps (n = 31) and (b) false polyps (n = 237) in trial 1, illustrating the differences in the distribution of scores between true and false polyps. The detections are also stratified according to difficulty, shown as stacked bars, illustrating the shift in score distributions as difficulty changes. Similar histograms were obtained for trial 2 (Fig E20 [online]).
Figure 2b:

Histogram of detections stratified according to KW score (calculated as ratio of votes for true polyp to total number of votes for each detection) for (a) true polyps (n = 31) and (b) false polyps (n = 237) in trial 1, illustrating the differences in the distribution of scores between true and false polyps. The detections are also stratified according to difficulty, shown as stacked bars, illustrating the shift in score distributions as difficulty changes. Similar histograms were obtained for trial 2 (Fig E20 [online]).
How Many KWs Do You Need?
Bootstrap statistical techniques were used to show that 20 KWs per polyp candidate are sufficient to provide high-quality results (24). Figure 3 shows the expected AUC for a simulated range of three to 20 KWs per polyp candidate. As the number of KWs per polyp candidate increases, the incremental improvements in performance with each additional KW become progressively smaller. The AUC for 20 KWs per polyp candidate is not significantly different from the AUC for 10 KWs per polyp candidate (P = .395).
Figure 3:

Graph of results from bootstrap statistical analysis shows expected performance, as an AUC, for a simulated range of three to 20 KWs per polyp candidate. Expected AUC is shown with standard error bars in black, and 95% CI within the shaded region. The AUC increases as the number of KWs per polyp candidate increases, with smaller incremental improvements in performance as it approaches 20 KWs per polyp candidate. CIs also become narrower as the number of KWs per polyp candidate increases. For this analysis, data were used from trial 1. Similar results were obtained for trial 2 (Fig E21 [online]).
KW Filtering
When all of the statistical analyses presented above were applied to a filtered data set that excluded unreliable KWs (eight KWs in trial 1, seven in trial 2), there were no appreciable or significant differences in the results of any of the analyses when compared with analyses that included the complete data set; therefore, all analyses presented above are based on the complete data set.
Discussion
In this study, we evaluated the diagnostic performance and reliability of Internet-based distributed human intelligence compared with CAD, in the classification of colonic polyp candidates from CT colonographic data. We found that there was no significant difference in performance between minimally trained KWs from distributed human intelligence and the classifier in our CAD algorithm for polyps 6 mm or larger. More important, distributed human intelligence was able to achieve this level of performance with substantially fewer training cases than CAD. KWs were only shown 11 polyp candidates for training, whereas CAD was trained by using ground truth data for 2374 polyp candidates generated from 24 patients. A potential benefit is that the insights gained from the use of KWs may enable the development of CAD systems by using smaller reference databases. In addition, the time and cost associated with the development of such training databases could be further reduced by using KWs to label these large-scale data. In this study, we also found that distributed human intelligence is reliable and consistent because we only observed small, insignificant differences in performance metrics and in measured experimental and KW characteristics between the two trials, separated by 4 weeks.
Subgroup analysis at the level of the polyp candidate revealed several interesting findings. When the polyp candidates were stratified by difficulty, determined a priori on the basis of perceived difficulty for human classification, the KWs’ confidence in their classification, which was based on how closely the average KW scores approached extremes, correlated well with this stratification. As expected, easy polyp candidates were associated with high KW confidence and difficult polyp candidates were associated with low KW confidence. This was the case for true polyp detections, where easier detections received higher KW scores, and for false polyp detections, where easier detections received lower KW scores. Similar but weaker trends were observed for SVM scores from CAD.
These differences in KW confidence translated well into differences in performance. The AUC for classification of easy polyp candidates was higher than the AUCs for classification of moderate and difficult polyp candidates for both the KWs and CAD. In addition, since the differences between difficulty strata were less pronounced for CAD than for the KWs, the AUC for easy polyp candidates for the KWs was higher than that for CAD, reaching significance in trial 2. This performance advantage of KWs over CAD for easy polyp candidates suggests that there are certain features associated with easy polyp candidates—possibly related to shape, geometry, or location in the context of the local environment—that allow humans to easily classify the polyp candidates. In contrast, the CAD algorithm, which is strongly based on surface curvature (12), may not have evaluated the polyp candidates by using these same features, thus making it more difficult for CAD to distinguish between true and false polyps.
Similar trends were found when the polyp candidates were stratified by size, as determined with same-day optical colonoscopy. For both trials, the KW confidence was higher for polyps 10 mm or larger than for polyps 6–9 mm. This study was not sufficiently powered to detect significant differences in KW confidence and AUCs for polyp size strata.
The use of distributed human intelligence that is based on anonymous, minimally trained KWs represents a newer approach to colonic polyp classification. As a whole, distributed human intelligence was robust and efficient, with a steady assignment completion rate of one assignment per minute. In addition, despite the fact that most of the KWs from the two trials represented a completely different subset of individuals, there was a surprising amount of consistency between the trials with all measures, lending it credibility as a reproducible and predictable system.
At the individual level, however, KWs exhibited highly variable behavior and, thus, presumably gave different qualities of responses. The range of sensitivities and specificities was large, and we found no relationship between polyp classification accuracy and amount of time spent per assignment. It should also be noted that KW heterogeneity was not taken into account in the calculation of KW scores. Presumably, each KW has a different voting threshold level for selecting true polyp or false polyp. A different set of KWs would be expected to have a different distribution of threshold levels. Although this factor would be expected to have an effect on individual KW scores for each polyp candidate, we have shown experimentally that the overall performance is not affected, with consistent results between two trials. At present, we have not been able to identify a reliable method of normalizing KW votes or differentiating high-quality KWs from low-quality KWs.
Given the importance of quality control in these experiments, future work should focus on developing algorithms to identify and properly handle unreliable and low-quality KWs. Even though the bootstrap analysis indicated that the number of KWs per polyp candidate used in this study was sufficient to provide high-quality results, the use of additional KWs may still be beneficial to compensate for variability in the amount of noise from unreliable responses from low-quality KWs and to decrease the effects of heterogeneity in KW voting threshold levels. In this study, we chose to use the Amazon MTurk platform since it already has multiple measures in place to ensure KW quality and prevent common systematic abuses.
Other aspects of KW behavior are also important. In this study, we found that KWs who participated in both trials showed a significant improvement in performance between the two trials. Even though the KWs were not given feedback on their performance at any point, they were still able to develop an intuition in regard to the features associated with true polyps and false polyps. Future studies could focus on the mechanisms of cumulative performance improvements in the same subset of KWs.
It is also worthwhile to consider the nature of the task performed. The KWs in this experiment were presented with a relatively simple and narrowly defined visual task. Researchers in future studies would ideally identify and independently investigate different elementary components of an overall complex task to identify specific features of an image that would enable a marked improvement in the performance of the KWs. One potential application would be in the development of training programs for medical personnel in the reading of CT colonographic images with the assistance of CAD. Without proper training, the use of CAD systems can often lead to decreases in reader sensitivity and specificity. Such information from distributed human intelligence experiments could also be very valuable for informing the future development and improvement of CAD systems themselves. It may be possible to develop CAD systems that utilize unconventional features or combinations of features, require less training data, or perform substantially better.
Web-based crowdsourcing, available since approximately 2005, is a relatively recent phenomenon, with applications thus far being largely confined to business and social sciences research (25,26). As a means of conducting observer performance assessments, crowdsourcing in the form of distributed human intelligence is considerably more rapid and efficient than traditional recruitment methods that may require substantial financial resources and physical infrastructure. The usefulness of crowdsourcing as a tool in the broader scope of scientific research has only begun to be explored (27–30).
In this study, distributed human intelligence composed of minimally trained workers, was used as a classifier in conjunction with CAD-detected polyp candidates in CT colonography. We have already shown that distributed human intelligence is reliable and is able to perform high-quality colonic polyp classification. This study lays important groundwork for future improvements and expansions on the current experimental design. Areas of improvement may include implementation of additional qualification requirements for workers, incentivized rewards systems, newer visualization methods, optimization of polyp candidate presentation, and expanded nonbinary response options. In addition, since CAD and KWs each use different features to classify the polyp candidates, a fusion classifier that incorporates both of these may yield even better performance and may result in measurable reductions in false-positive rates. A proposed fusion classifier that is based on a-integration has been used on the data from this experiment and has shown promising results (31).
In summary, we have shown that the performance of distributed human intelligence is not significantly different from that of CAD for colonic polyp classification, and the use of distributed human intelligence may provide insights that guide future CAD development. We demonstrated the reliability of distributed human intelligence in two separate trials. We showed that there are differences in performance between subgroups, and we have illustrated areas where distributed human intelligence is able to outperform CAD. These results are promising and lay the foundation for future work that will improve on these methods. With additional KW training and other improvements in experimental design, we believe distributed human intelligence may perform better than CAD in more general circumstances and will be useful for decreasing CAD training requirements, allowing rapid observer performance assessments, providing insights into reader perception, reducing false-positive rates, and enabling improvements in CAD for CT colonography, as well as for other CAD applications.
Advance in Knowledge.
Distributed human intelligence performs accurate classification of colonic polyp candidates identified with computer-aided detection (CAD) for CT colonography, with a detection-level area under the receiver operating characteristic (ROC) curve of 0.845 ± 0.045 (standard error) and 0.855 ± 0.044 (standard error) by using ROC analysis in two separate trials.
Distributed human intelligence allows rapid observer performance assessments, completing the classification of 268 polyp candidates from 24 patients in 3.5 days and 3.0 days in two separate trials.
Implication for Patient Care.
The use of distributed human intelligence may lead to improvements for the development of CAD for CT colonography, as well as for other applications.
Disclosures of Potential Conflicts of Interest: T.B.N. Financial activities related to the present article: received grant through the Clinical Research Training Program, a public-private partnership supported jointly by the National Institutes of Health and Pfizer (via a grant to the Foundation for the National Institutes of Health from Pfizer). Financial activities not related to the present article: none to disclose. Other relationships: none to disclose. S.W. No potential conflicts of interest to disclose. V.A. No potential conflicts of interest to disclose. N.R. No potential conflicts of interest to disclose. M.M. No potential conflicts of interest to disclose. N.P. Financial activities related to the present article: none to disclose. Financial activities not related to the present article: author and institution have patent applications submitted in related areas for the National Institutes of Health and the Food and Drug Administration. Other relationships: none to disclose. J.E.B. No potential conflicts of interest to disclose. R.M.S. Financial activities related to the present article: none to disclose. Financial activities not related to the present article: received grant from iCAD Medical; author and institution receive royalties for a patent license from iCAD Medical and software license from Translational Sciences Corporation and have patents issued and pending in related areas. Other relationships: Viatronix provided the V3D-Colon software free of charge to author’s laboratory, and software was used in the submitted work; author’s laboratory is supported in part by a Cooperative Research and Development Agreement with iCAD; is a stockholder of Johnson & Johnson.
Supplementary Material
Acknowledgments
We thank Perry J. Pickhardt, MD, J. Richard Choi, ScD, MD, and William R. Schindler, DO, for providing CT colonography data, Viatronix for providing Viatronix V3D-Colon software, Andrew J. Dwyer, MD, for critical review of the manuscript, and Sandy Napel, PhD, and Christopher F. Beaulieu, MD, PhD, for helpful discussions.
Received May 11, 2011; revision requested June 15; final revision received July 26; accepted September 13; final version accepted September 26.
Funding:This research was supported by the National Institutes of Health. T.B.N., S.W., V.A., N.R., M.M., J.E.B., and R.M.S. are employees of the National Institutes of Health.
S.W., V.A., N.R., M.M., J.E.B., and R.M.S. supported by the Intramural Research Programs of the National Institutes of Health, Clinical Center. T.B.N. supported in part through the Clinical Research Training Program, a public-private partnership supported jointly by the National Institutes of Health and Pfizer (via a grant to the Foundation for the National Institutes of Health from Pfizer).
The mention of commercial entities, or commercial products, their sources, or their use in connection with material reported herein is not to be construed as either an actual or implied endorsement of such entities or products by the Department of Health and Human Services.
Abbreviations:
- AUC
- area under the ROC curve
- CAD
- computer-aided detection
- CI
- confidence interval
- HIT
- human intelligence task
- KW
- knowledge worker
- ROC
- receiver operating characteristic
- SVM
- support vector machine
References
- 1.Jemal A, Siegel R, Xu J, Ward E. Cancer statistics, 2010. CA Cancer J Clin 2010;60(5):277–300 [DOI] [PubMed] [Google Scholar]
- 2.Smith RA, Cokkinides V, Brooks D, Saslow D, Brawley OW. Cancer screening in the United States, 2010: a review of current American Cancer Society guidelines and issues in cancer screening. CA Cancer J Clin 2010;60(2):99–119 [DOI] [PubMed] [Google Scholar]
- 3.Dachman AH, Obuchowski NA, Hoffmeister JW, et al. Effect of computer-aided detection for CT colonography in a multireader, multicase trial. Radiology 2010;256(3):827–835 [DOI] [PMC free article] [PubMed] [Google Scholar]
- 4.Taylor SA, Charman SC, Lefere P, et al. CT colonography: investigation of the optimum reader paradigm by using computer-aided detection software. Radiology 2008;246(2):463–471 [DOI] [PubMed] [Google Scholar]
- 5.Hock D, Ouhadi R, Materne R, et al. Virtual dissection CT colonography: evaluation of learning curves and reading times with and without computer-aided detection. Radiology 2008;248(3):860–868 [DOI] [PubMed] [Google Scholar]
- 6.Petrick N, Haider M, Summers RM, et al. CT colonography with computer-aided detection as a second reader: observer performance study. Radiology 2008;246(1):148–156 [DOI] [PubMed] [Google Scholar]
- 7.Summers RM. Improving the accuracy of CTC interpretation: computer-aided detection. Gastrointest Endosc Clin N Am 2010;20(2):245–257 [DOI] [PMC free article] [PubMed] [Google Scholar]
- 8.Summers RM. How perceptual factors affect the use and accuracy of CAD for interpretation of CT images. In: Samei E, Krupinski E, eds. The handbook of medical image perception and techniques. Cambridge, England: Cambridge University Press, 2009; 311–319 [Google Scholar]
- 9.Pickhardt PJ, Choi JR, Hwang I, et al. Computed tomographic virtual colonoscopy to screen for colorectal neoplasia in asymptomatic adults. N Engl J Med 2003;349(23):2191–2200 [DOI] [PubMed] [Google Scholar]
- 10.Pickhardt PJ, Choi JH. Electronic cleansing and stool tagging in CT colonography: advantages and pitfalls with primary three-dimensional evaluation. AJR Am J Roentgenol 2003;181(3):799–805 [DOI] [PubMed] [Google Scholar]
- 11.Summers RM, Yao J, Pickhardt PJ, et al. Computed tomographic virtual colonoscopy computer-aided polyp detection in a screening population. Gastroenterology 2005;129(6):1832–1844 [DOI] [PMC free article] [PubMed] [Google Scholar]
- 12.Summers RM, Beaulieu CF, Pusanik LM, et al. Automated polyp detector for CT colonography: feasibility study. Radiology 2000;216(1):284–290 [DOI] [PubMed] [Google Scholar]
- 13.Summers RM, Johnson CD, Pusanik LM, Malley JD, Youssef AM, Reed JE. Automated polyp detection at CT colonography: feasibility assessment in a human population. Radiology 2001;219(1):51–59 [DOI] [PubMed] [Google Scholar]
- 14.Summers RM, Jerebko AK, Franaszek M, Malley JD, Johnson CD. Colonic polyps: complementary role of computer-aided detection in CT colonography. Radiology 2002;225(2):391–399 [DOI] [PubMed] [Google Scholar]
- 15.Jerebko AK, Malley JD, Franaszek M, Summers RM. Computer-aided polyp detection in CT colonography using an ensemble of support vector machines. In: Lemke HU, Vannier MW, Inamura K, Farman AG, Doi K, Reiber JHC, eds. CARS 2003 Computer Assisted Radiology and Surgery. Proceedings of the 17th International Congress and Exhibition. London, England: Elsevier, 2003;1019–1024 [Google Scholar]
- 16.Malley JD, Jerebko AK, Miller MT, Summers RM. Variance reduction for error estimation when classifying colon polyps from CT colonography. In: Clough AV, Amini AA, eds. SPIE medical imaging. San Diego, Calif: SPIE, 2003; 570–578 [Google Scholar]
- 17.Yao J, Summers RM. 3D colonic polyp segmentation using dynamic deformable surfaces. In: Amini AA, Manduca A, eds. SPIE medical imaging. San Diego, Calif: SPIE, 2004; 280–289 [Google Scholar]
- 18.Iordanescu G, Pickhardt PJ, Choi JR, Summers RM. Automated seed placement for colon segmentation in computed tomography colonography. Acad Radiol 2005;12(2):182–190 [DOI] [PubMed] [Google Scholar]
- 19.Summers RM, Franaszek M, Miller MT, Pickhardt PJ, Choi JR, Schindler WR. Computer-aided detection of polyps on oral contrast-enhanced CT colonography. AJR Am J Roentgenol 2005;184(1):105–108 [DOI] [PubMed] [Google Scholar]
- 20.Bunch PC, Hamilton JF, Sanderson GK, Simmons AH. A free-response approach to the measurement and characterization of radiographic-observer performance. J Appl Photogr Eng 1978;4(4):166–171 [Google Scholar]
- 21.Chakraborty DP. Validation and statistical power comparison of methods for analyzing free-response observer performance studies. Acad Radiol 2008;15(12):1554–1566 [DOI] [PMC free article] [PubMed] [Google Scholar]
- 22.Li Q, Doi K. Reduction of bias and variance for evaluation of computer-aided diagnostic schemes. Med Phys 2006;33(4):868–875 [DOI] [PubMed] [Google Scholar]
- 23.Metz CE, Herman BA, Shen JH. Maximum likelihood estimation of receiver operating characteristic (ROC) curves from continuously-distributed data. Stat Med 1998;17(9):1033–1053 [DOI] [PubMed] [Google Scholar]
- 24.Shalizi C. The bootstrap. Am Sci 2010;98:186–190 [Google Scholar]
- 25.Howe J. The rise of crowdsourcing. Wired 2006; 14(6). http://www.wired.com/wired/archive/14.06/crowds.html. Accessed November 23, 2010
- 26.Paolacci G, Chandler J, Ipeirotis PG. Running experiments on Amazon Mechanical Turk. Judgm Decis Mak 2010;5(5):411–419 [Google Scholar]
- 27.Brabham DC. Crowdsourcing as a model for problem solving: an introduction and cases. Convergence 2008;14(1):75–90 [Google Scholar]
- 28.Oprea TI, Bologa CG, Boyer S, et al. A crowdsourcing evaluation of the NIH chemical probes. Nat Chem Biol 2009;5(7):441–447 [DOI] [PMC free article] [PubMed] [Google Scholar]
- 29.Johnston SC, Hauser SL. Crowdsourcing scientific innovation. Ann Neurol 2009;65(6):A7–A8 [DOI] [PubMed] [Google Scholar]
- 30.Raykar VC, Yu S, Zhao LH, et al. Learning from crowds. J Mach Learn Res 2010;11:1297–1322 [Google Scholar]
- 31.Wang S, Anugu V, Nguyen TB, et al. Fusion of machine intelligence and human intelligence for colonic polyp detection in CT colonography. In: Biomedical imaging: from nano to macro, 2011 IEEE International Symposium on. Chicago, Ill: IEEE, 2011; 160–164 [Google Scholar]
Associated Data
This section collects any data citations, data availability statements, or supplementary materials included in this article.