By using compressive sensing–based reconstruction, we have demonstrated a potential reduction in acquisition time by up to 80% or more for hydrogen 1 MR spectroscopic imaging, with negligible loss of information as evaluated on the basis of clinically relevant metrics.
Abstract
Purpose:
To retrospectively evaluate the fidelity of magnetic resonance (MR) spectroscopic imaging data preservation at a range of accelerations by using compressed sensing.
Materials and Methods:
The protocols were approved by the institutional review board of the university, and written informed consent to acquire and analyze MR spectroscopic imaging data was obtained from the subjects prior to the acquisitions. This study was HIPAA compliant. Retrospective application of compressed sensing was performed on 10 clinical MR spectroscopic imaging data sets, yielding 600 voxels from six normal brain data sets, 163 voxels from two brain tumor data sets, and 36 voxels from two prostate cancer data sets for analysis. The reconstructions were performed at acceleration factors of two, three, four, five, and 10 and were evaluated by using the root mean square error (RMSE) metric, metabolite maps (choline, creatine, N-acetylaspartate [NAA], and/or citrate), and statistical analysis involving a voxelwise paired t test and one-way analysis of variance for metabolite maps and ratios for comparison of the accelerated reconstruction with the original case.
Results:
The reconstructions showed high fidelity for accelerations up to 10 as determined by the low RMSE (, 0.05). Similar means of the metabolite intensities and hot-spot localization on metabolite maps were observed up to a factor of five, with lack of statistically significant differences compared with the original data. The metabolite ratios of choline to NAA and choline plus creatine to citrate did not show significant differences from the original data for up to an acceleration factor of five in all cases and up to that of 10 for some cases.
Conclusion:
A reduction of acquisition time by up to 80%, with negligible loss of information as evaluated with clinically relevant metrics, has been successfully demonstrated for hydrogen 1 MR spectroscopic imaging.
© RSNA, 2012
Introduction
Magnetic resonance (MR) spectroscopic imaging has been increasingly used in clinical research to assess therapy and aid in diagnosis (1–3). It is well established that malignant prostate and brain tumors express increased levels of choline (4). It also has been demonstrated that brain tumors express decreased levels of N-acetylaspartate (NAA) and creatine, which leads to the use of a choline-to-NAA index as a cancer biomarker (4–7). Similarly, a useful biomarker for prostate cancer is the ratio of the sum of choline and creatine to citrate. It has been extensively shown that citrate levels decrease while choline levels increase in malignant prostate tumors (4).
The advantages of multivoxel (two- and three-dimensional) spectroscopy over single-voxel spectroscopy are widely established (7,8). It is possible to obtain better localization of metabolic abnormality and observe changes in regions originally outside the morphologic lesion by using multivoxel MR spectroscopy. However, the major disadvantage of this technique is the longer acquisition time, which is a barrier for routine clinical use (7–9). Compressive sensing (10,11) provides an innovative approach to undersample k-space by exploiting the underlying sparsity in the appropriate transform domain (eg, wavelet transform), thereby reducing the number of samples required for reconstruction of MR data. This has been demonstrated with various MR methods such as brain imaging, MR angiography (10), radial imaging (11), cardiac cine imaging (12), and dynamic contrast material–enhanced imaging (13), among other MR methods. Application of compressed sensing for MR spectroscopic imaging is apt because data are sparse in multiple dimensions of frequency and space in transform domains of wavelets and total variation. Wavelet-based analyses including quantification, spectral editing, and denoising have been applied to MR spectroscopy (14–17). Fast MR spectroscopic imaging has also been accomplished by the use of wavelets to enable compression in the spectral and spatial domains, which exploits the sparsity existing in this transform domain (18,19). The purpose of this study was to retrospectively evaluate the fidelity of MR spectroscopic imaging data preservation at a range of accelerations by using compressed sensing.
Materials and Methods
This study was performed retrospectively on two-dimensional hydrogen 1 (1H) MR spectroscopic imaging data from six healthy volunteers, two patients with brain tumor (malignant glioma), and two patients with prostate cancer. The protocols were approved by the institutional review board of the university, and written informed consent to acquire and analyze MR spectroscopic imaging data was obtained from the subjects prior to imaging. This study was Health Insurance Portability and Accountability Act compliant. MR parameters for these acquisitions are detailed in Table 1.
Table 1.
MR Acquisition Parameters of the Data Sets Used in the Study

Note.—All data sets were acquired with a point-resolved spatially localized spectroscopy–based sequence with 1024 points in the temporal dimension.
MR Spectroscopic Imaging Data and Undersampling
The original data sets were normalized to a range of 0 to 1, and a k-space undersampled in the phase-encode directions was obtained by using a sampling mask generated on the basis of the acceleration factor (two, three, four, five, and 10) and variable density sampling. The mask was generated by picking random samples weighted by a two-dimensional probability density function, resulting in more samples in the center of k-space than at the edges (11). The extent of the fully sampled center of the chosen probability density function was dependent on the inverse of the acceleration factor (ie, smaller fully sampled region for higher acceleration).
Reconstruction
The undersampled k-space was zero filled and subjected to inverse Fourier transform to obtain an initial estimate of the desired MR spectroscopic imaging data. The reconstruction of the MR spectroscopic imaging data set was cast as a convex optimization problem by minimizing the following cost function Є (modified from Lustig et al [11])
by using a custom implementation of the nonlinear conjugate gradient algorithm by using Matlab (MathWorks, Natick, Mass), where m is the desired MR spectroscopic imaging data, Fu is the Fourier transform operator, y is the measured k-space data, W is the wavelet transform operator, and TV is the total variation operator; ‖ ‖1 and ‖ ‖2 are the L1 and L2 norm operators, respectively; lL1 and lTV are regularization parameters for the L1 term and total variation term, respectively. The Daubechies wavelet transform (20) was used to encode each of the two dimensions of the kx 2 t matrix at all points in ky. The values for the regularization terms lL1 and lTV were experimentally determined to be 0.001 and 0.005, respectively. The reconstruction was subject to eight iterations to obtain convergence in the value of the cost function.
Error Metric
The error of reconstruction was quantified by the root mean square error (RMSE) metric computed as
 |
where N is the total number of data points in an MR spectroscopic imaging data set, y is the data reconstructed from full k-space, and y9 is the reconstructed data from undersampled k-space. Because the data range was normalized to vary from 0 to 1, RMSE is equivalent to the commonly used normalized RMSE.
Postprocessing
The MR spectroscopic imaging data sets were subjected to the following minimal processing steps in Java-based MR user interface (jMRUI; http://www.mrui.uab.es/mrui/mrui_Overview.shtml) (21): (a) apodization to remove existing truncation artifacts, (b) baseline correction, (c) time-domain Hankel-Lanczos singular value decomposition filtering of residual water and fat peaks, (d) automated zero-order global-phase correction, and (e) generation of metabolite maps by using the quantitation based on quantum estimation (QUEST) algorithm (22) from the “real” part of the phased MR spectroscopic spectrum, where metabolite map intensities represent contributions of the respective spectral components in the QUEST fit. In the case of brain MR spectroscopic imaging data (healthy and cancer), only the region interior to the brain was analyzed. The total number of voxels used for further analysis was 600, 163, and 36 for the healthy brain, brain tumor, and prostate cancer data sets, respectively. For the ratio calculations, voxels with a denominator of 0 (signifying a lack of deterministic solution in the QUEST fit) in the original data or compressed-sensing–reconstructed data were set to 0.
Statistical Analysis
The metabolite map intensities for each reconstruction and relevant metabolite ratios (choline-to-NAA index for healthy brain and brain tumor, choline plus creatine–to-citrate ratio for prostate cancer) were subjected to a voxelwise two-tailed paired t test (Excel; Microsoft, Redmond, Wash) to compare with the acceleration factor of one (original) case. In addition, one-way repeated-measures analysis of variance was performed followed by a Bonferroni multiple comparison test to further evaluate the effect of correlations among the reconstruction for the acceleration values chosen (GraphPad Prism; GraphPad Software, La Jolla, Calif). The resulting t values from the Bonferroni test were converted into P values (Excel; Microsoft). A P value less than .05 was considered to indicate a statistically significant difference.
Results
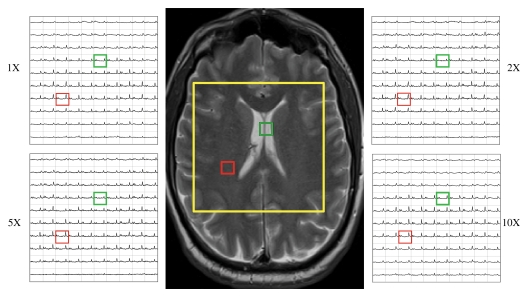
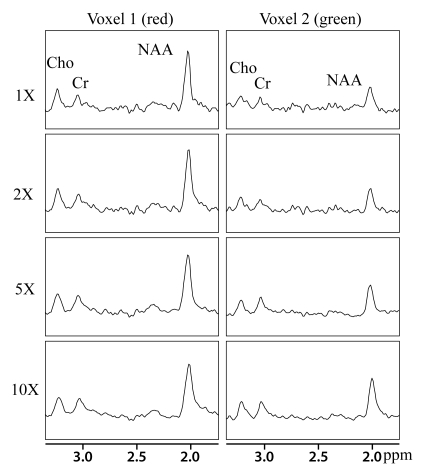
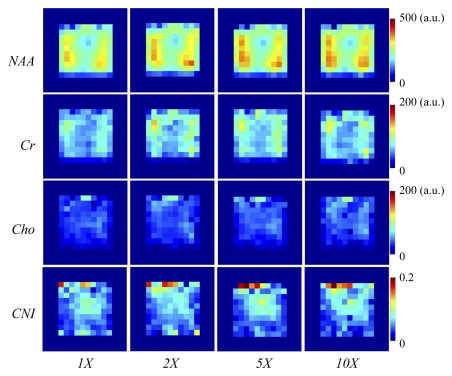
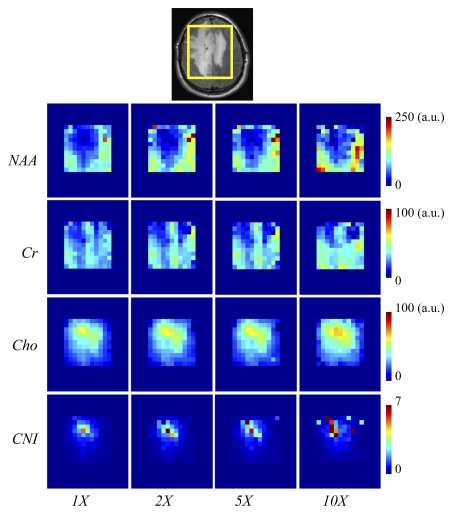
The results of the reconstruction of a representative healthy brain MR spectroscopic imaging data set are shown in Figures 1 and 2. Figure 1 shows the MR spectroscopic imaging grids corresponding to a region shown on the anatomic scout image at different acceleration factors. The reconstructed MR spectroscopic imaging data exhibited similar spatial profiles as that of the original over the range of accelerations. The green and red boxes represent the locations of two voxels chosen to inspect the quality of the reconstructed spectra in Figure 2. The voxel overlapping the ventricles (green box) showed reduced concentrations of NAA, creatine, and choline (right column of Figure 2) compared with the metabolite levels in the other voxel (red box), as was expected. The reconstructed spectra for the accelerated factors in Figure 2 are similar to that of the original. It can be observed that the compressed-sensing reconstruction preserves the line shape of the original data as well, but spectra are smoother at higher acceleration. Figure 3 shows the metabolite maps of NAA, creatine, choline (reflecting area under the peak), and choline-to-NAA index as a function of acceleration. The hyperintensities on the original and reconstructed cases occur in similar locations. However, at an acceleration factor of 10, the metabolite maps show increased intensity compared with the original.
Figure 1:
Reconstruction of the data grid for a representative brain MR spectroscopic imaging data set for the acceleration factors of one (1X), two (2X), five (5X), and 10 (10X). Center: Anatomic MR image shows MR spectroscopic imaging region of interest (yellow square) that corresponds to grids. Two locations (red and green voxels) are further examined in Figure 2.
Figure 2:
Spectra from two selected voxels (red and green voxels from Fig 1) from a representative brain MR spectroscopic imaging data set for the acceleration factors of one (1X), two (2X), five (5X), and 10 (10X). The y-axis limits for all the plots are 20.25 to 1. Cho = choline, Cr = creatine.
Figure 3:
Comparative metabolite maps of NAA, creatine (Cr), choline (Cho), and choline-to-NAA index (CNI) for a healthy brain data set for the acceleration factors of one (1X), two (2X), five (5X), and 10 (10X). The yellow box on the MR anatomic image (Fig 1) indicates the MR spectroscopic imaging region of interest depicted on the maps. a.u. = arbitrary unit.
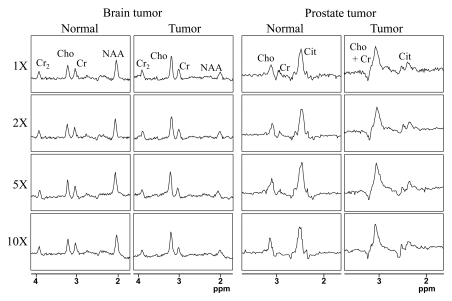
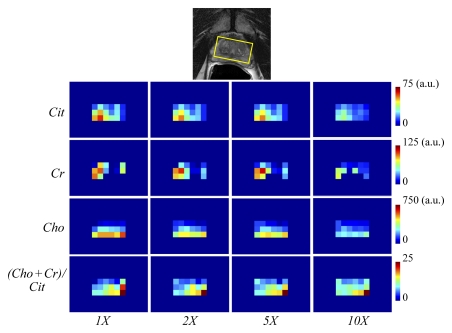
The original and compressed-sensing–reconstructed brain tumor MR spectroscopic imaging data set for two voxels representing normal tissue and cancer tissue are shown in Figure 4a. The different metabolite profile that discriminates normal brain tissue from cancerous tissue has been faithfully preserved for the results of reconstruction up to an acceleration factor of 10. Figure 4 depicts the reconstruction of two voxels representing normal tissue and cancer tissue from a prostate cancer MR spectroscopic imaging data set. The compressed-sensing–reconstructed spectra maintained fidelity of the different metabolic profiles for both the normal prostate and prostate tumor cases. The metabolite maps generated on the basis of these reconstructions are shown in Figure 5a and Figure 5b as a function of acceleration. For the brain tumor data set, the metabolite and choline-to-NAA index maps for accelerations of two and five maintained high fidelity, while those at 10 showed increased deviation from the original data. For the prostate cancer data set, a decrease in intensity was seen on the metabolite maps as a function of acceleration, but the ratio map of choline plus creatine to citrate for the prostate cancer data set displayed high fidelity even up to 10, particularly for hot-spot localization.
Figure 4:
Spectra from two selected voxels from representative (left) brain tumor and (right) prostate cancer MR spectroscopic imaging data sets for the acceleration factors of one (1X), two (2X), five (5X), and 10 (10X). In each case, the left column shows a voxel from healthy tissue, while the right column shows a voxel in the tumor-bearing region. The y-axis limits for all the plots are 20.25 to 1. Cho = choline, Cit = citrate, Cr = methyl signal of total creatine, Cr2 = methylene signal of total creatine.
Figure 5a:
Comparative metabolite and ratio maps from (a) brain tumor (NAA, creatine [Cr], choline [Cho]) and (b) prostate cancer (citrate [Cit], creatine, choline) MR spectroscopic imaging data sets for the acceleration factors of one (1X), two (2X), five (5X), and 10 (10X). Ratio maps depict choline-to-NAA index (CNI) for the brain tumor data and (choline + creatine)/citrate for the prostate cancer data. Top: Yellow box on anatomic MR images indicate the MR spectroscopic imaging region of interest depicted on the maps. a.u. = arbitrary unit.
Figure 5b:
Comparative metabolite and ratio maps from (a) brain tumor (NAA, creatine [Cr], choline [Cho]) and (b) prostate cancer (citrate [Cit], creatine, choline) MR spectroscopic imaging data sets for the acceleration factors of one (1X), two (2X), five (5X), and 10 (10X). Ratio maps depict choline-to-NAA index (CNI) for the brain tumor data and (choline + creatine)/citrate for the prostate cancer data. Top: Yellow box on anatomic MR images indicate the MR spectroscopic imaging region of interest depicted on the maps. a.u. = arbitrary unit.
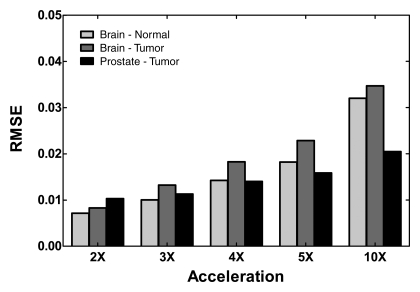
Means ± standard deviations calculated for each metabolite at acceleration factors of one, two, five, and 10 are reported in Table 2. The means of these metabolites were comparable at factors of two and five, while the results at a factor of 10 showed statistically significant differences in six of the nine metabolite maps compared with the original data. The means for the ratio maps were also similar to the original, demonstrating that there were no significant changes in the values of the critical biomarkers up to a factor of five for the healthy brain and brain tumor data and up to a factor of 10 for the prostate cancer data. The P values resulting from one-way analysis of variance followed by a Bonferroni test are shown in Table 3. The values indicated a strong correlation between acceleration factors of one, two, and five, while correlations between 10 and the other accelerations were significantly weaker, resulting in a lower P value. The errors of reconstruction quantified by using the RMSE metric for the three data types at the five acceleration factors can be seen in Figure 6. The RMSE values increased with increase in acceleration, as was expected, but it remained below 0.05 for accelerations up to 10.
Table 2.
Metabolite Intensities and Ratios for the Pooled Voxel Data for Normal Brain, Brain Tumor, and Prostate Cancer as a Function of Acceleration
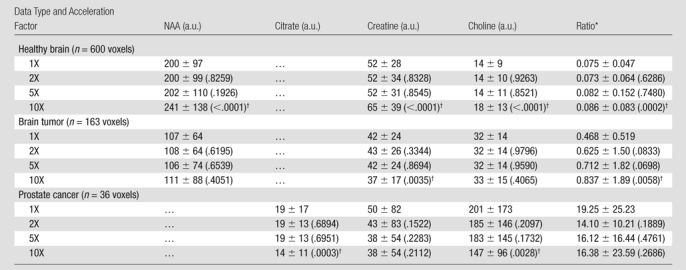
Note.—Data are means ± standard deviations. P values greater than .0001 are in parentheses.
Ratio data are choline-to-NAA index for brain (normal and tumor) data and (choline + creatine)/citrate for prostate cancer data.
P value less than .05, according to two-tailed paired t test.
Table 3.
P Values Resulting from One-Way Analysis of Variance Followed by Bonferroni Comparison Test
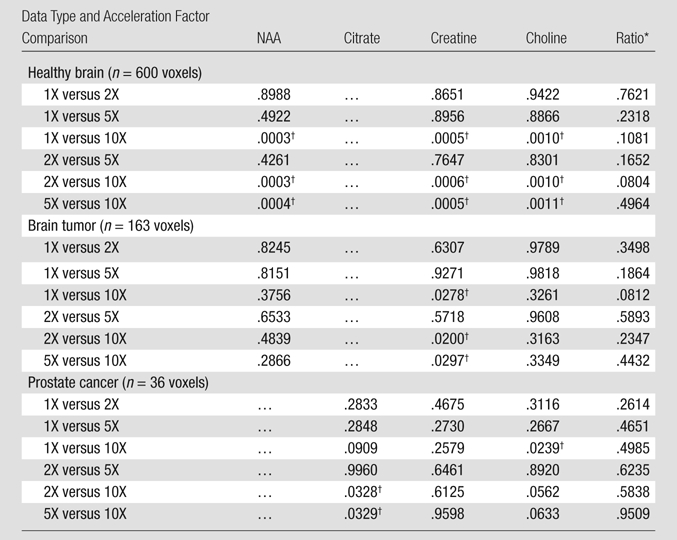
Ratio data are choline-to-NAA index for brain (normal and tumor) data and (choline + creatine)/citrate for prostate cancer data.
P value less than .05.
Figure 6:
Graph of RMSE values for MR spectroscopic imaging data according to acceleration factors of two (2X), three (3X), four (4X), five (5X), and 10 (10X) in comparison with the original data.
Discussion
The goal of our study was to investigate an approach to accelerate 1H MR spectroscopic imaging acquisition without loss of information, with a view to facilitate widespread integration of 1H MR spectroscopic imaging into standard clinical protocols. By using compressive sensing–based reconstruction, we have demonstrated a potential reduction in acquisition time by up to 80% or more for 1H MR spectroscopic imaging, with negligible loss of information as evaluated on the basis of clinically relevant metrics.
The reconstructed spectra displayed lesser noise than the original spectra. This can be attributed to the denoising quality of the wavelets and the smoothing effect of the total variation factor in the reconstruction. As demonstrated, the implemented reconstruction method is able to generate metabolite maps similar to the original case. The metabolite maps generated by using MR spectroscopic imaging hold diagnostic and prognostic importance, and the reconstruction preserves this information content faithfully. The high standard deviation in the metabolite intensities in our original data sets (acceleration factor of one), even for normal brain, resulted inherently from the placement of the acquisition grid over the entire brain, including the cerebrospinal fluid (Figs 2, 3). Apart from visual inspection of the maps, paired t tests and one-way analysis of variance allow comparison of information content at a given location between fully sampled and compressed-sensing–reconstructed undersampled data at various accelerations. As we are testing for fidelity and nonsignificant differences rather than significant differences between accelerations and the original, a P value threshold of .05 is a stricter criterion than a P value of, say, .01, because a P value less than .05 indicates significant differences from the original, which would mean that the reconstruction algorithm has failed. The results of our approach also showed that the reconstructions do not cause a change in these biomarkers such as choline-to-NAA index and choline-to-citrate ratio. Therefore, the reconstruction also maintains fidelity in such derived parameters as well. The statistical analyses indicated that the reconstructions at a factor of five are similar to the original and the differences are statistically insignificant. However, at a factor of 10, the reconstructions showed increased error and differences in the biomarker values. On the other hand, the RMSE values computed on the reconstructed time-domain data for these data sets remained below 0.05 for accelerations up to 10. Given that the original data sets were normalized before undersampling, this reflects an error of less than 5% for the reconstructions up to a factor of 10. Conversion of acquired MR spectroscopic imaging time-domain data to metabolite information is a complicated process involving many user-chosen steps that can potentially influence the appearance of final metabolite maps. Minimal postprocessing of the original and compressed-sensing–reconstructed data allows us to evaluate the fidelity of the reconstruction objectively, but it is possible that the differences observed on the maps at higher accelerations may result from differences in the automated global-phase correction. When looking at the trends in metabolite map intensity, for the brain data, it was observed that the intensity goes up with acceleration factor, whereas for the prostate case, the intensity goes down with acceleration factor. Deviations in either direction are possible based on various factors such as the regularization parameters, grid size, and signal-to-noise ratio of the sampled k-space; therefore, this is not a trend that is being proposed. For a given set of regularization parameters and acceleration factor, optimization routines result in increased error with increased acceleration, as has been noticed by increasing RMSE value. Thus, the estimates of the concentrations tend to move further away from the original as acceleration is increased. From the perspective of applicability of the proposed method, we are reassured by the observation that the deviations in intensity remain monotonic functions of acceleration (ie, either increasing or decreasing on increasing undersampling) and RMSE remains small even at a factor of 10.
Several other fast chemical shift imaging and spectroscopic imaging approaches have been developed in the past and compared theoretically (23) and experimentally (24). In particular, echo-planar spectroscopic imaging (25,26) is a powerful spectroscopic imaging technique that remains underutilized in the clinic (27). This method speeds up spectroscopic imaging by echo-planar readout of one spectral and one spatial dimension, thereby achieving an acceleration factor equal to the number of points in that spatial dimension. For example, a 16 3 16 two-dimensional matrix would take 16 times less time with echo-planar spectroscopic imaging as with conventional chemical shift imaging. However, the speedup may be at the expense of signal-to-noise ratio (27), and spectra could be affected by Nyquist ghost artifacts (28). The undersampling approach we have proposed involves omission of specific phase-encode values, which is easily implementable with two- or three-dimensional chemical shift imaging sequences as well as with echo-planar spectroscopic imaging. Thus, further reduction in imaging time is possible in most fast spectroscopic imaging sequences by the incorporation of a compressed-sensing method. It has been shown that undersampling in increased dimensions allows for more efficient exploitation of inherent sparsity and results in improved reconstructions for compressed sensing (11). For MR spectroscopic imaging data, the sparsity in the spectral dimension exceeds that in the spatial dimensions alone. Obtaining randomly sampled data in the phase encode as well as time dimension requires complex pulse sequences involving fast switching gradients. This has also been demonstrated in the application of compressed sensing for the reconstruction of hyperpolarized carbon 13 MR spectroscopic imaging data (19). However, the decrease in acquisition time due to undersampling in the temporal dimension alone is marginal compared with that obtained due to undersampling of the phase-encode directions, and the acceleration factor is not directly representative of the undersampling factor except for echo-planar acquisitions. We have focused in this study on accelerating conventional MR spectroscopic imaging acquisition protocols that are routinely available in the clinic, but the application is not limited to these as discussed previously.
An important concern for the application of any new reconstruction technique to spectroscopic imaging is the effect on the point-spread function and the related bleed-through of information from one spatial location to another. The nature of the point-spread function and the transform point spread function for compressed sensing in MR imaging has been discussed in detail by Lustig et al (11). The transform point spread function for the three-dimensional Fourier transform case described therein is analogous to our two-dimensional MR spectroscopic imaging case with the temporal (free induction decay or echo) data being the dimension that is completely acquired as analogous to the readout direction in addition to two spatial phase-encode directions. The advantage of compressed sensing is that the incoherent sampling avoids aliasing artifacts (as seen with echo-planar imaging and echo-planar spectroscopic imaging) (11), and the net effect is a noiselike scatter of intensities all over the field of view as opposed to a coherent broadening of the point-spread function and corresponding bleed-through of information into neighboring voxels.
A limitation of the current study was that it was performed retrospectively on clinical data acquired previously. While retrospective reconstruction is an important first step to determine the feasibility of our approach, a necessary follow-up step would be prospective studies in healthy volunteers where the proposed undersampling scheme is implemented with clinical imagers and data acquired, reconstructed, and compared at various undersampling factors. Other directions for improvement could be extension to three-dimensional MR spectroscopic imaging and the design of new reconstruction routines to exploit sparsity in the spectral dimension along with spatial sparsity and achieve even higher acceleration, particularly for three-dimensional MR spectroscopic imaging.
In summary, the results indicated insignificant loss of information for an acceleration of up to five, which translates to a saving of up to 80% of acquisition time. This would potentially enable increased use of MR spectroscopic imaging protocols in the clinic. Acceleration obtained by using this approach could be extended for MR spectroscopic imaging data of other organs such as the breast. Alternatively, the reduced acquisition time per acquisition could also be used to acquire spectra with harder-to-detect metabolites such as glycine (29) through increased averaging.
Advances in Knowledge.
Compressed sensing could reduce acquisition time of clinical hydrogen 1 (1H) MR spectroscopic imaging by 80%, while maintaining high fidelity (root mean square error < 0.05) for these undersampled reconstructions compared with full data reconstruction.
The approach is capable of preserving the fidelity of MR spectroscopic imaging biomarkers at an acceleration of five or higher, as shown by the statistically insignificant difference (P > .05) between biomarker metabolite maps resulting from accelerated reconstructions and those from the original case.
Implication for Patient Care.
Reduction of time spent by the patient in the imager could increase throughput and/or allow for appending more protocols in a given time frame.
Disclosures of Potential Conflicts of Interest: S.G. No potential conflicts of interest to disclose. H.M.B. No potential conflicts of interest to disclose. S.K.G. No potential conflicts of interest to disclose. Y.D. No potential conflicts of interest to disclose. E.A.M. No potential conflicts of interest to disclose. R.D.S. No potential conflicts of interest to disclose. C.C. No potential conflicts of interest to disclose. M.A.L. No potential conflicts of interest to disclose. V.D.K. No potential conflicts of interest to disclose.
Acknowledgments
We thank our UT Southwestern colleagues Richard Briggs, PhD, and Robert Haley, MD, for providing the data from healthy volunteers, Xian-Jin Xie, PhD, for review of our statistical analyses design, and Glenn Katz, BA, for assistance with figures.
Received May 27, 2011; revision requested July 11; revision received August 8; accepted September 12; final version accepted October 18.
V.D.K. supported by Norman Hackerman grant 010019-0056-2007. Supported by Department of Defense grant DAMD 17-01-1-0741 and Department of Veterans Affairs Indefinite Delivery/Indefinite Quantity contract VA549-P-0027.
The contents are solely the responsibility of the authors and do not necessarily reflect the position or the policy of the federal government or the sponsoring agencies, and no official endorsement should be inferred.
Funding: This research was supported by the National Institutes of Health (grants NCRR UL1RR024982 and NCI R21CA132096-01A1).
Abbreviations:
- NAA
- N-acetylaspartate
- RMSE
- root mean square error
References
- 1.Daly PF, Cohen JS. Magnetic resonance spectroscopy of tumors and potential in vivo clinical applications: a review. Cancer Res 1989;49(4):770–779 [PubMed] [Google Scholar]
- 2.Gillies RJ, Bhujwalla ZM, Evelhoch J, et al. Applications of magnetic resonance in model systems: tumor biology and physiology. Neoplasia 2000;2(1-2):139–151 [DOI] [PMC free article] [PubMed] [Google Scholar]
- 3.Pirzkall A, Li XJ, Oh JM, et al. 3D MRSI for resected high-grade gliomas before RT: tumor extent according to metabolic activity in relation to MRI. Int J Radiat Oncol Biol Phys 2004;59(1):126–137 [DOI] [PubMed] [Google Scholar]
- 4.Kurhanewicz J, Vigneron DB, Nelson SJ. Three-dimensional magnetic resonance spectroscopic imaging of brain and prostate cancer. Neoplasia 2000;2(1-2):166–189 [DOI] [PMC free article] [PubMed] [Google Scholar]
- 5.Nelson SJ, Vigneron DB, Dillon WP. Serial evaluation of patients with brain tumors using volume MRI and 3D 1H MRSI. NMR Biomed 1999;12(3):123–138 [DOI] [PubMed] [Google Scholar]
- 6.Nelson SJ. Multivoxel magnetic resonance spectroscopy of brain tumors. Mol Cancer Ther 2003;2(5):497–507 [PubMed] [Google Scholar]
- 7.Howe FA, Opstad KS. 1H MR spectroscopy of brain tumours and masses. NMR Biomed 2003;16(3):123–131 [DOI] [PubMed] [Google Scholar]
- 8.Ebel A, Soher BJ, Maudsley AA. Assessment of 3D proton MR echo-planar spectroscopic imaging using automated spectral analysis. Magn Reson Med 2001;46(6):1072–1078 [DOI] [PubMed] [Google Scholar]
- 9.Zhu H, Barker PB. MR spectroscopy and spectroscopic imaging of the brain. Methods Mol Biol 2011;711:203–226 [DOI] [PMC free article] [PubMed] [Google Scholar]
- 10.Candes EJ, Romberg J, Tao T. Robust uncertainty principles: exact signal reconstruction from highly incomplete frequency information. IEEE Trans Inf Theory 2006;52(2):489–509 [Google Scholar]
- 11.Lustig M, Donoho D, Pauly JM. Sparse MRI: the application of compressed sensing for rapid MR imaging. Magn Reson Med 2007;58(6):1182–1195 [DOI] [PubMed] [Google Scholar]
- 12.Jung H, Sung K, Nayak KS, Kim EY, Ye JC. k-t FOCUSS: a general compressed sensing framework for high resolution dynamic MRI. Magn Reson Med 2009;61(1):103–116 [DOI] [PubMed] [Google Scholar]
- 13.Jim J, Tao L. Dynamic MRI with compressed sensing imaging using temporal correlations. In: 5th IEEE International Symposium on Biomedical Imaging: From Nano to Macro. Paris: Institute of Electrical and Electronics Engineers, 2008; 1613–1616 [Google Scholar]
- 14.Serrai H, Senhadji L, de Certaines JD, Coatrieux JL. Time-domain quanification of amplitude, chemical shift, apparent relaxation time T2, and phase by wavelet-transform analysis: application to biomedical magnetic resonance spectroscopy. J Magn Reson 1997;124(1):20–34 [DOI] [PubMed] [Google Scholar]
- 15.Serrai H, Nadal-Desbarats L, Poptani H, Glickson JD, Senhadji L. Lactate editing and lipid suppression by continuous wavelet transform analysis: application to simulated and (1)H MRS brain tumor time-domain data. Magn Reson Med 2000;43(5):649–656 [DOI] [PubMed] [Google Scholar]
- 16.Cancino-De-Greiff HF, Ramos-Garcia R, Lorenzo-Ginori JV. Signal de-noising in magnetic resonance spectroscopy using wavelet transforms. Concepts Magn Reson 2002;14(6):388–401 [Google Scholar]
- 17.Zarei S, Alireazie J, Babyn P, Kassner A, Widjaja E. MRS feature extraction: time-frequency and wavelet analysis. In: The 2nd International Conference on Bioinformatics and Biomedical Engineering. Shanghai, China: ICBBE, 2008; 1863–1866 [Google Scholar]
- 18.Fu Y, Serrai H. Fast magnetic resonance spectroscopic imaging (MRSI) using wavelet encoding and parallel imaging: in vitro results. J Magn Reson 2011;211(1):45–51 [DOI] [PubMed] [Google Scholar]
- 19.Hu S, Lustig M, Chen AP, et al. Compressed sensing for resolution enhancement of hyperpolarized 13C flyback 3D-MRSI. J Magn Reson 2008;192(2):258–264 [DOI] [PMC free article] [PubMed] [Google Scholar]
- 20.Antonini M, Barlaud M, Mathieu P, Daubechies I. Image coding using wavelet transform. IEEE Trans Image Process 1992;1(2):205–220 [DOI] [PubMed] [Google Scholar]
- 21.Naressi A, Couturier C, Castang I, de Beer R, Graveron-Demilly D. Java-based graphical user interface for MRUI, a software package for quantitation of in vivo/medical magnetic resonance spectroscopy signals. Comput Biol Med 2001;31(4):269–286 [DOI] [PubMed] [Google Scholar]
- 22.Ratiney H, Coenradie Y, Cavassila S, van Ormondt D, Graveron-Demilly D. Time-domain quantitation of 1H short echo-time signals: background accommodation. MAGMA 2004;16(6):284–296 [DOI] [PubMed] [Google Scholar]
- 23.Pohmann R, von Kienlin M, Haase A. Theoretical evaluation and comparison of fast chemical shift imaging methods. J Magn Reson 1997;129(2):145–160 [DOI] [PubMed] [Google Scholar]
- 24.Zierhut ML, Ozturk-Isik E, Chen AP, Park I, Vigneron DB, Nelson SJ. (1)H spectroscopic imaging of human brain at 3 Tesla: comparison of fast three-dimensional magnetic resonance spectroscopic imaging techniques. J Magn Reson Imaging 2009;30(3):473–480 [DOI] [PMC free article] [PubMed] [Google Scholar]
- 25.Mansfield P. Spatial mapping of the chemical shift in NMR. Magn Reson Med 1984;1(3):370–386 [DOI] [PubMed] [Google Scholar]
- 26.Posse S, DeCarli C, Le Bihan D. Three-dimensional echo-planar MR spectroscopic imaging at short echo times in the human brain. Radiology 1994;192(3):733–738 [DOI] [PubMed] [Google Scholar]
- 27.Mulkern RV, Panych LP. Echo planar spectroscopic imaging. Concepts Magn Reson 2001;13(4):213–237 [Google Scholar]
- 28.Du W, Du YP, Fan X, Zamora MA, Karczmar GS. Reduction of spectral ghost artifacts in high-resolution echo-planar spectroscopic imaging of water and fat resonances. Magn Reson Med 2003;49(6):1113–1120 [DOI] [PubMed] [Google Scholar]
- 29.Choi C, Ganji SK, Deberardinis RJ, et al. Measurement of glycine in the human brain in vivo by 1H-MRS at 3 T: application in brain tumors. Magn Reson Med 2011;66(3):609–618 [DOI] [PMC free article] [PubMed] [Google Scholar]


