Abstract
The role of hydration in degradation and erosion of materials, especially biomaterials used in scaffolds and implants, was investigated by studying the distribution of water at length scales from 0.1 nm to 0.1 mm using Raman spectroscopy, small-angle neutron scattering (SANS), Raman confocal imaging, and scanning electron microscopy (SEM). The measurements were demonstrated using L-tyrosine derived polyarylates. Bound- and free- water were characterized using their respective signatures in the Raman spectra. In the presence of deuterium oxide (D2O), H-D exchange occurred at the amide carbonyl but was not detected at the ester carbonyl. Water appeared to be present in the polymer even in regions where there was little evidence for N-H to N-D exchange. SANS showed that water is not uniformly dispersed in the polymer matrix. The distribution of water can be described as mass fractals in polymers with low water content (~5 wt%), and surface fractals in polymers with larger water content (15 to 60 wt%). These fluctuations in the density of water distribution are presumed to be the precursors of the ~ 20 μm water pockets seen by Raman confocal imaging, and also give rise to 10–50 μm porous network seen in SEM. The surfaces of these polymers appeared to resist erosion while the core of the films continued to erode to form a porous structure. This could be due to differences in either the density of the polymer or the solvent environment in the bulk vs. the surface, or a combination of these two factors. There was no correlation between the rate of degradation and the amount of water uptake in these polymers, and this suggests that it is the bound-water and not the total amount of water that contributes to hydrolytic degradation.
Keywords: multiscale analysis, hydration, degradation, spectroscopy, scattering, confocal imaging, microscopy, polyarylates
1. Introduction
Water uptake is an important parameter that affects the performance of biodegradable polymers [1–2]. It not only affects degradation, swelling and changes in mechanical properties [3], but also the release of drugs [4] and biological response [5]. Several groups have studied water uptake and hydration of polymer films using different techniques. Methods such as gravimetric analysis [6], thermogravimetric analysis (TGA), and 3H-radiolabeled water (3H2O) [7] are commonly used to study of the kinetics of hydration, but they do not provide information on the interactions between polymer and water molecules, and about spatial distribution of the water in the polymer. This knowledge of the distribution of water is important for understanding hydrolytic degradation: water rich areas of the polymer are expected to degrade faster than other areas [8]. Numerous studies have been carried out to examine the distribution of water using a variety of techniques. Techniques used to study molecular motions upon hydration include quasielastic neutron scattering (QENS) [9], nuclear magnetic resonance (NMR) [10], photon correlation spectroscopy [11], and thermally stimulated depolarization currents (TSDC) [12]. Interaction between water molecules and molecular fragments are frequently studied by Raman spectroscopy [13–14], infrared spectroscopy (IR) [15–16]. NMR has been used to map the water distribution in a polymer, with low spatial resolution [17], and electron energy-loss spectroscopy (EELS) has been used to follow hydration and map water within polymers at ~15 nm resolution [8]. Confocal fluorescence microscopy [18], and X-ray microscopy [19] have been used to map the distribution of water at larger (μm) length scales.
The studies cited above are important but each of them focuses on one aspect of water-polymer interactions. There are very few studies of polymer hydration across different length scales. In one such study, Perrin et al. used a combination of QENS (~ 10 Å), small angle neutron scattering (SANS, ~ 100 Å) and wide angle neutron scattering (WANS) to study the hydration of polymer membranes [9]. Here, we investigate the hydration process in biodegradable polymers at smaller and larger length scales than in the study by Perrin et al. Towards this goal, we measure the average water content using 3H2O, polymer erosion by SEM, map the water distribution at μm length scale by confocal Raman imaging, at sub μm length scale by SANS, and probe polymer-water interactions at the molecular level by Raman spectroscopy (Table 1).
Table 1.
Summary of the techniques used in this study
| Technique | Length scale | Features related to this study |
|---|---|---|
| Confocal Raman Spectroscopy | 0.1–0.5 nm | Interactions between water and the polymers at the molecular level at 5 μm spatial resolution |
| Small-angle scattering | 5–50 nm | Agglomeration of molecules at mesolength scales |
| Confocal Raman imaging | 1 –5 μm | Distribution of relative water content near the surface |
| Scanning electron microscopy | 1–100 μm | Porous network |
| Water uptake using 3H-labeled water | Bulk | Equilibrium water content averaged over the entire sample |
The main advantage of using 3H2O to measure water content is its accuracy at low levels of water uptake (< 2%) [7]. Other simpler methods such as gravimetric measurements allow accurate measurements only at higher levels of water uptake. The advantage of Raman spectroscopy is that it is a non-invasive, non-destructive technique that allows chemical characterization without the need for labeling the polymer [20]. The technique will be used here to study the uptake of water [21] as well as molecular level interactions such as hydrogen bonding [22] and N-H to N-D exchange, thereby observe the changes that occur upon hydration and degradation. Confocal Raman microscopy has been used to monitor the hydration profiles in vivo in skin [23]. As applied to the polymers studied herein, such confocal images swill provide information about the distribution of water at 2– 5 μm length scales and complement the SEM that will be used to obtain images of the resulting porous networks at 1–100 μm length scales. SANS has been used to monitor the distribution of water in a straightforward manner by taking advantage of the marked difference in scattering lengths of hydrogen and deuterium (−0.374 vs. 0.667 in units of 10−12 cm), and requires the use of deuterium oxide (D2O) in place of water [9, 24–25]. SANS has been used to show that water preferentially resides in the amorphous regions in the polymer, and to determine the sizes of these hydrated domains [26–27]. The technique will be used in this study to understand the distribution of water at 10 –100 nm length scales.
Polymers used in this study were selected from a library of L-tyrosine-derived polyarylates [28]. These are copolymers with an alternating sequence of a diphenol and a diacid. Bone pins made from these polymers are resorbed in vivo without a significant inflammatory response [29], and a tyrosine-derived polyarylate is used in FDA-approved devices for hernia repair [30] and infection control. Changes in the polymer backbone or pendent chain lengths affect polymer properties such as glass transition temperature (Tg) and surface hydrophobicity [28]. Water uptake in polyarylates has been shown to be dependent on the polymer structure and processing methods [7]. Total water uptake ranges from less than 3 to more than 250% after 28 days of incubation in water at 37ºC, depending on the polymer structure and the initial molecular weight (MW). Three polymers that are representative of the range of water-uptake in this library were selected for this study.
2. Experimental
2.1. Materials
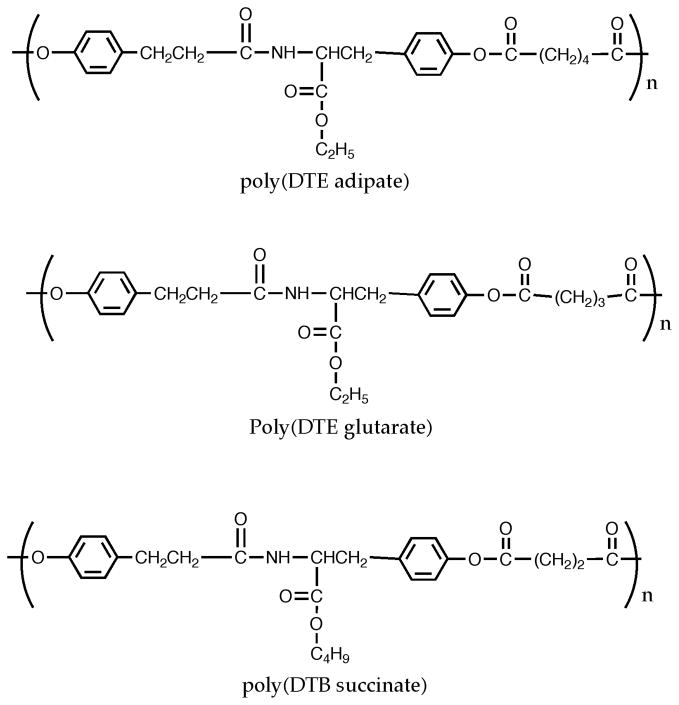
Three L-tyrosine-derived polyarylates were used in this study: poly(DTE adipate), poly(DTE glutarate) and poly(DTB succinate) (Figure 1). Polymers were synthesized as described previously by carbodiimide-mediated solution polycondensation of a diphenol and a diacid at room temperature [31].
Figure 1.
Polymers used in this study: poly(DTE adipate), poly(DTE glutarate), and poly(DTB succinate).
2.2. Film preparation
Polymer films of thickness ~200 μm were compression molded using a Carver Press (Fred S. Carver Inc.) as described previously [7]. After molding, films were either quenched by fast cooling or annealed at 10ºC above Tg for at least 20 h before incubation.
2.3. Molecular weight measurements
MW was measured using a gel permeation chromatography (GPC) with tetrahydroduran (THF) as mobile phase, as described previously [7].
2.4. Water uptake using radioactive water
Water content was determined using 3H-labeled water, a method that allows parallel measurements and is accurate at very low water uptake levels. In addition, this method allows measuring water uptake even if the polymer starts to degrade and erode, using its mass after incubation to make corrections to the initial mass of the tested sample after erosion. This method is described in detail in [7]. Briefly, samples, 1 cm in diameter, were incubated at 37 ºC in 3H-radiolabeled water (Sigma-Aldrich) with an activity of 0.2 μCi/mL. Radioactive counts were measured using a scintillation counter (Beckmann 6500), and water uptake (WU) was calculated as the water content (M 3H2O) relative to the original dry weight (Msample):
| (1) |
2.5. Confocal Raman spectroscopy and imaging
Raman spectra of dry polymers and samples after incubation in D2O at either 21°C or 37°C were obtained for varying periods. Spectra were acquired with a Kaiser Optical Systems Raman Microprobe described in detail in Ref. [32]. Excitation was achieved with a 785 nm solid-state diode laser focused at the sample with either a 100X air (for dry samples) or oil immersion objective (for D2O exposed samples). This arrangement generates 4–8 mW of single mode power within a volume of ~2 μm3. The backscattered light illuminates a near-IR CCD (model DU 401-BR-DD, Andor Technology, Belfast, Ireland). Spectral resolution is 4 cm−1 over the 100–3450 cm−1 region. Spectra were acquired using a 60 s exposure time, one accumulation, and cosmic ray correction. A computer controlled high precision XYZ microscope stage permitted the acquisition of XZ image planes with spectra acquired every 5 μm.
Confocal Raman maps were analyzed using ISys software, version 3.1 (Malvern Instruments, LTD, UK). Linear baselines were applied to spectral regions of interest before peak integration or factor analysis was conducted. Details of the ISys factor analysis protocol (score segregation algorithm) have been previously described [32]. Briefly, factor analysis is a statistical multivariate technique that reduces the dimensionality of the data by detecting patterns in the relationships between observed variables. The approach begins with principal component analysis (PCA) followed by a score segregation routine that seeks transformations between the PCA loadings and Beer’s law parameters. The result of factor analysis is a set of factor loadings and factor scores that depict the correlations between the actual spectrum at each pixel and the factor loadings. For example, if a single pixel in an image contains contributions from dry and hydrated polymer, two factor loadings may be observed, each with their own score. In the current work, we opted to calculate positive loadings because spectra (as opposed to derivative spectra) are used for input. Hence, the calculated factor loadings resemble typical spectra, although not of pure components. Furthermore, as a result of the reduction in the dimensionality of the data, a factor loading tends to have a higher signal to noise level than an individual spectrum allowing the detection of subtle spectra differences.
The spatial distribution of water was imaged by calculating the relative D2O content from a spectrum obtained at each measured point (2–3 μm3/pixel) in the sample. Since this is a single beam experiment and the Raman intensity diminishes as a function of depth, the C=C stretching band intensity was used an internal standard to compensate for the single beam nature of the experiment and to correct for the loss with depth.
2.6. SANS
Film specimens, approximately 0.2 mm thick, were incubated in deuterated water for at least 24 h prior to SANS analysis. The hydrated films were stacked inside a custom-made quartz cell (fused quartz discs, 1/2 inch diameter × 1/16 inch thick, Quartz Plus Inc., Brookline, NH). Neutron scattering data were collected at the SANS1 CNG2 beam line (Oak Ridge National Laboratories, Oak Ridge, TN) at a wavelength of 4.766 Å and a sample-to-detector distance of 8.65 meters over a q-range of 0.007 to 0.154 Å−1. Exposure times were ~ 1200 seconds. An air blank (empty cell) was run for background subtraction.
2.7. Scanning electron microscopy
The morphological features of the polymer films in dry state, and after 12 days, 64 days, and 1 year of incubation in water at 37°C were investigated by scanning electron microscopy (SEM) (Amray 18301). The samples were sputter coated with gold-palladium before SEM imaging.
3. Results and Discussion
In the present study, we use three polymers with different water uptake characteristics from a library of polyarylates (Figure 1), and a variety of methods to study hydration at different length scales (Table 1). Wide-angle x-ray diffraction scans showed that the polymers used in this study are amorphous. Annealing the polymers reduced the variability in the water uptake between specimens seen in some of the polymers of this library, but the samples remained amorphous. Since these are homopolymers, the expectation was that water would be uniformly distributed in the bulk of the polymer. The data obtained during initial water uptake (1 to 5 days) and that obtained after 65 days, when the water uptake had equilibrated, will be presented. Degradation continues beyond this 65-day time point.
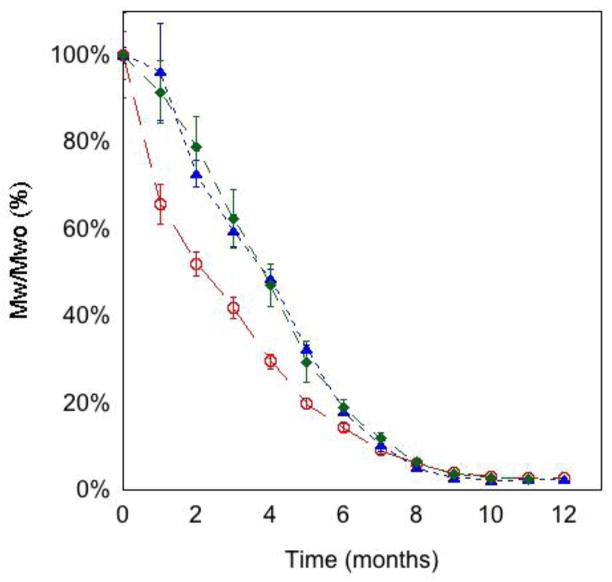
Water uptake, measured after both 3 and 65 days of incubation at 37ºC in water, was essentially the same in quenched and annealed films of both poly(DTB succinate) and poly(DTE glutarate) (Table 2). In poly(DTE adipate), water uptake was significantly higher in the quenched film than in the annealed film, especially at long times. In these 200 μm thick films, equilibrium water uptake is reached in poly(DTB succinate) films in less than 3 days, and remained very low during the 65 days of incubation at 37ºC. This can be attributed to the glassy state of this polymer even when hydrated (Tg was above 37ºC) [7]. Water uptake measurements using 3H2O allowed the detection of these low levels. The water uptake of poly(DTE adipate) and poly(DTE glutarate) continued to increase. Despite the differences in water uptake, the degradation profiles of poly(DTB succinate) and poly(DTE glutarate) were similar (Figure 2). Poly(DTE adipate) degraded faster compared to the other two polymers. After 7 months of incubation, the % decrease in MW was the same in all the three polymers. It is not possible to explain these findings based individually on the length of the pendant chain, the type of diacid or the Tg of the polymers. A large number of polymers need to be investigated to determine the combination of chain flexibility and hydrophilicity that determines the observed water uptake behavior.
Table 2.
Water uptake after incubation at 37ºC in quenched and annealed films. For bulk water measurements the films were immersed in radioactive water (* p-value < 0.0001). Each value is the mean value of n samples from the same film ± SD. For confocal Raman image data, the value is the mean D2O content relative to C=C stretching band intensity (± SD).
| Polymer | Days of incubation | Radioactive labeling | Confocal Raman Imaging | ||||
|---|---|---|---|---|---|---|---|
| Number of measurements | Water uptake (wt %) | Number of spectra averaged | Relative D2O Content | ||||
| Quenched | Annealed | Quenched | Annealed | ||||
| poly(DTE adipate) | 5 | 5 | 17.9 ± 1.1 | 14.3 ± 1.3 * | |||
| 65 | 5 | 46.3 ± 1.0 | 35.8 ± 1.2 * | 64 | 6.2 ± 2.1 | 5.0 ± 1.9 | |
| poly(DTE glutarate) | 5 | 5 | 15.4 ± 1.0 | 15.1 ± 0.6 | |||
| 65 | 5 | 55.0 ± 2.7 | 58.1 ± 1.0 | 64 | 15.0± 2.8 | 16.7 ± 3.7 | |
| poly(DTB succinate) | 3 | 15 | 5.8 ± 2.2 | 5.0 ± 0.8 | |||
| 65 | 5 | 5.0 ± 1.1 | 5.5 ± 0.9 | 192 | 0.42 ± 0.07 | 0.42 ± 0.07 | |
Figure 2.
Degradation profile of annealed poly(DTE adipate) (○), poly(DTE glutarate) (▲) and poly(DTB succinate) (◆), incubated in water at 37°C. Each value is the mean value of three samples from three different films ± SD.
3.1. Confocal Raman spectroscopy
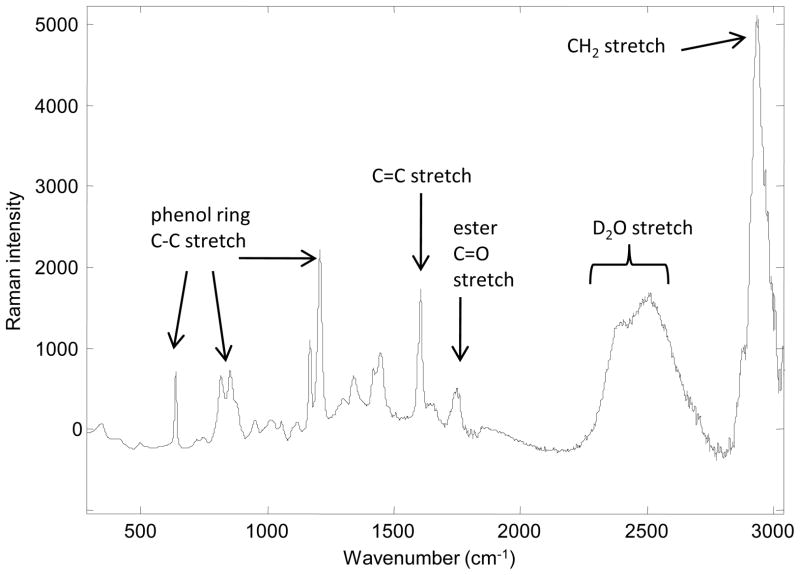
Figure 3 displays a typical Raman spectrum of the poly(DTE glutarate) polymer after exposure to D2O. Spectra acquired from all three polymers, before and after D2O exposure, were used to study the effects of hydration at the molecular level. Changes in the local environment of specific functional groups are related to hydrogen bonding as D2O replaces H2O in the polymers. This transformation is manifest as a shift in frequency in particular Raman bands. In addition, intensity changes in specific Raman bands provide evidence of N-H to N-D exchange in the amide group present within the diphenol portion of the polymers.
Figure 3.
Typical Raman spectrum of a polymer from the L-tyrosine derived polyarylate library exposed to D2O.
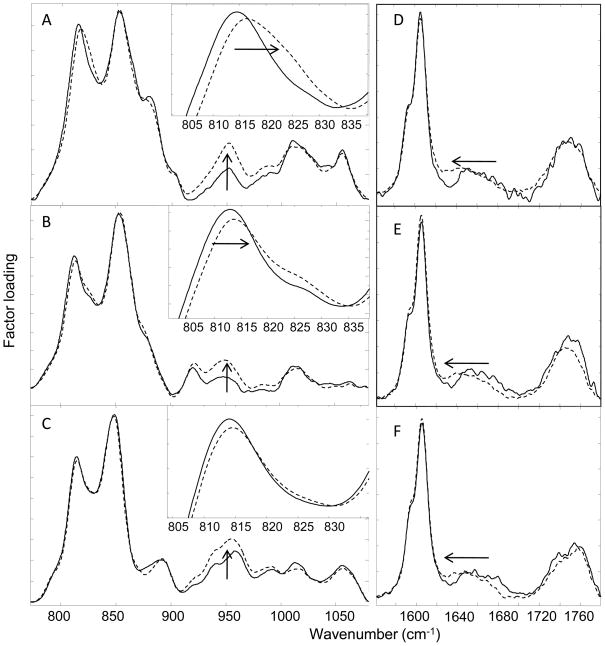
The multivariate technique of factor analysis (see Experimental section) was used to evaluate small qualitative changes in spectral parameters sensitive to hydrogen bonding and N-H to N-D exchange (Figure 4). Spectra from 40 × 40 μm sections of a single polymer sample before and after exposure to D2O (up to 65 days of incubation at 37°C) were analyzed together. Three or four factor loadings were generated for each polymer data set. Two factor loadings for each polymer are displayed in Figure 4 over two spectral regions of interest. The remaining loadings are not shown since they do not contribute new spectral information and generally have a high noise level. Factor scores (not shown) allow the assignment of the loadings to the polymers before (full lines) and after (dashed lines) D2O exposure. Shifts in band positions are correlated with hydrogen bonding changes as H to D exchange takes place. In particular, an upward frequency shift in the phenol ring C-C stretching mode (~815 cm−1) is observed after D2O exposure in all three polymers (Figure 4, A–C plus insets). The frequency shift and band broadening appears to be most pronounced in the factor loadings for poly(DTE glutarate), and is small in poly(DTB succinate). This follows the trend observed in water uptake measurements, and shows that the difference in total water content within the polymers of this library may be correlated with water associated with the phenol rings. It is possible that differences in packing of the polymer pendant chains or in the flexibility of the main chain may limit access of the phenol group to water differently for the three polymers.
Figure 4.
Factor loadings generated in 775–1080 cm−1 (A–C) and 1565–1780 cm−1 (D–F) spectral regions for poly(DTE glutarate) A&D, poly(DTE adipate) B&E, and poly (DTB succinate) C&F, highlighting differences in spectral regions before (full lines) and after (dashed lines) exposure to D2O for up to 65 days at 37°C.
Also of interest is the downward frequency shift in the Amide I band (1640–1680 cm−1 region) upon D2O exposure (Figure 4, D–F). This shift is similar for the three polymers studied here, even though their water contents are very different. The Amide I mode arises predominantly from the carbonyl stretch within this functional group and although the mode is weak, the observed shift can be explained by H to D exchange via hydrogen bonding. Also of note is the absence of any significant frequency shift in the ester carbonyl band (1720–1780 cm−1), suggesting that D2O has little access to the pendant chain or backbone ester carbonyls within the polymer.
Evidence of hydrogen bonding to the Amide I carbonyl, but lack thereof to the ester carbonyls, is consistent with previously reported TSDC results from closely related polymers in which it was shown that water was tightly bound to the amide carbonyl group and loosely bound to the pendant ester carbonyl [12, 33]. Finally, evidence of N-H to N-D exchange is manifest as an intensity increase near 950 cm−1 in the spectra for all three polymers (Figure 4, A–C). Despite the presence of overlapping bands in this spectral region for the adipate and succinate polymers, the intensity increase observed for all three sets of polymer spectra is most likely due to contributions from the Amide III′ mode. Whereas the Amide III band predominantly arises from a combination of ~40% C-N stretch and 30% N-H in-plane bend, Amide III′ has a major contribution from N-D in-plane bend [34]. The increase in intensity in Amide III′ and the downward frequency shift in Amide I both indicate that the amide group in the polymer is accessible to D2O.
Figure 4 provides a qualitative evidence for H to D exchange which suggests that as water diffuses into the free volume in the polymer, and probably disrupts the interchain amide-hydrogen bond networks, it enhances the polymer packing in more hydrated stages, thus making the polymer denser [33]. The relative amount of N-H to N-D exchange in the polymer was evaluated by calculating the integrated band area ratio of Amide III′/C=C. Although the ratios are not comparable between polymers, the percent increase in the average ratio for each polymer provides a valid measure of the extent of exchange. Amide III′/C=C ratios were averaged for 64 spectra acquired of each polymer under dry and wet (D2O) conditions. The ratios increased as follows: 165% for poly(DTE adipate), 155% for poly(DTE glutarate), and 70% for poly(DTB succinate). This is consistent with the significantly lower water uptake observed for the poly(DTB succinate) (see Sections 3.3 and 3.4).
3.2. SANS
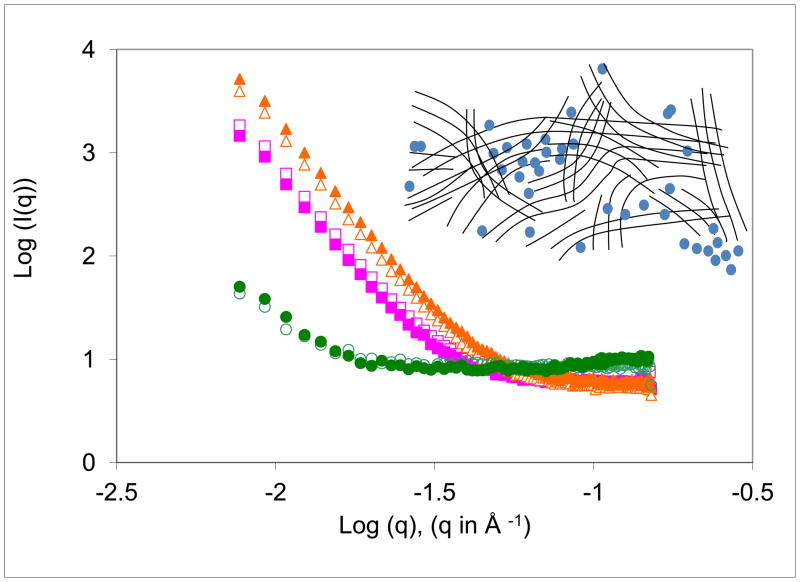
Water uptake characteristics were studied by SANS to obtain information on the distribution of water at ~10 nm length scale. Preliminary measurements were done after 24 h of incubation, and a detailed study was made after 68 days of incubation at 37 °C. The two sets of data were qualitatively similar except for the changes in the intensities that are correlated with the amount of water uptake (Table 2). The plot of intensity vs. scattering angle, plotted in Figure 5 as log (I(q)) vs. log (q), where I(q) is the scattered intensity at scattering vector q and q= (4 π sin θ)/λ), shows a monotonically decreasing intensity from a maximum at zero angle. There were no significant differences between the quenched and the annealed samples in each of the three polymers. The intensity was weaker in poly(DTB succinate) than in poly(DTE adipate) and poly(DTE glutarate), consistent with the smaller water uptake in poly(DTB succinate). The excess scattering clearly shows that water is not uniformly distributed in the matrix [35]. This scattering arises from the fluctuations in the distribution of water at 10 –100 nm length scale. These fluctuations could be in the form of clusters, domains or networks of water shown schematically in the inset to the figure [36–37]. The q-range of these plots suggests that the length scale of these structures is 10–100 nm. The linearity in the plots in Figure 5 suggests that the distribution of water can be described as fractals [38]. The Porod exponent, the slope of the plots, is between 1 and 3 for low-water poly(DTB succinate) suggesting a distribution that can be described as a mass fractal. The Porod exponent is between 3 and 4 for high-water poly(DTE adipate) and poly(DTE glutarate) suggesting domains in these two polymers can be described as surface fractals.
Figure 5.
SANS intensity vs. scattering angle for the three films used in this study. Squares - poly(DTE adipate). Triangles - poly(DTE glutarate. Circles - poly(DTB succinate). Open symbols refer to quenched films, and the filled symbols to the annealed samples. The inset shows a schematic of the fluctuation in the distribution of water shown by filled blue circles in the polymer matrix represented by lines.
3.3. Confocal Raman imaging
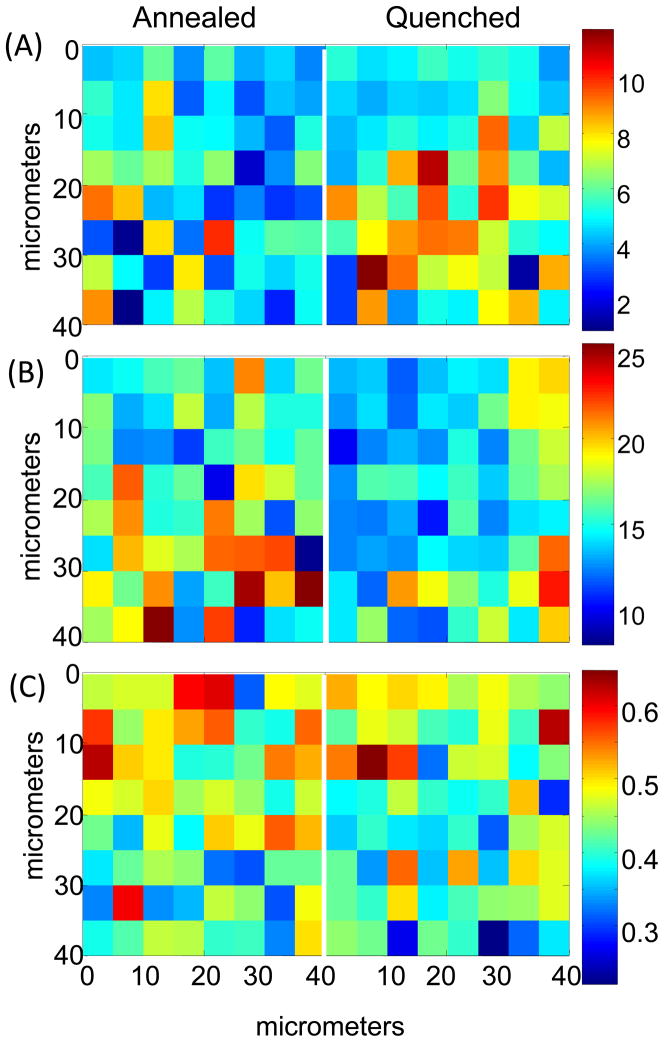
In addition to the H-D exchange information discussed in Section 3.1, confocal Raman measurements provide previously unavailable information about water distribution near the surface of the polymer films, up to a depth of approximately 60 μm. In all the confocal Raman images shown in Figures 6–8, the top 10–20 microns have been masked away because the edge of the polymers may not be flat on the micron scale and the very high D2O content in this region does not allow visualization of D2O variability throughout the image. Image planes shown here, and in Figures 7 and 8, are normal to the surface of the polymer. The vertical axis of the plot reflects depth into the polymer beginning at ~10–20 μm below the surface to a depth of ~50–60 μm. The relative D2O content was calculated as the integrated band area ratio of the OD stretching region (2170–2776 cm-1)/C=C stretching band (1578–1628 cm-1) (Figure 3).
Figure 6.
Confocal Raman images of relative D2O content measured by integrated band area ratio (D2O stretch/C=C stretch) (2170–2776 cm−1)/(1578–1628 cm−1) for (A) poly(DTE adipate), (B) poly(DTE glutarate) and (C) poly(DTB succinate) samples after 65 days of incubation in D2O at 37°C. Data from both annealed and quenched samples are shown. Spectra acquired 20–30 microns from top edge of polymers. NOTE: separate scale bars for each polymer. The vertical axis corresponds to depth from the top surface of the film. The color scale bar represents relative D2O content as determined by integrated band area ratio (D2O stretch/C=C stretch) with red being the largest ratio, and blue the smallest.
Figure 8.
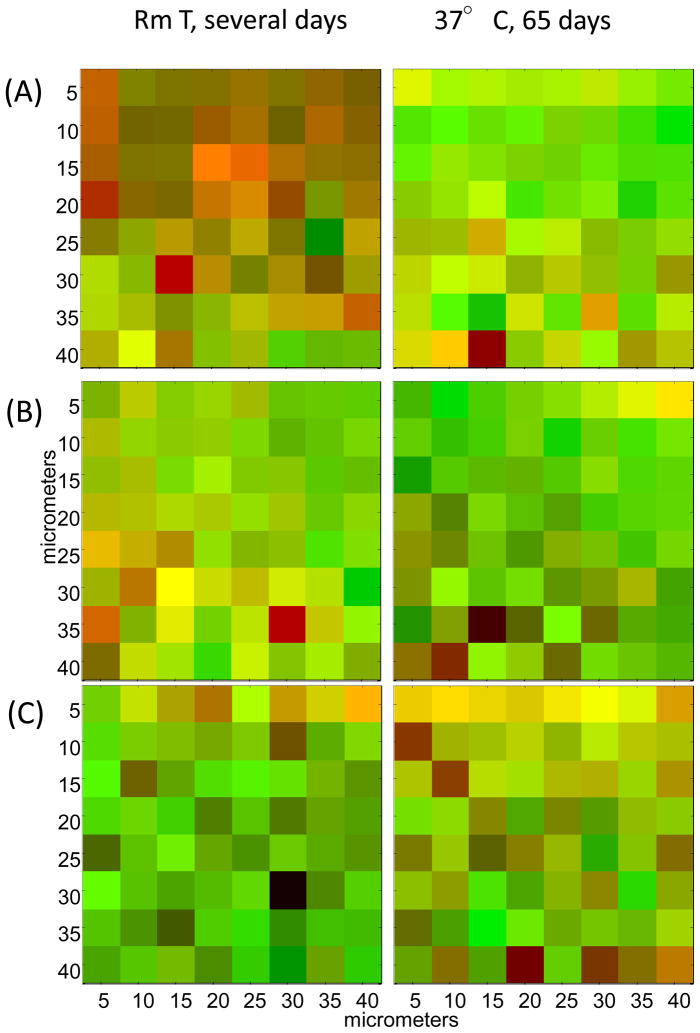
Complementary color images based on confocal Raman spectra to depict the absence of a significant correlation between the spatial distribution of relative D2O content (red) and N-H to N-D exchange as measured by the integrated band area ratio (Amide III′/C=C) (green). Areas of high correlation appear in yellow. (A) poly(DTE adipate), (B) poly(DTE glutarate) and (C) poly(DTB succinate). The vertical axis corresponds to depth from the top surface of the film. See text for details.
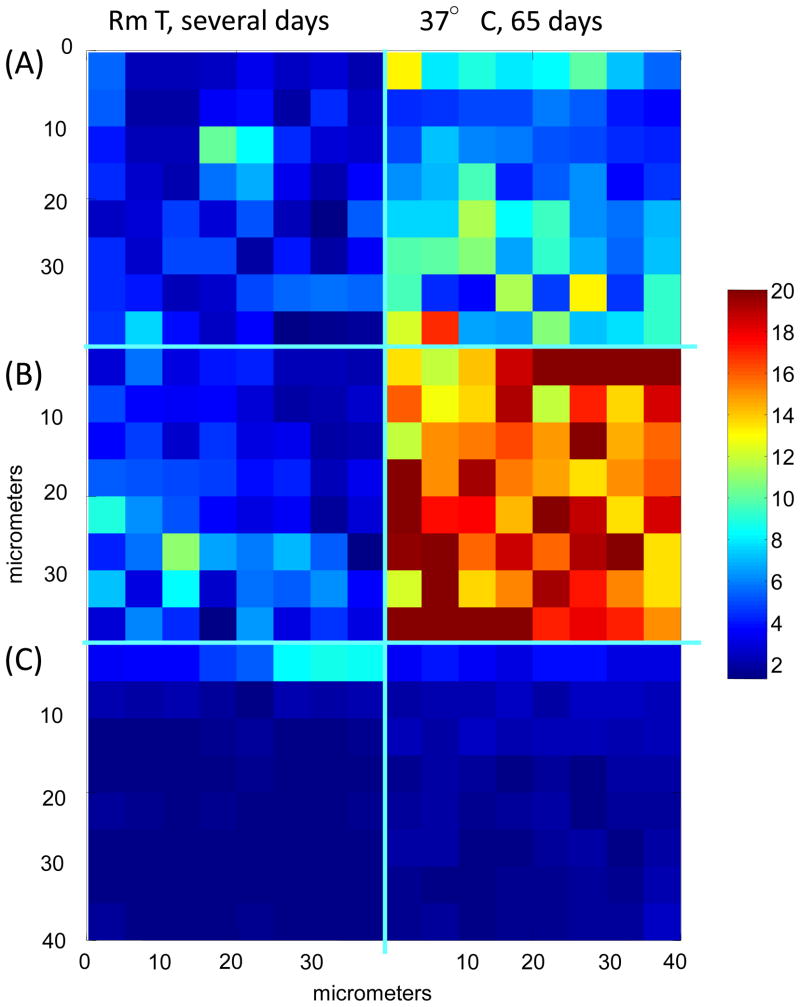
Figure 7.
Confocal Raman images depicting the temporal evolution of relative D2O content in polymer samples at time points as noted in the figure. (A) poly(DTE adipate), (B) poly(DTE glutarate) and (C) poly(DTB succinate). The data are plotted on same scale to highlight the large differences seen between the polymers. The vertical axis corresponds to depth from the top surface of the film. The color scale bar represents relative D2O content as determined by integrated band area ratio (D2O stretch/C=C stretch) with red being the largest ratio, and blue the smallest.
The spatial distribution of the relative D2O content in the three polymers is compared in Figure 6. The point to note is that these images enable direct observation of heterogeneity at this length scale and depict water content/domains within these polymers to a depth of ~60 μm. This is not easily accomplished by other methods. Further study is needed to catalog this heterogeneity, and to understand its influence on biodegradability. Although there are variations in spatial distribution of the relative D2O content between pixels, the overall D2O content is significantly lower in poly(DTB succinate) than in the other two polymers (Figure 6, note scale bar differences). Detailed analysis of the poly(DTB succinate) samples (not shown) after exposure to D2O for 65 days at 37°C showed that the average relative D2O content (averaged over areas similar to Figure 6) are 0.40, 0.40, and 0.45 for three different annealed samples and 0.42, 0.41, and 0.43 for three quenched samples. These values show good reproducibility from sample to sample and the absence of any significant differences between annealed and quenched films. Water pockets/channels in the images of the poly(DTE adipate) and poly(DTE glutarate) (Figure 6) extend across adjacent pixels (high values of water shown in orange-red) indicating that the size of these pockets vary in size from 5 to 20 μm. These large length-scale domains evolve from the distribution of water at much smaller length scales (10–100 nm) seen in SANS.
The mean values for the relative D2O content (relative to C=C stretching band intensity) obtained from the images shown in Figure 6 are given in Table 2. The Raman measurement differs from the radioactively labeled water measurements because Raman imaging probes to a depth of ~60 micron within a much thicker sample, and measurements using radioactive water are derived from the entire sample. Both techniques exclude surface water. The general trend observed in bulk measurements is apparent in Raman results as well, despite the two being disparate techniques. Overall, the differences in D2O content comparing quenched to annealed values for each polymer are small, however significant differences are found between the polymers with poly(DTE glutarate) > poly(DTE adipate) ≫ poly(DTB succinate) after 65 days of exposure at 37°C (Table 2). Directly comparing results from the two techniques between polymers is difficult because the intensity of the internal standard band (C=C) used in the Raman measurement is affected by the density changes between the samples.
A comparison of the temporal evolution of the relative D2O content between polymers is of interest and is visualized in the confocal Raman images presented in Figure 7 for annealed samples exposed to two conditions. The relative D2O content and its spatial distribution in poly(DTE adipate) and poly(DTE glutarate) are similar after several days of exposure but differ significantly after 65 days of incubation at 37 °C. Little change is seen in the relatively low D2O content of the poly(DTB succinate) over the same period, in agreement with bulk measurements that showed water uptake equilibration within 5 days of incubation [7].
The state of the absorbed water was investigated by correlating the spatial distribution of the relative D2O content and the extent of NH to ND exchange, as measured by the Amide III′/C=C ratio. Complementary color plots were generated by superposing the images of the D2O content (Figure 7) represented in red and the relative Amide III′ content obtained from the map of the 950 cm−1 band (Figure 4) shown in green. These color plots are shown for the three annealed polymers under different exposure conditions (Figure 8). Pixels where these colors overlap appear yellow and provide an image of spatial regions where both the relative D2O content is high and NH-ND exchange was extensive. The appearance of such overlapped regions is sparse and spotty. The most cohesive region is found in the top-most layer of the succinate polymer after 65 days of exposure. These results suggest that two populations of D2O are present within the polymer, bound and free, and are in general agreement with the previous findings of Suarez et al. [12, 33] for polymers belonging to the same family. While free water may facilitate the erosion of the polymer, it is the bound water that contributes to the hydrolytic degradation of the polymer.
3.4. SEM
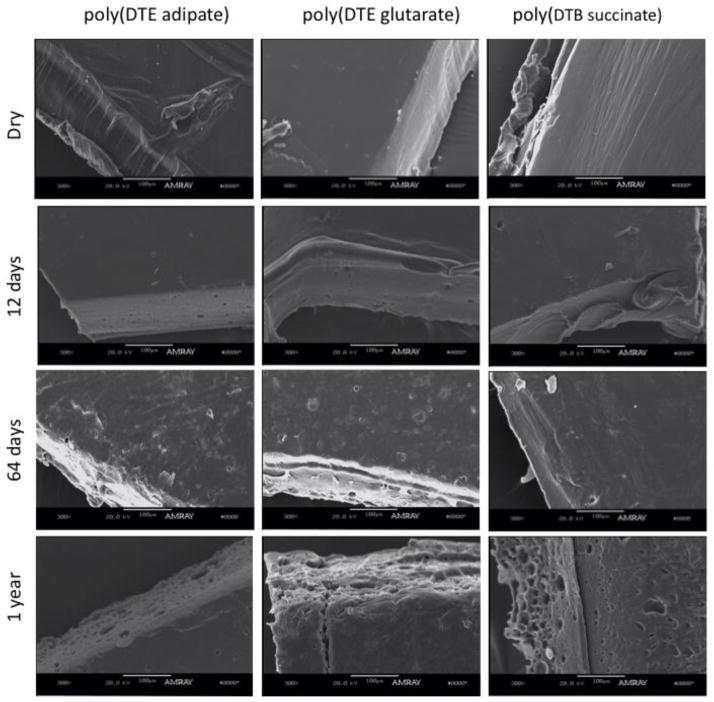
Figure 9 shows representative SEM images of annealed films of the three polymers in the dry state, and after 12 days, 64 days, and 1 year of incubation in water at 37 °C. The image from the dry polymers shows smooth surfaces and no pores or voids. The images of the polymer films after 12 days of incubation show some porous structures (size ~ 20 μm), especially at the edges. It should be emphasized that the edges in these micrographs represent the bulk morphology of the polymer, as they became exposed only when sectioned for imaging. After 64 days there is clear evidence of erosion on poly(DTE adipate) and poly(DTE glutarate) films, but not in the poly(DTB succinate) film. This observation is in agreement with the measurements of very low water uptake after 65 days (~5%) and low degradation (> 79% of initial MW) in the poly(DTB succinate). The SEM images for the three polymers after 1 year of incubation show that erosion has progressed resulting in pores, channels and fractures. This is consistent with the degradation profiles that show a MW of less than 2% of the initial value after 1 year of incubation in the three polymers. It appears that the pores and channels seen in SEM correspond to the 20 μm water pockets seen in confocal Raman imaging. We speculate that these water pockets are formed out of the nonuniform distribution of water at 10–100 nm length scales, which in turn is the result of water binding to the carbonyl groups along the polymer chain.
Figure 9.
SEM images of poly(DTE adipate), poly(DTE glutarate) and poly(DTB succinate) dry, after 12 days, 64 days and after 1 year of incubation in water at 37°C. The scale bas is 100 μm long.
These results suggest that the erosion of the polymer films initiates principally within the bulk of the film (as seen by the changes in the edges of the films) and not at their surfaces. One possible cause would be that the surface becomes denser than the core during processing (e.g., compression molding, commonly known as skin-core effect), and thus can resist erosion, independent of the degradation rate. The second possibility is that the surface is buffered and the degradation products are continuously removed near the surface, thus shielding the surface layer from degradation. In contrast, the edge reflects the environment in the bulk wherein oligomers are concentrated producing an effect similar to autocatalysis observed in poly(lactic acid) [39].
Conclusions
A combination of selected techniques (Raman spectroscopy, small-angle neutron scattering, confocal Raman imaging, and electron microscopy) can provide information about the role of water at different length scales, from the interaction between water and the polymer at the molecular level to the organization of water at bulk-length scales. The total amount of water was accurately quantified with radiolabeled water, without information about the spatial distribution, while Raman and SANS allowed the characterization of the distribution of water in the polymer matrix. Results from one specific polymer family show that water in the polymers is not uniformly distributed at mesoscales. Such distribution is the likely cause of the porous morphology that occurs as polymer is eroded. Bulk phase water is distributed in the form of 10–100 nm network structures that eventually appears as large 10–20 μm pockets. These regions do not necessarily correspond to the regions in which water molecules are hydrogen-bonded to the amide carbonyl groups on the polymer or regions where N-H to N-D exchange has taken place. Furthermore, total water uptake is not correlated with the bound water, suggesting that the degradation rate is not directly dependent on the water content.
Acknowledgments
This work was supported by RESBIO (Integrated Technology Resource for Polymeric Biomaterials) funded by National Institutes of Health (NIBIB and NCMHD) under grant P41 EB001046. The content is solely the responsibility of the authors and does not necessarily represent the official views of the NIH, NIBIB or NCMHD). We thank P. Thiyagarajan, S.V. Pingali and D. Wozniak for facilitating SANS measurements at the Argonne National Laboratory (thanks to), W. Heller for measurements at HFIR-Oak Ridge National Laboratory, and P Narayanan for reviewing the manuscript.
Footnotes
Publisher's Disclaimer: This is a PDF file of an unedited manuscript that has been accepted for publication. As a service to our customers we are providing this early version of the manuscript. The manuscript will undergo copyediting, typesetting, and review of the resulting proof before it is published in its final citable form. Please note that during the production process errors may be discovered which could affect the content, and all legal disclaimers that apply to the journal pertain.
References
- 1.Li SM, Garreau H, Vert M. Structure property relationships in the case of the degradation of massive aliphatic poly-(alpha-hydroxy acids) in aqueous-media .1. Poly(DL-lactic acid) Journal of Materials Science: Materials in Medicine. 1990;1:123–30. [Google Scholar]
- 2.Vert M, Li S, Garreau H. More about the degradation of LA/GA-derived matrices in aqueous-media. Journal of Controlled Release. 1991;16:15–26. [Google Scholar]
- 3.Blasi P, D’Souza SS, Selmin F, DeLuca PP. Plasticizing effect of water on poly(lactide-co-glycolide) J Controlled Release. 2005;108:1–9. doi: 10.1016/j.jconrel.2005.07.009. [DOI] [PubMed] [Google Scholar]
- 4.Soares JS, Zunino P. A mixture model for water uptake, degradation, erosion and drug release from polydisperse polymeric networks. Biomaterials. 2010;31:3032–42. doi: 10.1016/j.biomaterials.2010.01.008. [DOI] [PubMed] [Google Scholar]
- 5.Tanaka M, Mochizuki A. Effect of water structure on blood compatibility--thermal analysis of water in poly(meth)acrylate. J Biomed Mater Res, Part A. 2004;68:684–95. doi: 10.1002/jbm.a.20088. [DOI] [PubMed] [Google Scholar]
- 6.D570-98: Standard test method for water absorption of plastics. 1998 [Google Scholar]
- 7.Valenzuela LM, Michniak B, Kohn J. Variability of water uptake studies of biomedical polymers. J Appl Polym Sci. 2011;121:1311–20. [Google Scholar]
- 8.Sousa A, Schut J, Kohn J, Libera M. Nanoscale morphological changes during hydrolytic degradation and erosion of a bioresorbable polymer. Macromolecules. 2006;39:7306–12. [Google Scholar]
- 9.Perrin JC, Lyonnard S, Volino F. Quasielastic neutron scattering study of water dynamics in hydrated nafion membranes. J Phys Chem C. 2007;111:3393–404. [Google Scholar]
- 10.McDonald PJ, Godward J, Sackin R, Sear RP. Surface flux limited diffusion of solvent into polymer. Macromolecules. 2001;34:1048–57. [Google Scholar]
- 11.Oh KS, Bae YC. Swelling behavior of submicron gel particles. J Appl Polym Sci. 1998;69:109–14. [Google Scholar]
- 12.Suarez N, Brocchini S, Kohn J. Study of relaxation mechanisms in structurally related biomaterials by thermally stimulated depolarization currents. Polymer. 2001;42:8671–80. doi: 10.1016/s0142-9612(98)00151-3. [DOI] [PubMed] [Google Scholar]
- 13.Xu GH, Dong JP, Severtson SJ, Houtman CJ, Gwin LE. Modifications of Surfactant Distributions and Surface Morphologies in Latex Films Due to Moisture Exposure. J Phys Chem B. 2009;113:10189–95. doi: 10.1021/jp902716b. [DOI] [PubMed] [Google Scholar]
- 14.Lua YY, Cao XP, Rohrs BR, Aldrich DS. Surface characterizations of spin-coated films of ethylcellulose and hydroxypropyl methylcellulose blends. Langmuir. 2007;23:4286–92. doi: 10.1021/la0629680. [DOI] [PubMed] [Google Scholar]
- 15.Basnayake R, Peterson GR, Casadonte DJ, Korzeniewski C. Hydration and interfacial water in nafion membrane probed by transmission infrared spectroscopy. J Phys Chem B. 2006;110:23938–43. doi: 10.1021/jp064121i. [DOI] [PubMed] [Google Scholar]
- 16.Sammon C, Yarwood J, Everall N. A FTIR-ATR study of liquid diffusion processes in PET films: comparison of water with simple alcohols. Polymer. 2000;41:2521–34. [Google Scholar]
- 17.Malveau C, Beaume F, Germain Y, Canet D. Analysis of solvent diffusion in high-density polyethylene using NMR imaging techniques. J Polym Sci, Part B: Polym Phys. 2001;39:2781–92. [Google Scholar]
- 18.Kim HB, Hayashi M, Nakatani K, Kitamura N, Sasaki K, Hotta JI, et al. In situ measurements of ion-exchange processes in single polymer particles: Laser trapping microspectroscopy and confocal fluorescence microspectroscopy. Analytical chemistry. 1996;68:409–14. doi: 10.1021/ac951058c. [DOI] [PubMed] [Google Scholar]
- 19.Silva DA, Monteiro PJM. Hydration evolution of C3S-EVA composites analyzed by soft X-ray microscopy. Cement and Concrete Research. 2005;35:351–7. [Google Scholar]
- 20.De Luca AC, Rusciano G, Pesce G, Caserta S, Guido S, Sasso A. Diffusion in polymer blends by Raman microscopy. Macromolecules. 2008;41:5512–4. [Google Scholar]
- 21.Bridges TE, Uibel RH, Harris JM. Measuring diffusion of molecules into individual polymer particles by confocal Raman microscopy. Analytical chemistry. 2006;78:2121–9. doi: 10.1021/ac052056n. [DOI] [PubMed] [Google Scholar]
- 22.Hashida T, Tashiro K. Structural investigation on water-induced phase transitions of poly(ethylene imine), Part IV: Changes of intra- and intermolecular hydrogen bonds in the hydration processes as revealed by time-resolved Raman spectral measurements. Polymer. 2007;48:7614–22. [Google Scholar]
- 23.Caspers PJ, Lucassen GW, Bruining HA, Puppels GJ. Automated depth-scanning confocal Raman microspectrometer for rapid in vivo determination of water concentration profiles in human skin. Journal of Raman Spectroscopy. 2000;31:813–8. [Google Scholar]
- 24.Motokawa R, Annaka M, Nakahira T, Koizumi S. Small-angle neutron scattering study on microstructure of poly(N-isopropylacrylamide)-block-poly(ethylene glycol) in water. Colloid Surf B-Biointerfaces. 2004;38:213–9. doi: 10.1016/j.colsurfb.2004.01.019. [DOI] [PubMed] [Google Scholar]
- 25.Sugiyama M, Annaka M, Hara K, Vigild ME, Wignall GD. Small-angle scattering study of mesoscopic structures in charged gel and their evolution on dehydration. J Phys Chem B. 2003;107:6300–8. [Google Scholar]
- 26.Murthy NS, Akkapeddi MK, Orts WJ. Analysis of lamellar structure in semicrystalline polymers by studying the absorption of water and ethylene glycol in nylons using small-angle neutron scattering. Macromolecules. 1998;31:142–52. [Google Scholar]
- 27.Murthy NS, Orts WJ. Hydration in Semicrystalline Polymers - Small-Angle Neutron-Scattering Studies of the Effect of Drawing in Nylon-6 Fibers. J Polym Sci, Part B: Polym Phys. 1994;32:2695–703. [Google Scholar]
- 28.Brocchini S, James K, Tangpasuthadol V, Kohn J. A combinatorial approach for polymer design. JACS. 1997;119:4553–4. [Google Scholar]
- 29.Hooper KA, Macon ND, Kohn J. Comparative histological evaluation of new tyrosine-derived polymers and poly (L-lactic acid) as a function of polymer degradation. J Biomed Mater Res. 1998;41:443–54. doi: 10.1002/(sici)1097-4636(19980905)41:3<443::aid-jbm14>3.0.co;2-j. [DOI] [PubMed] [Google Scholar]
- 30.Medical News Today. FDA approves first medical device for hernia repair using rutgers biomaterial. Online. 2006 [Google Scholar]
- 31.Fiordeliso J, Bron S, Kohn J. Design, synthesis, and preliminary characterization of tyrosine-containing polyarylates: new biomaterials for medical applications. Journal of Biomaterials Science-Polymer Edition. 1994;5:497–510. [PubMed] [Google Scholar]
- 32.Zhang G, Moore DJ, Sloan KB, Flach CR, Mendelsohn R. Imaging the Prodrug-to-Drug Transformation of a 5-Fluorouracil Derivative in Skin by Confocal Raman Microscopy. J Invest Dermatol. 2007;127:1205–9. doi: 10.1038/sj.jid.5700690. [DOI] [PubMed] [Google Scholar]
- 33.Suarez N, Brocchini S, Kohn J. The study of water uptake in degradable polymers by thermally stimulated depolarization currents. Biomaterials. 1998;19:2347–56. doi: 10.1016/s0142-9612(98)00151-3. [DOI] [PubMed] [Google Scholar]
- 34.Yager P, Gaber BP. Membranes. In: Spiro TG, editor. Biological Applications of Raman Spectroscopy. NY: Wiley; 1987. pp. 203–61. [Google Scholar]
- 35.Higgins JS, Benoît H. Polymers and neutron scattering. Clarendon Press Oxford; 1994. [Google Scholar]
- 36.Misra A, David D, Snelgrove J, Matis G. Clustering of absorbed water in amorphous polymer systems. Journal of applied polymer science. 1986;31:2387–98. [Google Scholar]
- 37.Husken D, Gaymans RJ. The Structure of Water in PEO-Based Segmented Block Copolymers and its Effect on Transition Temperatures. Macromolecular Chemistry and Physics. 2008;209:967–79. [Google Scholar]
- 38.Martin JE, Hurd A. Scattering from fractals. Journal of applied crystallography. 1987;20:61–78. [Google Scholar]
- 39.Siparsky GL, Voorhees KJ, Miao FD. Hydrolysis of polylactic acid (PLA) and polycaprolactone (PCL) in aqueous acetonitrile solutions: Autocatalysis. J Environ Polym Degrad. 1998;6:31–41. [Google Scholar]


