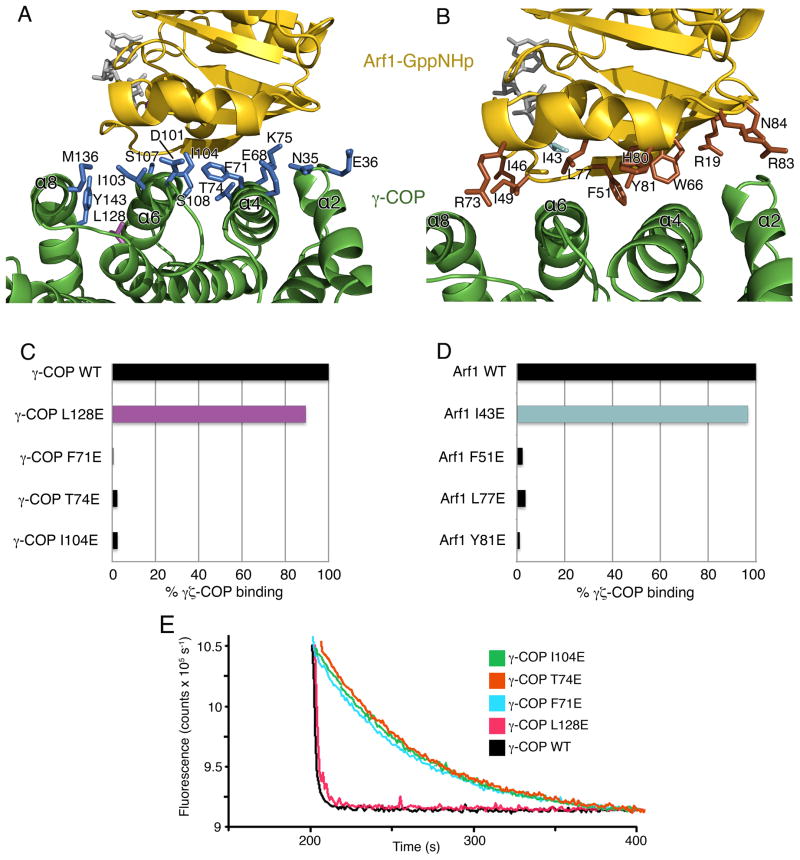
Figure 4. Interacting Surfaces of γζ-COP and Arf1.
(A) Close-up view showing the interface of γ-COP (green) and Arf1 (gold). Side-chain groups from γ-COP that reside at the interface (within 3.5Å of Arf1) are drawn in blue. One γ-COP residue not at the interface, Leu128, is colored purple; this residue was chosen as a control mutation for experiments shown in (C) and (E). The picture is rotated approximately 180° around a vertical axis relative to Figure 3A.
(B) Close-up view in a similar orientation to (A), with side-chain groups from Arf1 colored brown. In the Arf1 mutagenesis experiments, residue I43 (colored cyan) was chosen as a control mutation since it is distant from the protein-protein interface.
(C) Bar graph shows the effects of mutating γ-COP interfacial residues on the interaction between γζ-COP and Arf1, as measured by the pull-down assay. Mutations were introduced into full-length γ-COP. Binding is expressed as a percentage of the binding of wild type γζ-COP. The control γ-COP mutant, L128E, corresponds to the side chain colored purple in (A).
(D) Bar graph shows the effects of mutations in S. cerevisiae Arf1 on the interaction with full-length γζ-COP. Note that the interfacial residues chosen for mutagenesis—F51, L77 and Y81—are identical in human Arf1. The Arf1 control mutant I43E (cyan) is a valine residue in the human Arf1 sequence.
(E) The ability of γ-COP mutants to synergize with GAP in GTP hydrolysis was measured using the fluorescence assay. The effect of the γ-COP mutations is essentially the same as in the pull-down assay (C). Curves have been offset incrementally along the x-axis.

