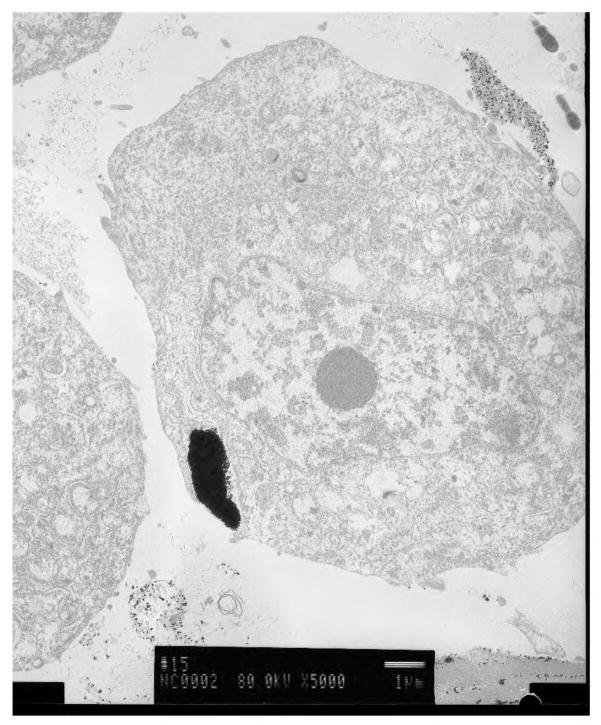
Circulating tumor cells (CTCs) are those cells that undergo transitions that promote detachment from a solid tumor and allow them to travel in suspension through the blood and lymph systems in order to create secondary tumors. Detection of CTCs may allow earlier diagnosis, determine remission and relapse, and monitor response to therapy, as the concentration of CTCs has been shown to correlate with disease state [1–3]. We have been successful in detecting and capturing pigmented, circulating melanoma cells (CMCs) due to their natural light absorbing nature, though cancer cells of other types lack intrinsic color and cannot be detected without the addition of extrinsic optical absorbers. We investigated non-pigmented CTC detection using antibody targeted gold nanoparticles in a breast cancer cell line, T47D. (Figure 1) The specific targeting of gold nanoparticles to breast cancer cells allowed us to repeat our earlier success with melanoma by detection of these cells in suspension in our photoacoustic flowmeter. In addition to the direct clinical benefit of detecting CTCs, this system may be used to capture CTCs for clinically relevant cancer biology research. Malignant cancer cells not only have acquired genetic mutations that enable uncontrolled proliferation and tumor formation, but have also acquired the ability to leave the primary tumor and set up secondary tumor growths in other tissues throughout the body. Indeed, we now appreciate that metastasis - the formation of multiple secondary tumors - is the primary cause of death in cancer patients. Multiple therapeutic options, including surgery, radiation and chemotherapy, can be used to kill cancer cells in a primary tumor. Because of their singular importance in the pathogenesis of the disease, metastatic cancer cells represent the single most important therapeutic target for cancer treatment. A major goal of cancer research is to define the mechanisms that lead to metastasis and identify unique properties of metastatic cells that can be exploited for therapy [4, 5]. Using photoacoustic flowmetry, we may be able to capture CTCs and perform such studies in order to validate and enable future therapies.
Figure 1.
A breast cancer cell with nanoparticles endocytosed into it.
Other methods are being investigated for detection of CTCs, including immunomagnetic separation, PCR methods, micofluidic capture, and conventional flow cytometry, though photoacoustic flowmetry allows sensitive detection and capture of intact CTCs in suspension [6–15]. This advantage allows further testing of the cells, including imaging or molecular and genetic assays. Conventional flow cytometry shares this advantage, but its implementation is not suited for detection of rare events, such as the case in CTCs where only a few cells might be present among billions of normal blood cells in a 10 ml sample.
Biology and clinical importance of detection of CTCs
The detection and characterization of CTCs is a clinically important goal. For example, simply tracking the concentration of CTCs in the blood of patients over time will provide insight into the disease status of a patient and can be used to monitor the response of a patient to therapy. Furthermore, information gained from molecular analyses of these CTCs can provide crucial information regarding the presence of specific DNA mutations or cell-surface proteins. Such molecular information can be of prognostic value in the clinic and can also provide new insights into fundamental questions of cancer biology.
A metastatic cell must leave the primary tumor and enter either the lymphatic system or the vasculature. Subsequently, the cell must invade distant tissue and proliferate to form a metastatic tumor [16]. Thus, metastatic cells are derived from cells that were, at one time, CTCs. However, the molecular characteristics of a CTC that enable it to seed sites of metastatic tumor growth are largely unknown.
A fundamental question is the relationship between CTCs and cancer stem cells (CSCs). CSCs, which are defined by their ability to form a tumor, are of considerable interest for both clinical assessments and for our understanding of cancer biology [17]. Although CSCs are thought to comprise a small percentage of cells in the primary tumor for many cancers, recent work has suggested that more than 25% of cells within a primary melanoma have the ability to form a tumor when transplanted into severely immunocompromised mice [18].
Recent work with breast cancer stem cells has suggested that the epithelial-mesenchymal transition (EMT) is a key determinant of the CSC phenotype [19]. Forced expression of transcription factors that regulate the EMT, including Twist1 and Snail, in mammary epithelial cells increases both tumorigenicity and expression of cell surface markers that are markers of breast cancer stem cells [19]. Efforts have been made to identify the cell surface proteome of both tumor derived cancer cells [20–24] and CTCs [25,26], but expression of these proteins on cancer cells is very heterogenous and the precise relationship of these markers to CSCs and tumorigenicity is not clear [18, 22]. A promising candidate is CD271 [20], a marker for neural crest cells.
We propose that the EMT characteristics of a CTC will be a good predictor of its metastatic ability. The development of reliable assays that measure the EMT characteristics in CTCs could be used as prognostic clinical indicators of the likelihood that cancer patients will develop metastases. The characterization of CTCs, which relies on the ability to isolate human CTCs, will provide important biological information to make photoacoustic detection an important diagnostic tool.
Photoacoustic interactions with nanoparticles
The use of light as a diagnostic tool in biomedical engineering and research has grown considerably in recent years. While most diagnostic procedures in biomedical optics exploit the optical nature of the light-tissue interaction, photoacoustics uses optical energy to generate an acoustic wave in tissue. The acoustic wave is a robust means for carrying information that is immune to the highly photon scattering and signal degrading nature of tissue. Thus, photoacoustics combines the high selectivity of optical absorption of targeted cells and tissue with the strong signal to noise ratio inherent in ultrasound propagation, the ideal balance of optical and acoustic techniques.
Our photoacoustic flowmeter introduces a new paradigm in CTC detection. In its present form, it targets pigmented cells directly and requires no molecular labeling (Figure 2). Furthermore, the system has the potential to be fully automated, requiring no human intervention. The system we propose to develop will perform enrichment and isolation as well as using a statistical classifier for detecting the presence of melanoma cells in the sample. The blood sample will be separated by two phase flow principles, so that rather than continuous flow, microdroplets of cells suspended in saline separated by similar sized bubbles of air will pass through the detection area of the flow chamber. Droplets that generate photoacoustic waves will be directed to a holding cuvette that can be used for further analysis. Thus, not only can the presence and number of CTCs be determined, but isolation of the CTC will allow verification of the test, along with the opportunity to conduct studies on CTCs to investigate questions about tumor biology and to provide clinically relevant information for management of advanced cancer. Photoacoustics has been used to detect particles in suspension in a flowmetry scheme by Autrey et al. [27]. They performed measurements on latex microspheres and conducted analysis and modeling of the photoacoustic response with respect to shape and number. Detection of melanoma cells in suspension was first shown in our paper by Weight et al. [28]. We demonstrated the use of a photoacoustic flowmeter to detect melanoma cells with a limit of less than 10 CMC's at a time.
Figure 2.
The photoacoustic flowmeter separates continuous flow of blood cells with air bubbles. The resulting blood cell suspension droplets are irradiated by laser light. Droplets that contain CTCs generate photoacoustic waves that are sensed by an acoustic transducer. The waveform on the right shows a photoacoustic wave generated in a melanoma cell. These droplets are shunted off to a collection cuvette for further analysis. Negative bubbles are diverted for disposal.
Furthermore, in Holan et al. [29], we have shown the efficacy of using the maximal overlap discrete wavelet transform (MODWT) to denoise photoacoustic signals in order to improve detection of CMC's, in vitro.
Zharov et al. has developed a photoacoustic method in which they detect CMCs in vivo using a rabbit model [30, 31]. This work is groundbreaking in that it is non-invasive. However, translating this detection to a human being may be problematic, since the thicker tissue separating a detection device and blood vessels will cause optical and acoustic attenuation. Furthermore, this method, being in vivo, precludes cell isolation and capture.
We have used photoacoustic principles and coupled them with flow cytometric concepts and created a photoacoustic flowmeter capable of detecting and enumerating small, light absorbing particles under flow. In contrast to conventional flow cytometry [32, 33], wherein targeted cells are tagged to create fluorescent signals, we target cells with some pigment or light absorber to create high frequency ultrasonic waves. In the photoacoustic flowmeter, the fluids are leukocytes suspended in phosphate buffered saline (PBS) and air. Two phase flow allows us to sequester any CTC in a localized volume so that capture and purification can be easily done. Additionally, the air barrier between droplets of PBS create an acoustic free surface that limits photoacoustic signals to remain within its own droplet, thus preventing crosstalk from nearby droplets [34, 35].
Materials and Methods
Photoacoustic detection
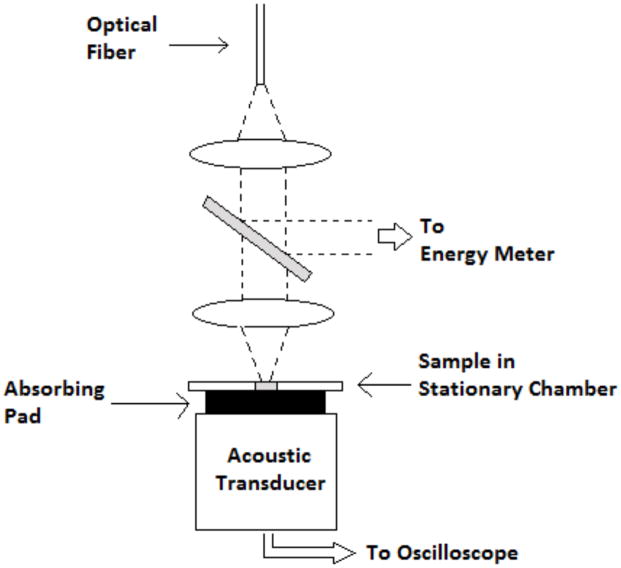
The photoacoustic system used for this research consisted of a tunable Opotek Vibrant (Vibrant 355 II, Opotek, Carlsbad, California) 355 II Q-switched laser system to irradiate our samples pulsing at a wavelength of 532 nm. The laser pulsed at a 10 Hz repetition rate with approximate 5 ns duration. The average energy of the laser pulse at 532nm was 3.5 mJ. The pulsed light beam was delivered to a glass microcuvette containing the sample of interest by use of an optical fiber. The microcuvette had a cylindrical hole ground in the center of the microscope slide with a diameter of 1.2mm (Figure 3). The microcuvette contained 5 μL of liquid sample and was coupled to an ultrasound transducer by ultrasound gel and an optical scattering pad. This scattering pad was made from acrylamide gel mixed with Intralipid (Abbot Laboratories, Chicago, Illinois) in order to attenuate the laser beam and protect the transducer. The acoustic signal generated was then detected using the ultrasound transducer probe (RMV-708), attached to the Vevo 770 Imaging system (Visual Sonics Inc., Toronto, Ontatio, Canada) with 30 μm resolution and frame rates up to 240 frames per second (fps). The ultrasound imaging probe housed a single piezoelectric sensing element, which moved at the user defined frame rate to collect lines of data within each frame. The ultrasound machine, set at 10 fps, was used to trigger the 10 Hz Q-switched laser in order to time the laser pulse with the desired position of the piezoelectric element within the probe. The frame trigger was delayed with a digital delay generator (DG535, Stanford Research Systems, Inc., Sunnyvale, California). In this case, the desired position of the element was directly below the sample being irradiated. All the signals were amplified with 31dB gain from the Vevo imaging system and the signals were recorded using the 200MHz oscilloscope (TDS 2034B, Tektronix, Wilsonville, Oregon).
Figure 3.
The photoacoustic set up for measurements no under flow is shown here. This set up was used for the photoacoustic spectrum measurements. The flow measurements were performed in a similar manner, except that rather than a stationary chamber, cell suspension was sent through the laser beam under flow through a cylindrical chamber.
The experiment was repeated 5 times and the signals for each respective time period were analyzed with respect the control
For the breast cancer detection experiments, we used a flow system, rather than the stationary cuvette described above. This flow chamber was acoustically matched to the transducer and differed from the cuvette in that a 1.5mm cylindrical flow path was used to transport cell suspension through a laser beam. The laser beam, consisting of a slowly diverging beam, irradiated a volume in the flow chamber of about 15 μL.
Nanoparticle attachment
Carboxyl to amine conjugation using the EDC-NHS procedure was used to attach carboxylated nanoparticles to the anti-EpCam antibody [36].
50 μL of gold nanoparticles suspended in deionized (DI) water containing ≈1:5 × 10¹¹ nanoparticles were incubated with 135 μL of 0.3 μM solution of EDC dissolved in DI water combined with 200 μL of 0.4 μM solution of NHS for 15 minutes at room temperature ≈22°C. This step allowed for the activation of the carboxyl bonds on the nanoparticle surface. After 15 minutes, 2 μL of 100 μg/ ml of anti-EpCam solution, (Thermo Scientific: Pierce Protein Research Products, Waltham, Massachusetts) was added to previous solution of now carboxyl activated gold nanoparticles and allowed to react for 2 hours at room temperature. After 2 hours, 613 μL of DI water was added to the previous solution to bring the total volume to 1 ml in order to make consequent calculations simpler. Following which 6.67 μL of the gold nanoparticle suspension was incubated with 1x10⁶ T47D breast cancer cells suspended in 1 ml of PBS solution for 1 hour in order to allow the nanoparticles to attach to the cancer cell. After 1 hour, the cell solution was cleaned of excess nanoparticles by centrifugation. This was repeated three times at 1400 RPM for 12 minutes and the cells were washed after each cycle. Cells with attached nanoparticles were imaged using a fluorescent microscope (LSM 510 META NLO, Carl Zeiss, Inc., Oberkochen, Germany)
Rhodamine attachment to nanoparticles
In order to verify nanoparticle attachment to the breast cancer cells, we conjugated rhodamine dye molecules to the nanoparticles. Thus, fluorescence imaging could be used to verify nanoparticle attachment.
The same carboxyl-to-amine conjugation using the EDC-NHS procedure was used to attach rhodamine 6G, which has 2 carboxyl groups per molecule, to the anti-EpCam-AuNP conjugate, where AuNP refers to gold nanoparticle.
We dissolved 80 μL of 1 μM rhodamine solution in DI water and incubated with 135 μL of 0.3 μM solution of EDC dissolved in DI water combined with 200 μL of 0.4 μM solution of NHS for 15 minutes at room temperature, approximately 22°C. This step activated the carboxyl groups on the rhodamine molecules.
After 15 minutes, 585 μL the anti-EpCam-AuNP conjugate prepared earlier is added to the rhodamine solution and allowed to react for 12 hours at 4°C in order to attach the rhodamine to the antibody on the anti-EpCam-AuNP conjugate. After 12 hours, the excess unreacted rhodamine was cleaned out of the solution by centrifugation at 6000RPM for 10 minutes. This was repeated 3 times. The high centrifugation speed was necessary to ensure that the rhodamine-antibody-AuNP conjugate would form a pellet.
10 μL of this new conjugate was incubated with 1× 10⁶ T47D cells in 1 ml of PBS for 1 hour. A different cell suspension with 1× 10⁶ T47D cells in 1 ml as well, was first incubated with 2 μL of excess anti-EpCam stock solution to block EpCam receptors on the cell surface and then incubated with 10 μL of rhodamine-antibody-AuNP solution for 1 hour. Both cell suspensions were cleaned by centrifugation at 1400RPM for 12 minutes. The cleaning process was repeated 3 times for both suspensions. The receptor blocked cells serve as the control to show the specificity of the AuNP target.
Photoacoustic spectrum of nanoparticles
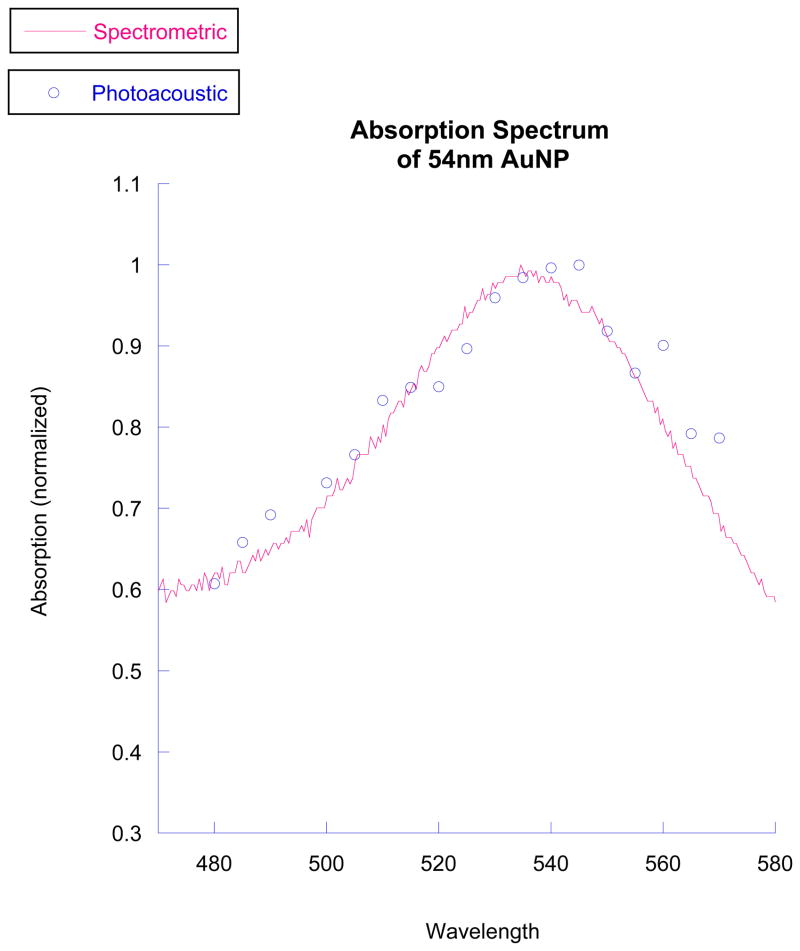
We performed spectroscopic analysis of the gold nanoparticles using a white light transmission spectrometer and compared it to the photoacoustic response as a function of wavelength from 480–570 nm. The spectrometer was an Ocean Optics HR200 (Ocean Optics, Dunedin, Florida) with a tungsten arc lamp source. In order to compare the photoacoustic response directly to the white light measurements, we normalized the absorbance by the highest measured value to obtain a relative absorbance for both spectra. The photoacoustic measurements were performed as described above in the non-owing set up. We used 4 μL of stock gold nanoparticle suspension and tested the photoacoustic response in 10nm increments. The same sample was irradiated in the entire range of laser wavelengths.
Photoacoustic detection of tagged breast cancer cells
Using antibody targeted T47D breast cancer cells, we performed serial dilutions and tested them in the photoacoustic flowmeter. Since we were not capturing cells, we used a continuous flow of cell suspension in these experiments. We used 532nm laser wavelength with 4.1mJ of laser energy. The beam volume through the detection chamber was 15 μL and the flow rate was 100 μL per minute. Each waveform was from a single laser pulse, thus no waveform averaging was performed.
Results
Attachment of nanoparticles to breast cancer cells
Figure 4 shows selective attachment of gold nanoparticles to breast cancer cells, verified by fluorescent measurements. The control cells were exposed to fluorescently labeled gold nanoparticles while to others were exposed to gold nanoparticles conjugated to the EpCAM antibody. The figure shows no uorescence on the control, while EpCAM targeted cells show significant nanoparticle attachment.
Figure 4.
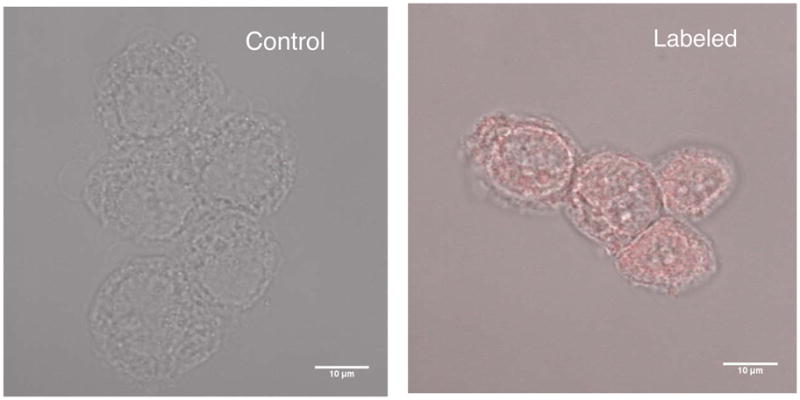
(Left) Control T47D cells incubated in the presence of gold nanoparticles not conjugated to anti-EpCAM show not nanoparticle enhancement. (Right) T47D cells incubated with nanoparticles targeting anti-EpCAM show attachment by rhodamine fluorescence.
Photoacoustic spectrum of nanoparticles
The photoacoustic spectrum of the nanoparticles is shown alongside the spectrum obtained from white light spectroscopy in Figure 5. The photoacoustic peak is approximately 540 nm, while the white light peak is at about 538 nm.
Figure 5.
The photoacoustic peak absorption closely matches that indicated by white light spectroscopy. The peaks, about 540 nm, are to the 532nm wavelength we used. This wavelength was chosen as it is the second harmonic of an Nd:YAG laser.
Photoacoustic detection of tagged breast cancer cells
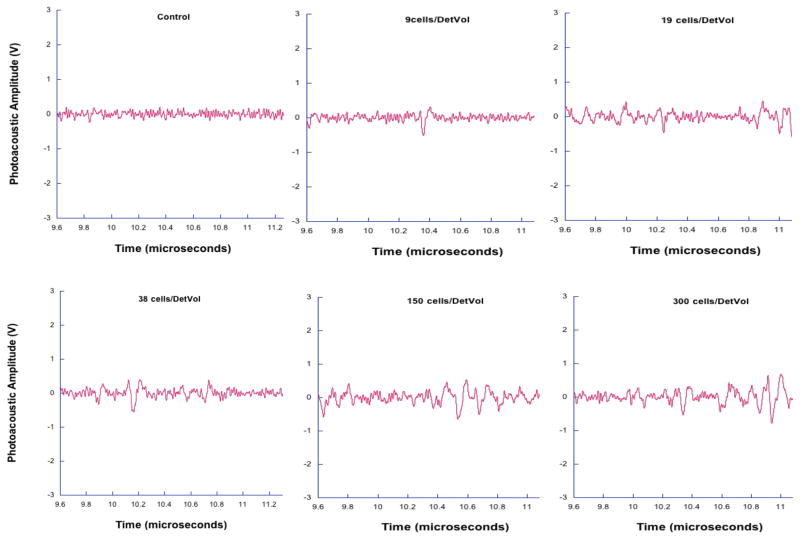
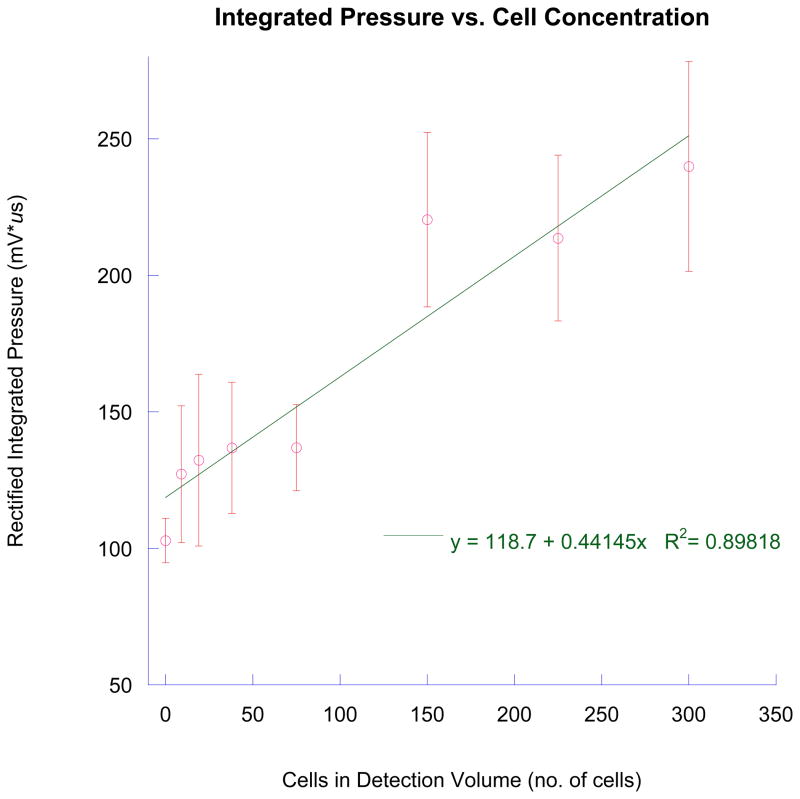
Photoacoustic waveforms from irradiating 9, 19, 38, 150, and 300 tagged breast cancer cells are shown along with a control in Figure 6. In each case, the number of photoacoustic waves is less than indicated by the expected number of cancer cells. However, total energy indicated by the area under the curve of each pressure wave shows an increasing trend. Figure 7 shows the integrated pressure as a function of cell concentration. This figure approximates the total photoacoustic energy obtained and correlates it to the expected cell number.
Figure 6.
This data shows photoacoustic waves generated in tagged breast cancer cells. While the number of peaks do not correlate with expected cell number, the total photoacoustic energy, indicated by the area under the pressure waves, has an increasing trend with increasing cell concentration.
Figure 7.
Integrated pressure provides a means to correlate with cell number in the detection volume. This measure, in contrast to numbers of photoacoustic waveforms, indicates breast cancer cells may be aggregating to form clusters of light absorbers.
Discussion
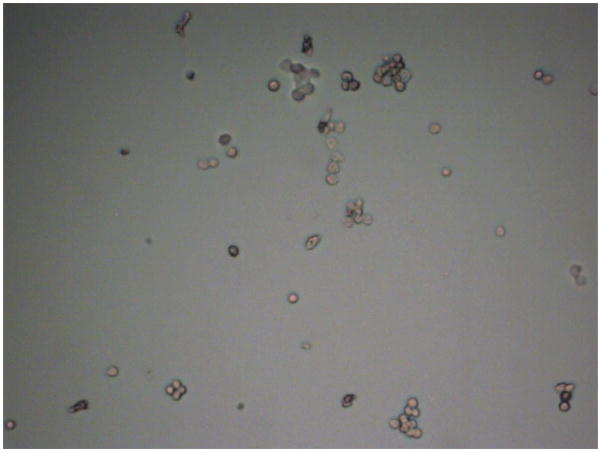
We have presented results showing successful nanoparticle attachment to the T47D breast cancer cell line. These nanoparticles provided optical contrast resulting in photoacoustic generation in our flowmeter. While we did not specifically show single breast cancer cell detection, we claim that this system may be capable of such detection. Our results were confounded by cell clumping. (Figure 8) However, we believe that single cell detection is possible, and in the clinical case, CTC clumping would not necessarily be present. Using a tunable laser system, we can target different absorption peaks, such as those associated with dyed microspheres or nanoparticles of different diameters. The photoacoustic response as a function of wavelength showed a peak close to 540 nm. Using the second harmonic of the Nd:YAG laser, we were successful in exploiting high optical absorption. In future applications, different absorption peaks can be targeted with the tunable ability of an optical parametric oscillator pumped laser system.
Figure 8.
Micrograph shows breast cancer cells clumping. Because of the close spatial relationship of clumped cells, a single photoacoustic waveform is generated, although it has commensurately greater energy.
Justification of single cell detection
Single cells and clusters of cells cannot yet be differentiated by the photoacoustic flowmetry system. Therefore, relating photoacoustic events to the number of cells being irradiated in the flow chamber must take into account if the cell suspension being tested has groups of clustered cells along with single cells.
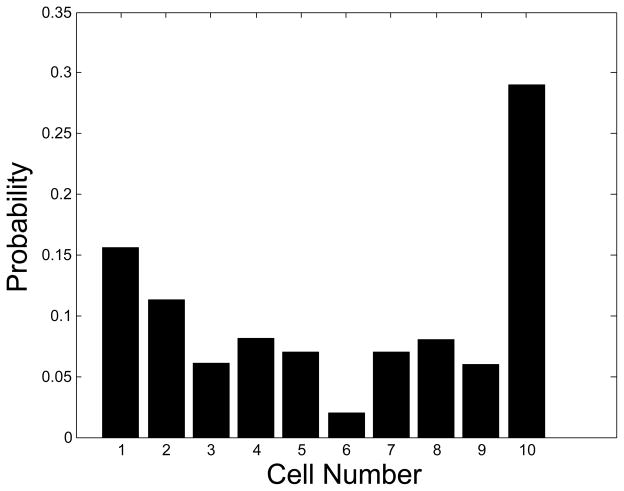
Figure 9 gives the probability, P(c), that any given cell in the sample is in a cluster of size c e.g. any random cell has a ≈29% chance of being in a cluster with 9 or more other cells. This distribution was arrived at by counting, with the aid light microscopy, 563 cells in the sample, some of which were found to be in these clusters and others were individually dispersed. Therefore, the total number of clusters and single cells in a cell suspension can be calculated if the total number of cells is known. 9 cells/detection volume, when the detection volume is 15 μL, is 600 cells/ ml. Given that the clustering distribution applies to this sample, there would be 195 clusters/ ml, including single cells which have a cluster size of 1.This was arrived at with the following formula:
where N is the number of cells per ml, 600 in this case, and P(c) and c were previously defined. This concentration of 195 clusters/ ml relates better to the number of photoacoustic events expected in the detection volume than the total cell concentration of 600 cells/ ml. The total number of photoacoustic events in 14 waveforms were counted and found to be 38, each waveform representing a signal from a 15 μL volume, for a total of 210 μL. The expected number of clusters in that volume calculated from the concentration would be (195)*(0:210) = 40:95, or approximately 41 clusters.
Figure 9.
Histogram showing probabilities of cells in each clump during the photoacoustic flow test.
The agreement between the number of counted events, 38, and the expected number of clusters, 41, is an indication of robust detection. The disparity can be attributed to a random deviation from the expected value. According to the Poisson distribution, when the expected value is 41, there is a 6.2% chance of measuring exactly 41 events and a 5.7% of measuring exactly 38 events. Though the probabilities are different, a distinction between them can only be made with a very large sample size.
This is a strong indication that almost all, if not every cluster, including single cells which have a cluster size of 1 cell, was detected by the flowmetry system.
Summary
Photoacoustic flowmetry has been used to detect pigmented particles in body fluids, most notably circulating melanoma cells in blood samples of metastatic melanoma patients. Exploiting the plasmon resonance of gold nanoparticles and the ability to specifically target cancer cell surface proteins, photoacoustic flowmetry may be used to detect non-pigmented CTCs. We targeted the EpCAM receptors to attach 50nm gold nanoparticles to a breast cancer cell line, T47D. After determining the absorption peak and thus the most sensitive laser wavelength, we performed serial dilution trials to show detection of small numbers of breast cancer cells in suspension. While some cell clumping may have altered some of our results for cell counting, it is feasible to use gold nanoparticles to detect and capture CTCs in a photoacoustic flowmeter. This ability may allow an earlier clinical diagnosis and management of metastatic disease for a range of solid tumor types. Capture of CTCs may also allow cell specific molecular analysis and a new paradigm for personalized cancer therapy.
Acknowledgments
We acknowledge the support of the Department of Biological Engineering and the Christopher S. Bond Life Sciences Center at the University of Missouri. We acknowledge grant support from Missouri Life Sciences Research Board 09-1034 and NIH R21CA139186-0. We also thank the Life Sciences Undergraduate Research Opportunity Program at the University of Missouri, the University of Missouri Molecular Cytology Core, and the University of Missouri College of Engineering for financial support.
Footnotes
CONFLICT OF INTEREST
Dr. Viator has invented photoacoustic flowmetry for in vitro detection of pathological analytes in body fluids and has formed Viator Technologies Inc to commercialize this technology.
Publisher's Disclaimer: This is a PDF file of an unedited manuscript that has been accepted for publication. As a service to our customers we are providing this early version of the manuscript. The manuscript will undergo copyediting, typesetting, and review of the resulting proof before it is published in its final citable form. Please note that during the production process errors may be discovered which could affect the content, and all legal disclaimers that apply to the journal pertain.
References
- 1.Paterlini-Brechot P, Benali NL. Circulating tumor cells (CTC) detection: clinical impact and future directions. Cancer letters. 2007;253:180–204. doi: 10.1016/j.canlet.2006.12.014. [DOI] [PubMed] [Google Scholar]
- 2.Cristofanilli M, Braun S. Circulating tumor cells revisited. JAMA. 2010;303:1092. doi: 10.1001/jama.2010.292. [DOI] [PubMed] [Google Scholar]
- 3.Gage T, Fan SL. What goes around, comes around: A review of circulating tumor cells. analysis. 2010;11:18. [Google Scholar]
- 4.Bonnomet A, Brysse A, Tachsidis A, et al. Epithelial-to-Mesenchymal Transitions and Circulating Tumor Cells. Journal of Mammary Gland Biology and Neoplasia. 2010:1–13. doi: 10.1007/s10911-010-9174-0. [DOI] [PubMed] [Google Scholar]
- 5.Maheswaran S, Haber DA. Circulating tumor cells: a window into cancer biology and metastasis. Current Opin Genetics & develop. 2010 doi: 10.1016/j.gde.2009.12.002. [DOI] [PMC free article] [PubMed] [Google Scholar]
- 6.Chang YC, Ye JY, Thomas TP, et al. Fiber-optic multiphoton flow cytometry in whole blood and in vivo. Journal of Biomedical Optics. 2010;15:047004. doi: 10.1117/1.3463481. [DOI] [PMC free article] [PubMed] [Google Scholar]
- 7.Okegawa T, Hayashi K, Hara H, Nutahara K, Higashihara E. Immunomagnetic quantification of circulating tumor cells in patients with urothelial cancer. International Journal of Urology. 2010;17:254–258. doi: 10.1111/j.1442-2042.2010.02454.x. [DOI] [PubMed] [Google Scholar]
- 8.Xu T, Lu B, Tai YC, Goldkorn A. A Cancer Detection Platform Which Measures Telomerase Activity from Live Circulating Tumor Cells Captured on a Microfilter. Cancer Research. 2010;70:6420. doi: 10.1158/0008-5472.CAN-10-0686. [DOI] [PMC free article] [PubMed] [Google Scholar]
- 9.Nagrath S, Sequist LV, Maheswaran S, et al. Isolation of rare circulating tumour cells in cancer patients by microchip technology. Nature. 2007;450:1235–1239. doi: 10.1038/nature06385. [DOI] [PMC free article] [PubMed] [Google Scholar]
- 10.Riethdorf S, Fritsche H, Muller V, et al. Detection of circulating tumor cells in peripheral blood of patients with metastatic breast cancer: a validation study of the CellSearch system. Clinical Cancer Research. 2007;13:920–928. doi: 10.1158/1078-0432.CCR-06-1695. [DOI] [PubMed] [Google Scholar]
- 11.Zheng S, Lin H, Liu JQ, et al. Membrane microfilter device for selective capture, electrolysis and genomic analysis of human circulating tumor cells. Journal of Chromatography. 2007;1162:154–161. doi: 10.1016/j.chroma.2007.05.064. [DOI] [PubMed] [Google Scholar]
- 12.Zabaglo L, Ormerod MG, Parton M, Ring A, Smith IE, Dowsett M. Cell filtration-laser scanning cytometry for the characterization of circulating breast cancer cells. Cytom Part A. 2003:102–108. doi: 10.1002/cyto.a.10071. [DOI] [PubMed] [Google Scholar]
- 13.Gogas H, kefala G, Bafaloukus D, et al. Prognostic signifiance of the sequential detection of circulating melanoma cells by RT-PCR in high-risk melanoma patients receiving adjuvant interferon. British Journal of Cancer. 2003;88:981–982. doi: 10.1038/sj.bjc.6600419. [DOI] [PMC free article] [PubMed] [Google Scholar]
- 14.Pellegrino D, Bellina C, Manca G, et al. Detection of melanoma cells in peripheral blood and sentinel lymph nodes by RT-PCR analysis: A comparative study with immunochemistry. Tumori. 2000;86:336–338. doi: 10.1177/030089160008600422. [DOI] [PubMed] [Google Scholar]
- 15.Berking C, Schlupen EM, Schraeder A, Atzpodien J, Volkenandt M. Tumor markers in peripheral blood of patients with malignant melanoma: multimarker RT-PCR versus a luminoimmunometric assay for S-100. Archives of dermatological research. 1999;291:479–484. doi: 10.1007/s004030050441. [DOI] [PubMed] [Google Scholar]
- 16.Gupta GP, Massague J. Cancer metastasis: building a framework. Cell. 2006;127:679–695. doi: 10.1016/j.cell.2006.11.001. [DOI] [PubMed] [Google Scholar]
- 17.Gupta PB, Chaffer CL, Weinberg RA. Cancer stem cells: mirage or reality? Nature medicine. 2009;15:1010–1012. doi: 10.1038/nm0909-1010. [DOI] [PubMed] [Google Scholar]
- 18.Quintana E, Shackleton M, Sabel MS, Fullen DR, Johnson TM, Morrison SJ. Efficient tumour formation by single human melanoma cells. Nature. 2008;456:593–598. doi: 10.1038/nature07567. [DOI] [PMC free article] [PubMed] [Google Scholar]
- 19.Mani SA, Guo W, Liao MJ, et al. The epithelial-mesenchymal transition generates cells with properties of stem cells. Cell. 2008;133:704–715. doi: 10.1016/j.cell.2008.03.027. [DOI] [PMC free article] [PubMed] [Google Scholar]
- 20.Boiko AD, Razorenova OV, Rijn M, et al. Human melanoma-initiating cells express neural crest nerve growth factor receptor CD271. Nature. 2010;466:133–137. doi: 10.1038/nature09161. [DOI] [PMC free article] [PubMed] [Google Scholar]
- 21.Cools-Lartigue JJ, McCauley CS, Marshall JCA, et al. Immunomagnetic isolation and in vitro expansion of human uveal melanoma cell lines. Molecular Vision. 2008;14:50. [PMC free article] [PubMed] [Google Scholar]
- 22.Held MA, Curley DP, Dankort D, McMahon M, Muthusamy V, Bosenberg MW. Characterization of melanoma cells capable of propagating tumors from a single cell. Cancer research. 2010;70:388. doi: 10.1158/0008-5472.CAN-09-2153. [DOI] [PMC free article] [PubMed] [Google Scholar]
- 23.Kaufman KL, Belov L, Huang P, et al. An extended antibody microarray for surface profiling metastatic melanoma. J of Immunol Meth. 2010:23–34. doi: 10.1016/j.jim.2010.03.017. [DOI] [PubMed] [Google Scholar]
- 24.Petermann KB, Rozenberg GI, Zedek D, et al. CD200 is induced by ERK and is a potential therapeutic target in melanoma. Journal of Clinical Investigation. 2007;117:3922–3929. doi: 10.1172/JCI32163. [DOI] [PMC free article] [PubMed] [Google Scholar]
- 25.Kitago M, Koyanagi K, Nakamura T, et al. mRNA expression and BRAF mutation in circulating melanoma cells isolated from peripheral blood with high molecular weight melanoma- associated antigen-specific monoclonal antibody beads. Clinical chemistry. 2009;55:757. doi: 10.1373/clinchem.2008.116467. [DOI] [PMC free article] [PubMed] [Google Scholar]
- 26.Nezos A, Lembessis P, Sourla A, Pissimissis N, Gogas H, Koutsilieris M. Molecular markers detecting circulating melanoma cells by reverse transcription polymerase chain reaction: methodological pitfalls and clinical relevance. Clinical Chemistry and Laboratory Medicine. 2008;47:1–11. doi: 10.1515/CCLM.2009.009. [DOI] [PubMed] [Google Scholar]
- 27.Autrey T, Egerev S, Foster NS, Fokin A, Ovchinnikov O. Counting particles by means of optoacoustics: Potential limits in real solutions. Rev Sci Instrum. 2003;74:628–631. [Google Scholar]
- 28.Weight RM, Dale PS, Caldwell CW, Lisle AE, Viator JA. Photoacoustic detection of metastatic melanoma cells in the human circulatory system. Opt Lett. 2006:2998–3000. doi: 10.1364/ol.31.002998. [DOI] [PubMed] [Google Scholar]
- 29.Holan SH, Viator JA. Automated wavelet denoising of photoacoustic signals for circulating melanoma cell detection and burn image reconstruction. Physics in Med Biol. 2008;53:N227. doi: 10.1088/0031-9155/53/12/N01. [DOI] [PubMed] [Google Scholar]
- 30.Zharov VP, Galanzha EI, Shashkov EV, Kim JW, Khlebtsov NG, Tuchin VV. Photoacoustic flow cytometry: principle and application for real-time detection of circulating single nanoparticles, pathogens, and contrast dyes in vivo. Journal of Biomedical Optics. 2007;12:051503. doi: 10.1117/1.2793746. [DOI] [PubMed] [Google Scholar]
- 31.Zharov VP, Galanzha EI, Shashkov EV, Khlebtsov NG, Tuchin VV. In vivo photoacoustic flow cytometry for monitoring of circulating single cancer cells and contrast agents. Optics letters. 2006;31:3623–3625. doi: 10.1364/ol.31.003623. [DOI] [PubMed] [Google Scholar]
- 32.Laerum OD, Farsund T. Clinical application of flow cytometry: a review. Cytometry. 1981;2:1–13. doi: 10.1002/cyto.990020102. [DOI] [PubMed] [Google Scholar]
- 33.Barlogie B, Raber MN, Schumann J, et al. Flow cytometry in clinical cancer research. Cancer Research. 1983;43:3982. [PubMed] [Google Scholar]
- 34.Jensen F, Kuperman WA, Porter MB, Schmidt H. Computational ocean acoustics. American Institute of Physics; 1995. [Google Scholar]
- 35.Blackstock DT. Fundamentals of physical acoustics. Wiley-Interscience; 2001. [Google Scholar]
- 36.Grabarek Z, Gergely J. Zero-length crosslinking procedure with the use of active esters* 1. Analytical biochemistry. 1990;185:131–135. doi: 10.1016/0003-2697(90)90267-d. [DOI] [PubMed] [Google Scholar]


