

Abstract
Hypothesis
We hypothesized that supplemental resveratrol would affect glucose metabolism in the skeletal muscle and liver to improve blood glucose control.
Design
Case-control study.
Setting
Hospital laboratory.
Subjects
Yorkshire miniswine.
Intervention
The swine developed metabolic syndrome by consuming a high-calorie, high–fat/cholesterol diet for 11 weeks. Pigs were fed either a normal diet (control) (n=7), a hypercholesterolemic diet (HCC) (n=7), or a hypercholesterolemic diet with supplemental resveratrol (100 mg/kg/d) (HCRV) (n=7). Animals underwent dextrose challenge prior to euthanasia and tissue collection.
Main Outcome Measures
Measurements of glucose and insulin levels, skeletal muscle and liver protein expression, and liver function test results.
Results
The HCC group had significantly increased blood glucose levels at 30 minutes as compared with the control and HCRV groups. The HCC group demonstrated increased fasting serum insulin levels and levels of aspartate aminotransferase, alanine aminotransferase, and alkaline phosphatase. Oil red O staining demonstrated increased lipid deposition in the livers of the HCC animals. Immunoblotting in the liver showed increased levels of mammalian target of rapamycin, insulin receptor substrate 1, and phosphorylated AKT in the HCRV group. Immunoblotting in skeletal muscle tissue demonstrated increased glucose transporter type 4 (Glut 4), peroxisome proliferating activation receptor γ coactivator 1α, peroxisome proliferator-activated receptor α, peroxisome proliferator-activated receptor γ, and phosphorylated AKT at threonine 308 expression as well as decreased retinol binding protein 4 in the HCRV group. Immunofluorescence staining for Glut 4 in the skeletal muscle demonstrated increased Glut 4 staining in the HCRV group compared with the HCC or control groups.
Conclusion
Supplemental resveratrol positively influences glucose metabolism pathways in the liver and skeletal muscle and leads to improved glucose control in a swine model of metabolic syndrome.
The high-cholesterol, high-fat, high-calorie diet consumed by many Americans, coupled with a sedentary lifestyle, has increased the incidence of obesity in the United States to approximately one-third of the population according to a 2008 study.1 Obesity predisposes to comorbidities including high blood pressure, hypertriglyceridemia, and hypercholesterolemia as well as glucose intolerance leading to type 2 diabetes mellitus (T2DM), which collectively are known as metabolic syndrome.2 Metabolic syndrome and its components affect 50 million Americans and more than double the risk of cardiovascular mortality.3
Skeletal muscle composes a large percentage of total body mass and is highly sensitive to the effects of insulin, making it critically important in glucose homeostasis.4 The liver is also critical for glucose metabolism because it stores glycogen and releases it as glucose when blood glucose levels are low. Obesity results in a signaling cascade that causes elevated levels of free fatty acids in the bloodstream and excessive lipid deposition in peripheral tissue.5 This increases skeletal muscle and liver insulin resistance and leads to greater total-body insulin resistance.6 In addition to insulin resistance, T2DM causes the liver to respond inappropriately to insulin, releasing glucose into the circulation even when levels are already elevated.7 Furthermore, high levels of free fatty acids are toxic to hepatocytes and result in additional dysregulation of glucose metabolism, contributing to the development of T2DM.8
Caloric restriction often leads to weight loss and a modification of the adverse effects of obesity including reversal of insulin resistance/prediabetes.9 In the long-term, however, especially in obese individuals, the rate of maintained weight control is very low.10,11
Resveratrol (trans-3,4′,5-trihydroxystilbene), a poly-phenol extract from plants, including red grapes, is thought to be the “heart-healthy” component of red wine.12 Resveratrol has been shown to biochemically simulate caloric restriction and to have a number of beneficial effects, including antioxidant and anticancer as well as antidiabetic properties.13,14 Small-animal studies have shown that resveratrol can restore insulin sensitivity and signaling in the skeletal muscle and liver as well as facilitate transport of cholesterol from peripheral tissue to the liver, ameliorating some of the dysfunctional lipid metabolism of T2DM.14–16
To date, there have been few studies performed in humans or clinically relevant large-animal models on the effects of resveratrol in metabolic syndrome. The aim of this article is to demonstrate the potential efficacy of resveratrol in a porcine model of metabolic syndrome. We hypothesize that supplemental resveratrol will increase sensitivity to insulin, normalize blood glucose levels, reduce weight gain, and prevent pathologic changes associated with metabolic syndrome through alterations in liver and skeletal muscle metabolic signaling.
METHODS
ANIMAL MODEL
All experiments were approved by the hospital institutional animal care and use committee. Animals were cared for in compliance with the Harvard Medical Area Institutional Animal Care and Use Committee and in accordance with the Principles of Laboratory Animal Care formulated by the National Society for Medical Research and the Guide for the Care and Use of Laboratory Animals.17
Yorkshire miniswine (Parsons Research, Amherst, Massachusetts) were fed 1 of 3 diets throughout the 11-week experiment. The first group was given 500 g of a hypercholesterolemic diet daily (HCC) (n=7) providing 2248 kcal/d composed of 4% cholesterol, 17.2% coconut oil, 2.3% corn oil, 1.5% sodium cholate, and 75% regular chow. A second group was fed the same hypercholesterolemic diet supplemented with 100 mg/kg/d of resveratrol (ChromaDex, Irvine, California) orally (HCRV) (n=7). The third group of swine was fed regular chow (control) (n=7, 1824 kcal/d) and served as the control. Animals were observed during feeding to ensure complete consumption of food and supplement.
After 11 weeks, swine were anesthetized, the heart was exposed, and physiologic measurements were taken, followed by euthanasia. Heart, liver, and skeletal muscle samples were collected. Tissue samples were rapidly frozen in liquid nitrogen (molecular studies) or placed in formalin, 10% (immunohistochemistry studies).
INTRAVENOUS GLUCOSE TOLERANCE TEST
Intravenous glucose tolerance testing was performed prior to euthanasia. A fasting baseline blood glucose level was measured and then dextrose, 0.5 g/kg, was infused. Blood glucose levels were measured 30 minutes postinfusion.
LIVER FUNCTION AND SERUM INSULIN TESTS
Serum liver chemistry and fasting insulin level analyses were performed with a Beckman DXC 800 Chemistry Analyzer (Beckman Coulter, Brea, California).
WESTERN BLOT ANALYSIS
Whole-cell lysates were isolated from the homogenized tissue samples with radioimmunoprecipitation assay buffer (Boston Bio-Products, Worcester, Massachusetts). Sixty micrograms of total protein were fractionated by 4% to 20% gradient sodium dodecyl sulfate polyacrylamide gel electrophoresis (Invitrogen, San Diego, California) and transferred to polyvinylidene fluoride membranes (Millipore, Bedford, Massachusetts). Membranes were incubated with specific antibodies. Expression levels of a protein that increases the expression of molecules important to metabolic homeostasis, peroxisome proliferator-activated receptor γ (PPAR-γ) (Cayman Chemical, Ann Arbor, Michigan), was assessed. Expression of retinol binding protein 4 (RBP4) (Abnova, Taipei City, Taiwan), a protein shown to inhibit proper insulin signaling, as well as glucose transporter type 4 (Glut 4), a protein that transports glucose across the cytoplasmic membrane of skeletal muscle, were assessed. Expression of phosphorylated AKT (phospho-AKT) at threonine 308 (T308) and serine 473 (S473), involved in stimulating translocation of Glut 4 to the cell membrane, were assessed. The level of insulin receptor substrate 1 (IRS-1), which when stimulated by insulin activates a signaling cascade through phospho-AKT resulting in improved glucose transport into the cell, was determined. Expression of PPAR-α, which increases insulin sensitivity, and mammalian target of rapamycin (mTOR) (Cell Signaling Technology, Danvers, Massachusetts), which helps activate phospho-AKT to diminish the amount of glucose released from the liver, were assessed. The membranes were incubated for 1 hour in diluted appropriate secondary antibody (Jackson ImmunoResearch, West Grove, Pennsylvania). Immune complexes were visualized with the enhanced chemiluminescence detection system (Amersham, Piscataway, New Jersey). Bands were quantified by densitometry digital images taken of the membranes (Syngene, Frederick, Maryland). Ponceau staining was used to ensure equal protein loading.
IMMUNOHISTOCHEMICAL ANALYSIS
Frozen tissue sections (12 μm in thickness) were equilibrated at room temperature and then fixed for 20 minutes in formalin at −20°C. Sections were blocked with bovine serum albumin, 1%, in phosphate-buffered saline for 1 hour at room temperature, labeled with anti–Glut 4 antibody (Epitomics, Burlingame, California), and incubated overnight at 4°C. Sections were incubated with a 1:100 dilution of secondary antibody (DyLight 488–conjugated antirabbit; Jackson ImmunoResearch) in the dark for 45 minutes, then mounted in Vectashield with 4′,6-diamidino-2-phenylindole (Vector Laboratories, Burlingame). Images were obtained with a Nikon E800 Eclipse microscope (Nikon, Tokyo, Japan) at ×100 and ×200 magnification.
HEMATOXYLIN-EOSIN STAINING AND OIL RED O STAINING IN THE LIVER
Hematoxylin staining and eosin counterstaining as well as oil red O staining for lipids counterstained with hematoxylin were performed on frozen liver sections in a standard fashion by the Pathology and Histology core facility at Rhode Island Hospital.
DATA ANALYSIS
All results are expressed as mean (SEM). Western blots were analyzed using National Institutes of Health ImageJ 1.40g software (National Institutes of Health, Bethesda, Maryland). Comparisons between groups were analyzed by 1-way analysis of variance with a Newman-Keuls multiple comparison post hoc test. A probability value of less than .05 was considered significant.
RESULTS
ANIMAL MODEL
All animals lived through the entire procedure. The swine had similar body weights at baseline. Immediately prior to euthanasia, the animals in the HCC group had significantly increased body mass compared with controls (P < .001), while the HCRV animals had body weights similar to the control group. Core body temperature at euthanasia was similar among all 3 groups (Table).
Table.
Weight, Liver Function, and Blood Glucose Clinical Data Obtained From Resveratrol-Treated and Untreated Swinea
| Data | Mean (SEM)
|
P Value | ||
|---|---|---|---|---|
| Control Group | HCC Group | HCRV Group | ||
| Prediet weight, kg | 18.14 (1.165) | 18.61 (0.798) | 17.23 (0.7150) | .60 |
| Postdiet weight, kg | 29.66 (1.541) | 38.46 (1.024) | 31.02 (0.673) | <.001b |
| Core body temperature, °C | 37.44 (0.302) | 37.83 (0.333) | 37.60 (0.351) | .69 |
| Baseline blood glucose level, mg/dL | 32.33 (6.835) | 59.00 (6.156) | 52.80 (5.276) | .03b |
| 30-min blood glucose level, mg/dL | 119.7 (7.740) | 171.0 (5.682) | 132.4 (14.11) | <.001b |
| Serum insulin level, ng/mL | 0.046 (0.002) | 0.099 (0.01) | 0.053 (0.009) | .002b |
| Liver function levels, mg/dL | ||||
| AST | 19.92 (1.270) | 29.70 (1.2210) | 25.10 (1.337) | <.001b |
| ALT | 42.86 (1.895) | 57.17 (4.929) | 41.00 (4.017) | .01b |
| ALP | 113.3 (4.497) | 146.8 (10.72) | 116.2 (10.68) | .03b |
| Total protein | 4.300 (0.111) | 4.500 (0.123) | 4.383 (0.172) | .57 |
| Albumin | 1.186 (0.026) | 1.333 (0.042) | 1.200 (0.045) | .03b |
Abbreviations: ALP, alkaline phosphatase; ALT, alanine aminotransferase; AST, aspartate aminotransferase; HCC, hypercholesterolemic diet; HCRV, hypercholesterolemic diet with supplemental resveratrol.
SI conversion factor: To convert glucose to nanomoles per liter, multiply by 0.0555.
Clinical parameters, including weight, blood glucose levels, and liver function data, are shown from the HCC group, HCRV group, and control animals.
Significant.
INTRAVENOUS GLUCOSE CHALLENGE TESTING
At baseline, all groups were within normal ranges of blood glucose level, despite elevation of both the HCC and HCRV groups over the control group (P < .05 for both). Thirty minutes after dextrose infusion, the HCC group had significantly higher blood glucose levels than both the HCRV and control groups (P < .001), with no significant difference between the HCRV and control groups (mean [SEM], 171.0 [5.68] mg/dL in the HCC group, 119.7 [7.74] mg/dL in the control group, and 132.4 [14.11] mg/dL in the HCRV group [to convert glucose to nanomoles per liter, multiply by 0.0555]) (Table).
SKELETAL MUSCLE PROTEIN EXPRESSION
Expression of Glut 4, peroxisome proliferating activation receptor γ coactivator 1α (PGC-1α), and phospho-AKT (T308), proteins involved in glucose metabolism, were all significantly elevated in the HCRV group compared with the HCC and control groups (P < .001, P < .001, and P=.03, respectively). Peroxisome proliferator-activated receptor α and PPAR-γ were more highly expressed in the control group compared with the HCC group (P=.04 and P=.02, respectively). Retinol binding protein 4, a protein implicated in glucose intolerance, was expressed most highly in the HCC group (P=.01) (Figure 1).
Figure 1.

Skeletal muscle protein expression data from resveratrol-treated and untreated swine. A, Western blot analysis of skeletal muscle tissue revealed glucose transporter 4 (Glut 4) expression was decreased in the hypercholesterolemic diet (HCC) group compared with the control and hypercholesterolemic diet with supplemental resveratrol (HCRV) groups (*P < .05) and increased in the HCRV group compared with the HCC and control groups (†P < .001) with an analysis of variance P < .001. B, Peroxisome proliferating activation receptor γ coactivator 1α (PGC-1α) expression was increased in the HCRV group compared with the HCC and control groups (‡P < .001). C, Retinol binding protein 4 (RBP4) expression was increased in the HCC group compared with the control and HCRV groups (§P=.01). D, Peroxisome proliferator-activated receptor α (PPAR-α) expression was decreased in the HCC group compared with the control and HCRV groups (||P=.04). E, Peroxisome proliferator-activated receptor γ (PPAR-γ) expression was decreased in the HCC group compared with the control and HCRV groups (¶P=.02). F, Phosphorylated AKT (threonine 308) (phospho-AKT [T308]) expression was increased in the HCRV group compared with the control and HCC groups (#P=.03).
LIVER PROTEIN EXPRESSION
The ratio of phospho-AKT (T308) to total AKT was significantly higher in the HCRV group compared with the HCC group (P=.008). Mammalian target of rapamycin expression was elevated in the HCC group over the control group and the HCRV group over the HCC group, but neither difference was significant (P > .05 in both cases). Insulin receptor substrate 1 expression in the HCRV group was significantly higher than both the control group and the HCC group (P < .05 for both) (Figure 2).
Figure 2.

Liver protein expression data from resveratrol-treated and untreated swine. A, Western blot analysis of liver tissue revealed normalized phosphorylated AKT (threonine 308) (phospho-AKT [T308]) expression that was increased in the hypercholesterolemic diet with supplemental resveratrol (HCRV) group compared with the control and hypercholesterolemic diet (HCC) groups (*P=.03). B, Insulin receptor substrate 1 (IRS-1) expression was increased in the HCRV group compared with the control and HCC groups (†P=.02). C, Mammalian target of rapamycin (mTOR) expression was increased in the HCRV group compared with the control group (‡P=.03).
LIVER FUNCTION TEST MEASUREMENTS
Markers of liver function (aspartate aminotransferase, alanine aminotransferase, alkaline phosphatase, total protein, and albumin) were similar between the control and HCRV groups. The HCC group had higher levels of aspartate aminotransferase, alanine aminotransferase, alkaline phosphatase, and albumin compared with both the control and HCRV groups (Table).
FASTING SERUM INSULIN
Fasting insulin levels were measured at the culmination of the experiment, prior to euthanasia, and we found that HCC animals had significantly higher insulin levels compared with the control and HCRV groups, which were statistically similar (Table).
IMMUNOHISTOCHEMICAL ANALYSIS OF SKELETAL MUSCLE PROTEINS
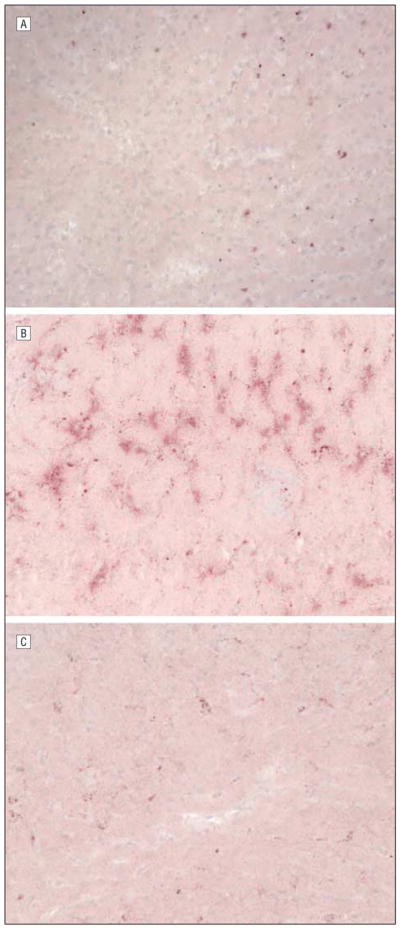
The HCC group demonstrated the least intense staining for membrane-bound Glut 4 of the 3 groups. The control group was similar in that there were small clusters of positively stained cells, but there were more of these clusters in the control group compared with the HCC group. In contrast, almost all HCRV skeletal muscle cells stained positively for membrane-bound Glut 4 (Figure 3).
Figure 3.

Skeletal muscle immunofluorescence staining for glucose transporter 4 (Glut 4) (original magnification ×100). Green staining represents Glut 4 (second column) and blue staining is for all nuclei (third column). A, Composite image of B and C of control animal. D, Composite image of E and F of hypercholesterolemic diet (HCC) animal. G, Composite image of H and I of hypercholesterolemic diet with supplemental resveratrol (HRCV) animal. The HCRV animal shows higher levels of membrane Glut 4 staining than the control and HCC animals.
LIVER TISSUE HISTOLOGIC ANALYSIS
There was no morphological difference between the 3 groups when the liver tissue was stained with hematoxylin-eosin and examined for any evidence of inflammatory cell infiltrate, oxidative stress, steatosis, or cirrhosis (data not shown).
OIL RED O STAINING
The control group demonstrated very limited lipid deposition in the liver. The HCRV group showed increased amounts of lipid, and the HCC group showed the highest level of hepatic lipid deposition (Figure 4).
Figure 4.
Liver tissue stained with oil red O for lipids (original magnification ×200). The oil red O stains lipid red/pink and dark blue represents nuclei. A, Control animal. B, Hypercholesterolemic diet (HCC) animal. C, Hypercholesterolemic diet with supplemental resveratrol (HCRV) animal. The general trend shows that the control and HCRV groups have less lipid deposition than the HCC group.
COMMENT
WEIGHT CONTROL
Weight control is a major component in the treatment of T2DM as well as the other comorbidities associated with metabolic syndrome. A possible mechanism for resveratrol-induced weight control is through the activation of SIRT1. Mimicking the pathway activated by caloric restriction, resveratrol is thought to interact with SIRT1 to activate PGC-1α, which increases the use of cellular energy stores in brown adipose tissue and skeletal muscle.14 Peroxisome proliferating activation receptor α coactivator 1α activation leads to uncoupling of adenosine triphosphate production from the electron transport chain across the membrane of the mitochondria, ultimately burning calories by thermogenesis.18 Mice and rats have large stores of brown adipose tissue as juveniles and adults whereas pigs and humans have almost none as adults and rely on skeletal muscle for thermogenesis. Resveratrol has been found to induce the conversion of nonoxidative fast-twitch skeletal muscle into oxidative endurance muscles that are capable of providing thermogenesis.14,19 Although thermogenesis in mice and rats often raises body temperature, we did not observe this in the pig model, likely because of an increased body mass to surface area ratio, which allows for more efficient dissipation of heat.
BLOOD GLUCOSE CONTROL
In response to the intravenous glucose tolerance testing, only the HCC group developed blood glucose levels higher than the threshold of glucose intolerance (160 mg/dL). This effect of the high-cholesterol diet was prevented by resveratrol supplementation. Serum insulin levels were also significantly reduced in the HCRV group. A hallmark of T2DM is an increase in circulating insulin level as compensation for peripheral insulin resistance. Decreased fasting serum insulin concentration in the HCRV group suggests an absence of insulin resistance.
SKELETAL MUSCLE GLUCOSE METABOLISM
Retinol binding protein 4 is a peptide that is produced in adipose tissue and signals other tissues.20 One of the many links between obesity and insulin resistance, RBP4 inhibits insulin signaling in skeletal muscle by impairing downstream signaling of phosphoinositide 3-kinase. A 2006 study by Graham et al21 showed a linear correlation between a patient’s body mass index and levels of RBP4 and an inverse relationship with insulin sensitivity. Similarly, we found significantly increased levels of RBP4, increased body weight, and impaired glucose tolerance in the HCC group compared with the control group. Resveratrol treatment maintained RBP4 levels in the HCRV group to that of the control group, further supporting the antidiabetic properties of the supplement.
Skeletal muscle clears 80% of circulating glucose from the blood primarily via Glut 4. Regulation of Glut 4 expression is not entirely understood, but skeletal muscle Glut 4 levels are a good indicator of whole-body insulin sensitivity.22 Several proteins have been shown to up-regulate the expression of Glut 4, including insulin23 and PGC-1α.22 Peroxisome proliferating activation receptor γ coactivator 1α, a SIRT1-activated protein, is involved in mitochondrial metabolism and oxidation of energy stores and has been linked to increased insulin sensitivity.22 Our findings that PGC-1α and Glut 4 levels are increased in resveratrol-treated animals are consistent with previous studies that demonstrated upregulation of PGC-1α and Glut 4 expression by resveratrol.14,19 Proper insulin signaling is required for the translocation of Glut 4 from intracellular vesicles to the cell membrane, where it becomes active.24,25 This is accomplished mainly through phosphorylation of AKT at T308,26 which we found to be significantly increased in the HCRV group compared with the control and HCC groups. Predictably, we also saw a striking increase in the amount of membrane-bound Glut 4 in the HCRV group compared with both the control and HCC groups, suggesting improved translocation of Glut 4 to the cell membrane in these animals and increased ability to absorb circulating glucose.
We also investigated PPAR-α and PPAR-γ, nuclear receptors that regulate the gene expression of important metabolic proteins such as IRS-2. Peroxisome proliferator-activated receptor γ has been shown to reduce levels of free fatty acids and act as an anti-inflammatory protein.27 Peroxisome proliferator-activated receptor γ has been shown to upregulate IRS-2 expression, which down-regulates insulin-desensitizing signaling molecules such as tumor necrosis factor α, ultimately enhancing insulin-mediated glucose uptake in skeletal muscle.27 We found decreased levels of PPAR-α and PPAR-γ in the HCC group, which is consistent with the fact that insulin resistance reduces the expression of these molecules.28 Per-oxisome proliferator-activated receptor α and PPAR-γ expression were increased in the HCRV group compared with the HCC group, though this difference was not significant. This suggests a possible mechanism by which resveratrol may protect insulin sensitivity and signaling efficiency. A summary of the proposed mechanism of action of resveratrol in skeletal muscle is shown in Figure 5.
Figure 5.

Simplified signaling pathway of the effects of resveratrol involved in metabolic control in the skeletal muscle. Resveratrol activates SIRT1. This increases the expression of insulin receptor substrate 1 (IRS-1) and in the presence of insulin increases the activity of phosphoinositide 3-kinase (PI3K). Phosphoinositide 3-kinase increases the activity of AKT by phosphorylating it at threonine 308. Phosphorylated AKT (pAKT) activity stimulates translocation of glucose transporter type 4 (Glut 4) to the membrane of the skeletal muscle cells, increasing glucose uptake. Phosphoinositide 3-kinase is inhibited by retinol binding protein 4 (RBP4), which is released by adipose tissue. Retinol binding protein 4 expression is increased by obesity but is inhibited by resveratrol. Resveratrol, through SIRT1, also increases levels of peroxisome proliferating activation receptor γ coactivator 1α (PGC-1α), peroxisome proliferator-activated receptor γ (PPAR-γ), and peroxisome proliferator-activated receptor α (PPAR-α). Peroxisome proliferating activation receptor γ coactivator 1α upregulates the expression of Glut 4 and activates PPAR-γ in skeletal muscle, increasing whole-body insulin sensitivity. Peroxisome proliferating activation receptor γ coactivator 1α also increases mitochondrial activity and energy-store oxidation. Peroxisome proliferator-activated receptor γ increases the expression of proteins important to metabolic homeostasis, such as IRS-2, which also increase insulin sensitivity. Peroxisome proliferator-activated receptor α has been shown to reduce the level of free fatty acids (FFAs) and lipid deposition in peripheral tissue that contributes to insulin resistance; thus, PPAR-α increases insulin sensitivity.
HEPATOCELLULAR EFFECTS OF RESVERATROL
Free fatty acids, which are increased by a high-fat diet, are known to be directly toxic to hepatocytes, causing mitochondrial dysfunction and membrane damage.29 As expected, we observed an elevation in liver transaminase levels in the HCC group, which was attenuated by resveratrol treatment in the HCRV group. It has been suggested that resveratrol reduces lipid peroxidation, protecting the liver against oxidative damage.30
Insulin resistance leads to hepatocellular fat deposition and liver damage, including nonalcoholic steatohepatitis and cirrhosis.29 However, in our study, there were no differences in hepatic histology between the groups on hematoxylin-eosin staining. A possible explanation is that the course of the study was too short for hepatocellular damage to achieve visible levels. A 2006 study in mice conducted over 110 weeks described significant fatty liver pathology, which was completely abrogated by resveratrol treatment.19 On the other hand, there were differences in lipid deposition between groups on oil red O staining. Resveratrol treatment appeared to reduce hepatic lipid accumulation to normocholesterolemic control levels, likely contributing further to the protective effects of resveratrol.
HEPATIC PROTEIN EXPRESSION
Resveratrol influenced a number of pathways regulating glucose metabolism in the liver. Insulin receptor substrate 1 is a key regulator of insulin signaling. When stimulated by insulin in the liver, it promotes glycogen synthesis and inhibits glucose release (Figure 6). Insulin receptor substrate 1 also stimulates phosphoinositide 3-kinase, which then phosphorylates AKT at T308. Phosphorylation of AKT by the mTOR-rictor complex at a second activation site, S473, has also been reported.31 AKT phosphorylation has many downstream effects. The 2 most pertinent to glucose metabolism in the liver are phosphorylation of forkhead box O1, a nuclear transcription factor, and glycogen synthase kinase 3. Following phosphorylation, forkhead box O1 moves out of the nucleus and suppresses the expression of certain proteins that promote gluconeogenesis.32 Phosphorylation of glycogen synthase kinase 3 removes its constitutive inactivation of glycogen synthase. Thus, through inhibition of glycogen synthase kinase 3, phospho-AKT enhances synthesis of glycogen and reduces hyperglycemia.33 Through these 2 pathways, IRS-1, mTOR, and phospho-AKT enhance insulin sensitivity and reduce the circulating blood glucose level. We found that all 3 of these targets were more highly expressed in the HRCV group than the HCC group, suggesting a mechanism by which resveratrol prevents insulin resistance in the liver.
Figure 6.

The effects of resveratrol on a simplified signaling pathway involved in metabolic control in the liver. Resveratrol increases expression of insulin receptor substrate 1 (IRS-1). Insulin receptor substrate 1, when stimulated by insulin, activates phosphoinositide 3-kinase (PI3K), which then activates AKT by phosphorylation at threonine 308 (phosphorylated AKT [pAKT]). Resveratrol also increases the expression of mammalian target of rapamycin (mTOR), which activates AKT by phosphorylation at serine 473. Activation of AKT enhances glycogen synthase activity by inhibiting its inhibitor, glycogen synthase kinase 3 (GSK3). Increased glycogen synthase activity increases glycogen production, facilitating increased movement of glucose into the liver from the circulation and reducing blood glucose levels. AKT activation also signals for forkhead box O1 (FOXO1) to be transported out of the nucleus. This prevents transcription of proteins needed for gluconeogenesis and thus reduces the level of gluconeogenesis, which diminishes the amount of glucose released from the liver, also reducing the blood glucose level.
LIMITATIONS OF THE STUDY
This study was performed in a porcine model, which, while it more closely approximates human metabolic response than do smaller-animal models, still represents a different species. Additionally, the relatively short time frame of the study may have limited the long-term effects of the high-cholesterol diet. Furthermore, we investigated only 1 dose of resveratrol, which has been shown to have varying effects at different doses.34
CONCLUSIONS
In a porcine model of metabolic syndrome, we found that resveratrol counteracts the obesity, weight gain, and insulin resistance induced by a high-calorie, high-fat diet. Resveratrol accomplishes this by influencing several insulin-dependent metabolic pathways in skeletal muscle and the liver. We believe that resveratrol is a supplement that has the potential to be a novel pharmacological agent for the prevention of diet-induced insulin resistance, T2DM, and metabolic syndrome.
Acknowledgments
Funding/Support: Funding for this project was provided by National Heart, Lung, and Blood Institute grants RO1HL46716, RO1HL69024, and RO1HL85647 (Dr Sellke), National Institutes of Health grants T32HL094300 (Dr Chu), T32HL076130 (Dr Robich), and T32HL007734 (Dr Chu), and the Irving Bard Memorial Fellowship (Drs Robich and Chu).
Footnotes
Financial Disclosure: Dr Sellke is a steering committee member for Cubist Pharmaceuticals and Novo Nordisk and an advisory board member for CSL Behring.
Previous Presentation: This paper was presented as a poster (P12) at the 91st Annual Meeting of the New England Surgical Society; October 30, 2010; Saratoga Springs, New York; and is published after peer review and revision.
Author Contributions: Mr Burgess and Dr Robich had full access to all of the data in the study and take responsibility for the integrity of the data and the accuracy of the data analysis. Study concept and design: Robich and Sellke. Acquisition of data: Burgess and Chu. Analysis and interpretation of data: Burgess, Robich, Bianchi, and Sellke. Drafting of the manuscript: Burgess and Sellke. Critical revision of the manuscript for important intellectual content: Burgess, Robich, Chu, Bianchi, and Sellke. Statistical analysis: Burgess, Robich, and Chu. Obtained funding: Sellke. Administrative, technical, and material support: Chu, Bianchi, and Sellke. Study supervision: Robich, Chu, Bianchi, and Sellke.
References
- 1.Flegal KM, Carroll MD, Ogden CL, Curtin LR. Prevalence and trends in obesity among US adults, 1999–2008. JAMA. 2010;303(3):235–241. doi: 10.1001/jama.2009.2014. [DOI] [PubMed] [Google Scholar]
- 2.Haslam DW, James WP. Obesity. Lancet. 2005;366(9492):1197–1209. doi: 10.1016/S0140-6736(05)67483-1. [DOI] [PubMed] [Google Scholar]
- 3.Malik S, Wong ND, Franklin SS, et al. Impact of the metabolic syndrome on mortality from coronary heart disease, cardiovascular disease, and all causes in United States adults. Circulation. 2004;110(10):1245–1250. doi: 10.1161/01.CIR.0000140677.20606.0E. [DOI] [PubMed] [Google Scholar]
- 4.Turcotte LP, Fisher JS. Skeletal muscle insulin resistance: roles of fatty acid metabolism and exercise. Phys Ther. 2008;88(11):1279–1296. doi: 10.2522/ptj.20080018. [DOI] [PMC free article] [PubMed] [Google Scholar]
- 5.Petersen KF, Shulman GI. Etiology of insulin resistance. Am J Med. 2006;119(5 suppl 1):S10–S16. doi: 10.1016/j.amjmed.2006.01.009. [DOI] [PMC free article] [PubMed] [Google Scholar]
- 6.Lovejoy JC. The influence of dietary fat on insulin resistance. Curr Diab Rep. 2002;2(5):435–440. doi: 10.1007/s11892-002-0098-y. [DOI] [PubMed] [Google Scholar]
- 7.Schattenberg JM, Schuchmann M. Diabetes and apoptosis: liver. Apoptosis. 2009;14(12):1459–1471. doi: 10.1007/s10495-009-0366-2. [DOI] [PubMed] [Google Scholar]
- 8.Harris EH. Elevated liver function tests in type 2 diabetes. Clin Diabetes. 2005;23(3):115–119. doi: 10.2337/diaclin.23.3.115. [DOI] [Google Scholar]
- 9.Sigal RJ, Kenny GP, Boulé NG, et al. Effects of aerobic training, resistance training, or both on glycemic control in type 2 diabetes: a randomized trial. Ann Intern Med. 2007;147(6):357–369. doi: 10.7326/0003-4819-147-6-200709180-00005. [DOI] [PubMed] [Google Scholar]
- 10.O’Brien PE, Dixon JB, Laurie C, et al. Treatment of mild to moderate obesity with laparoscopic adjustable gastric banding or an intensive medical program: a randomized trial. Ann Intern Med. 2006;144(9):625–633. doi: 10.7326/0003-4819-144-9-200605020-00005. [DOI] [PubMed] [Google Scholar]
- 11.Dixon JB, O’Brien PE, Playfair J, et al. Adjustable gastric banding and conventional therapy for type 2 diabetes: a randomized controlled trial. JAMA. 2008;299(3):316–323. doi: 10.1001/jama.299.3.316. [DOI] [PubMed] [Google Scholar]
- 12.Breen DM, Sanli T, Giacca A, Tsiani E. Stimulation of muscle cell glucose uptake by resveratrol through sirtuins and AMPK. Biochem Biophys Res Commun. 2008;374(1):117–122. doi: 10.1016/j.bbrc.2008.06.104. [DOI] [PubMed] [Google Scholar]
- 13.Roccaro AM, Leleu X, Sacco A, et al. Resveratrol exerts antiproliferative activity and induces apoptosis in Waldenström’s macroglobulinemia. Clin Cancer Res. 2008;14(6):1849–1858. doi: 10.1158/1078-0432.CCR-07-1750. [DOI] [PubMed] [Google Scholar]
- 14.Lagouge M, Argmann C, Gerhart-Hines Z, et al. Resveratrol improves mitochondrial function and protects against metabolic disease by activating SIRT1 and PGC-1alpha. Cell. 2006;127(6):1109–1122. doi: 10.1016/j.cell.2006.11.013. [DOI] [PubMed] [Google Scholar]
- 15.González-Rodríguez A, Mas Gutierrez JA, Sanz-González S, Ros M, Burks DJ, Valverde AM. Inhibition of PTP1B restores IRS1-mediated hepatic insulin signaling in IRS2-deficient mice. Diabetes. 2010;59(3):588–599. doi: 10.2337/db09-0796. [DOI] [PMC free article] [PubMed] [Google Scholar]
- 16.Chaudhary N, Pfluger PT. Metabolic benefits from Sirt1 and Sirt1 activators. Curr Opin Clin Nutr Metab Care. 2009;12(4):431–437. doi: 10.1097/MCO.0b013e32832cdaae. [DOI] [PubMed] [Google Scholar]
- 17.Institute of Laboratory Animal Resources; Commission on Life Sciences; National Research Council. Guide for the Care and Use of Laboratory Animals. Washington, DC: National Academy Press; 1996. Publication 5377–3. [Google Scholar]
- 18.Mattson MP. Perspective: does brown fat protect against diseases of aging? Ageing Res Rev. 2010;9(1):69–76. doi: 10.1016/j.arr.2009.11.004. [DOI] [PMC free article] [PubMed] [Google Scholar]
- 19.Baur JA, Pearson KJ, Price NL, et al. Resveratrol improves health and survival of mice on a high-calorie diet. Nature. 2006;444(7117):337–342. doi: 10.1038/nature05354. [DOI] [PMC free article] [PubMed] [Google Scholar]
- 20.Muoio DM, Newgard CB. Metabolism: A is for adipokine. Nature. 2005;436(7049):337–338. doi: 10.1038/436337a. [DOI] [PubMed] [Google Scholar]
- 21.Graham TE, Yang Q, Blüher M, et al. Retinol-binding protein 4 and insulin resistance in lean, obese, and diabetic subjects. N Engl J Med. 2006;354(24):2552–2563. doi: 10.1056/NEJMoa054862. [DOI] [PubMed] [Google Scholar]
- 22.Higashida K, Higuchi M, Terada S. Dissociation between PGC-1alpha and GLUT-4 expression in skeletal muscle of rats fed a high-fat diet. J Nutr Sci Vitaminol (Tokyo) 2009;55(6):486–491. doi: 10.3177/jnsv.55.486. [DOI] [PubMed] [Google Scholar]
- 23.O’Brien RM, Granner DK. Regulation of gene expression by insulin. Biochem J. 1991;278(pt 3):609–619. doi: 10.1042/bj2780609. [DOI] [PMC free article] [PubMed] [Google Scholar]
- 24.Ueda S, Kitazawa S, Ishida K, et al. Crucial role of the small GTPase Rac1 in insulin-stimulated translocation of glucose transporter 4 to the mouse skeletal muscle sarcolemma. FASEB J. 2010;24(7):2254–2261. doi: 10.1096/fj.09-137380. [DOI] [PMC free article] [PubMed] [Google Scholar]
- 25.Cheng ZJ, Singh RD, Wang TK, et al. Stimulation of GLUT4 (glucose transporter isoform 4) storage vesicle formation by sphingolipid depletion. Biochem J. 2010;427(1):143–150. doi: 10.1042/BJ20091529. [DOI] [PMC free article] [PubMed] [Google Scholar]
- 26.Shepherd PR, Kahn BB. Glucose transporters and insulin action: implications for insulin resistance and diabetes mellitus. N Engl J Med. 1999;341(4):248–257. doi: 10.1056/NEJM199907223410406. [DOI] [PubMed] [Google Scholar]
- 27.Berger J, Moller DE. The mechanisms of action of PPARs. Annu Rev Med. 2002;53:409–435. doi: 10.1146/annurev.med.53.082901.104018. [DOI] [PubMed] [Google Scholar]
- 28.Cheatham WW. Peroxisome proliferator-activated receptor translational research and clinical experience. Am J Clin Nutr. 2010;91(1):262S–266S. doi: 10.3945/ajcn.2009.28449D. [DOI] [PubMed] [Google Scholar]
- 29.Neuschwander-Tetri BA, Caldwell SH. Nonalcoholic steatohepatitis: summary of an AASLD Single Topic Conference. Hepatology. 2003;37(5):1202–1219. doi: 10.1053/jhep.2003.50193. [DOI] [PubMed] [Google Scholar]
- 30.Roghani M, Baluchnejadmojarad T. Mechanisms underlying vascular effect of chronic resveratrol in streptozotocin-diabetic rats. Phytother Res. 2010;24 (suppl 2):S148–S154. doi: 10.1002/ptr.3032. [DOI] [PubMed] [Google Scholar]
- 31.Sarbassov DD, Guertin DA, Ali SM, Sabatini DM. Phosphorylation and regulation of Akt/PKB by the rictor-mTOR complex. Science. 2005;307(5712):1098–1101. doi: 10.1126/science.1106148. [DOI] [PubMed] [Google Scholar]
- 32.Dong X, Park S, Lin X, Copps K, Yi X, White MF. Irs1 and Irs2 signaling is essential for hepatic glucose homeostasis and systemic growth. J Clin Invest. 2006;116(1):101–114. doi: 10.1172/JCI25735. [DOI] [PMC free article] [PubMed] [Google Scholar]
- 33.Lipina C, Huang X, Finlay D, McManus EJ, Alessi DR, Sutherland C. Analysis of hepatic gene transcription in mice expressing insulin-insensitive GSK3. Biochem J. 2005;392(pt 3):633–639. doi: 10.1042/BJ20051046. [DOI] [PMC free article] [PubMed] [Google Scholar]
- 34.Gurusamy N, Lekli I, Mukherjee S, et al. Cardioprotection by resveratrol: a novel mechanism via autophagy involving the mTORC2 pathway. Cardiovasc Res. 2010;86(1):103–112. doi: 10.1093/cvr/cvp384. [DOI] [PMC free article] [PubMed] [Google Scholar]