

Abstract
Macroautophagy (hereafter referred to as autophagy) is an evolutionarily conserved intracellular bulk degradation pathway that plays critical roles in eliminating intracellular pathogens, presenting endogenous antigens, and regulating T lymphocyte survival and proliferation. In this study, we have investigated the role of autophagy in regulating the ER compartment in T lymphocytes. We found that ER content is expanded in mature Atg7-deficient T lymphocytes. Atg7-deficient T cells stimulated through the T cell receptor display impaired influx, but not efflux, of calcium, and ER calcium stores are increased in Atg7-deficient T cells. Treatment with the ER sarco/endoplasmic reticulum Ca2+-ATPase (SERCA) pump inhibitor thapsigargin rescues the calcium influx defect in Atg7-deficient T lymphocytes, suggesting that this impairment is caused by an intrinsic defect in ER. Furthermore, we found that the stimulation-induced redistribution of STIM-1, a critical event for the store-operated Ca2+-release activated Ca2+ (CRAC) channel opening, is impaired in Atg7-deficient T cells. Together, these findings indicate that the expanded ER compartment in Atg7-deficient T cells contains increased calcium stores, and the inability of these stores to be depleted causes defective calcium influx in these cells. Our results demonstrate that autophagy plays an important role in maintaining ER and calcium homeostasis in T lymphocytes.
Keywords: Autophagy, Atg7, ER homeostasis, calcium influx, T lymphocytes
Introduction
Autophagy is an evolutionarily conserved intracellular pathway for degradation of long-lived proteins, recycling of cytoplasmic components, and removal of damaged organelles (1-5). There are three types of autophagy–microautophagy, chaperone-mediated autophagy, and macroautophagy (6). The process of macroautophagy (hereafter referred to as autophagy) is initiated with the formation of a structure called the isolation membrane. This membrane is elongated to engulf cytosolic materials, forming a characteristic double-membrane structure termed the autophagosome. Autophagosomes next fuse with lysosomes to become autolysosomes, after which the engulfed materials are degraded. The molecular pathways regulating autophagy are highly conserved from yeast to higher eukaryotic cells (1). Beclin-1 (Autophagy related protein 6, Atg6) (7) forms a complex with the class III phosphoinositide 3-kinase (PI-3K) molecule Vps34 (8) to initiate and promote autophagy. Autophagy related (Atg) proteins direct autophagosome formation through two ubiquitin-like pathways (1, 3, 5). The first of these pathways is the Atg12 conjugation pathway. During autophagosome formation, Atg12 is activated by the ubiquitin-E1-like molecule Atg7. Activated Atg12 is then transferred to the E2-like molecule Atg10 and conjugated to Atg5, after which the Atg5-Atg12 conjugate forms a large complex with Atg16. The second pathway is mediated through the LC3 (Atg8) conjugation system. LC3 is processed by the protease Atg4 to become LC3-I. LC3-I is activated by Atg7 and transferred to the E2-like molecule Atg3. Finally, LC-3 is conjugated to phosphatidylethanolamine (PE) to become LC-3-II. PE is removed from LC-3-II by Atg4, allowing recycling of LC-3 during autophagosome formation (3).
Recent works have demonstrated that autophagy serves diverse physiological and pathological functions (3, 9, 10). Autophagy plays a role in elimination of intracellular pathogen infections(3), recognition of ssRNA and IFN-α production in plasmacytoid dendritic cells(11), and presentation of exogenous or endogenous antigen on MHC-II molecules(12, 13). In addition, autophagy regulates intracellular organelle homeostasis by sequestering membrane compartments and organelles in eukaryotic cells. For example, autophagy regulates peroxisome turnover in yeast through a process termed pexophagy (14). Selective removal of mitochondria by autophagy, also termed mitophagy, may be a mechanism that allows cells to cope with oxidative stress (15). Similarly, the unfolded protein response (UPR) triggers autophagy to remove damaged or redundant endoplasmic reticulum (ER) (16-18); however, the exact roles of autophagy in regulating ER homeostasis in T lymphocytes have not yet been defined.
In T lymphocytes, ER is involved in the calcium signaling pathway, and ER calcium store depletion initiates calcium influx. Upon TCR engagement, ZAP-70 and LAT are sequentially recruited to the TCR/CD3 complex. Phospholipase Cγ (PLCγ) is phosphorylated and cleaves PIP2 to produce diacylglycerol (DAG) and inositol 1,4,5-trisphosphate (IP3). IP3 then binds to its receptor (IP3R), which is expressed on ER. Ligand-bound IP3R opens ER Ca2+ channels, resulting in release of stored Ca2+ into the cytosol. After ER Ca2+ store depletion, stromal interaction molecule-1 (STIM-1), a Ca2+ sensor expressed on the ER (19-21), is redistributed and accumulates near ER-plasma membrane junctions. Redistributed STIM-1 binds to plasma membrane Orai1, which is a pore subunit of the store-operated Ca2+-release activated Ca2+ channel (CRAC) (22, 23). This results in opening of the CRAC channel and Ca2+ flux across the plasma membrane from the extracellular environment to the intracellular space (24).
Our previous studies have demonstrated that autophagosome forms in mouse primary T lymphocytes and TCR stimulation promotes autophagy processing (25). The total cell numbers of thymocytes, peripheral CD4+ and CD8+ are decreased in Atg5-deficient fetal liver chimeric mice and Atg7f/fLck-Cre mice (25, 26). The cell death is significantly increased in Atg5- or Atg7-deficient naïve T cells (25, 26). Atg5-deficient T cells cannot efficiently proliferate upon TCR stimulation (25). Our results suggest that autophagy regulates T cell homeostasis by promoting T lymphocytes survival and proliferation (25, 27). We and others have recently found that mitochondrial content is developmentally regulated in T cells but not in B cells and autophagy decreases the high mitochondrial content in thymocytes to low mitochondrial content in mature T cells (26, 28, 29). Autophagy-deficient mature T cells fail to reduce their mitochondrial content in vivo, suggesting that autophagy is essential for mitochondrial clearance in mature T lymphocytes. Given that autophagy is implicated in regulating ER homeostasis under stress conditions in yeast, we wondered whether autophagy also regulates ER homeostasis in T lymphocytes. Here we show that autophagy-deficient mature T lymphocytes have increased ER content. Furthermore, stimulation-induced calcium influx and efflux are deregulated in autophagy-deficient T cells. Our results suggest that autophagy regulates calcium mobilization in T lymphocytes through controlling ER homeostasis.
Materials and Methods
Mice
Atg7 flox/flox (Atg7f/f) mice were described previously (30). Lck-Cre mice were obtained from The Jackson Laboratory (31). Atg7f/f mice were crossed with Lck-Cre mice to specifically delete Atg7 in T lymphocytes and characterized as reported (26). All mice were housed in a specific pathogen-free facility at Duke University and used at 4-8 weeks of age. All animals were used according to protocols approved by the Duke University Institutional Animal Care and Use Committee.
ER homeostasis analysis
Splenocytes from Atg7f/f and Atg7f/fLck-Cre mice were incubated with ER-Tracker Blue-White DPX (referred to as ER-Tracker; Invitrogen, Carlsbad, CA) at a final concentration of 1 μM in RPMI 1640 medium at 37°C for 30 min. Cells were washed once and stained with anti-CD44-FITC and either anti-CD4-PE or anti-CD8-PE antibodies in 2.4G2 supernatant (FcR blocker) for 15 min. Thymocytes were stained with anti-CD4-FITC and anti-CD8-PE antibodies. Cells were washed and analyzed by flow cytometry. Expression of calnexin in purified total T cells was analyzed by Western blot with an antibody against calnexin (Stressgen, Ann Arbor, Michigan). For ER-Tracker images, ER-Tracker-stained cells were washed and stained on ice with anti-CD4-biotin followed by streptavidin-Alexa 594 (Invitrogen). Images were obtained with Zeiss ApoTome system (Carl Zeiss, Thornwood, NY) using AxioVision software (Carl Zeiss) with a 63x oil objective. All antibodies for flow cytometry were from e-Bioscience or Biolegend (San Diego, CA).
Sample preparation for electron microscopy and cytosol membrane structure quantification
Mature lymph node (LN) T cells were enriched using an EasySep negative mouse T cells selection kit (StemCell Technologies, Vancouver, BC, Canada), stained with anti-TCR-FITC and anti-CD4-PE (or with anti-CD8-PE), and fixed in 1% PFA for cell sorting. One to two million TCRß+ CD4+ or TCRß+ CD8+ T cells were sorted and fixed in a 4% gluteraldehyde/0.1 M sodium cacodylate buffer overnight. The samples were rinsed three times for 15 min in 0.1 M cacodylate buffer containing 7.5% sucrose and fixed in 1% osmium in cacodylate buffer for 1 hr. Samples were washed three times for 15 min in 0.11 M veronal acetate buffer and incubated with 0.5% uranyl acetate in veronal acetate buffer for 1 hr at room temperature (RT). Specimens were then dehydrated in increasing concentrations of ethanol (one 10 min incubation each in 35%, 70%, and 95% ethanol, followed by two 10 min incubations in 100% ethanol) and incubated twice in propylene oxide (5 min per incubation). Samples were next incubated in a 1:1 mixture of 100% resin and propylene oxide for 1 hr and incubated twice in 100% resin (30 min per incubation). Finally, samples were embedded in resin and polymerized at 60°C overnight. Thick sections (0.5 μm) were cut and stained with toluidine blue and visualized using light microscopy to select appropriate areas to use for ultrathin sections. Thin sections (60-90 nm) were then cut, mounted on copper grids, and post-stained with uranyl acetate and lead citrate. Micrographs were taken with a Philips LS 410 electron microscope. Images were analyzed using AxioVision software (Carl Zeiss). Each cell in EM images was divided into 12 equal sections based on the face of a clock. Membrane scores were defined and counted as the number of sections per cell containing membrane structure(s).
Analysis of T lymphocyte calcium response
Lymph nodes cells from Atg7f/f or Atg7f/fLck-Cre mice were incubated with 5 μM Indo-1 (Invitrogen) for 30 min in HBSS buffer (Invitrogen). Cells were stained with 7-AAD, anti-CD44-FITC and either anti-CD4-PE or anti-CD8-PE antibodies for 15 min on ice. Cells were then washed and resuspended in HBSS buffer containing 1.26 mM CaCl2. To analyze calcium influx, 1×10⁶ cells were incubated with biotin-labeled anti-CD3 (5 μg/ml) and either biotin-labeled anti-CD4 (1 μg/ml) or biotin-labeled anti-CD8 antibodies(1 μg/ml, all above antibodies are from e-Bioscience) for 1 min. Baseline levels of fluorescence were detected by flow cytometry, and 25 μg/ml streptavidin (Sigma, St. Louis, MO) was then added to cross-link CD3 and either CD4 or CD8 antibodies. After cross-linking, the cytosolic calcium concentration ([Ca2+]i) was measured by flow cytometry (FACStar, BD Biosciences, San Jose, CA) for 5 to 7 min. To measure ER Ca2+ stores, LN cells were loaded with Indo-1 and resuspended in Ca2+-free HBSS containing 1 mM EGTA. Cells were stimulated with anti-CD3 antibody, thapsigargin or ionomycin (Sigma) in Ca2+-free HBSS buffer. Relative [Ca2+]i was determined by the ratio of emission at 405 nm to that at 510 nm. Emissions were detected by flow cytometry and plotted using FlowJo software (Tree Star, Ashland, OR). All analyzed cells were gated on 7-AAD negative cells to exclude the dead cells.
Live cell calcium imaging
Atg7f/f or Atg7f/fLck-Cre CD4+ T cells (5×10⁶) were incubated with 5 μM Fura-2 (Invitrogen) and rotated in RPMI 1640 medium containing 10% FCS at RT for 20 min. Fura-2-loaded cells were washed with minimum image buffer (MIB; HBSS containing 2% FCS, 2 mM Ca2+, and 2 mM Mg2+) and resuspended in 1 ml MIB buffer. Time-lapse images of the intracellular calcium response in cells stimulated with 13 nM ionomycin were obtained using a Zeiss Axio Observer D1-based imaging station equipped with a CoolSNAP HQ CCD camera (Roper Scientific, Tucson, AZ) and recorded with MetaMorph 7.6 software (Universal Imaging, West Chester, PA). The filters used in this experiment were 340/26 nm and 387/11 nm for excitation and 510/84 nm for emission. Images were recorded every 10 seconds for 1 min before and 10 min after stimulation.
Every cell was tracked and analyzed manually frame by frame using MetaMorph 7.6 software. To determine the total intracellular calcium concentration, we calculated the integrated calcium flux within the first 5 min of stimulation. For each cell, the ratio of fluorescence intensity upon excitation at 340 nm to that upon excitation at 380 nm was calculated every 10 s over a period of 5 min, and the average fluorescence intensity ratio from 3-4 frames of the live image obtained before stimulation was used as the baseline (background) calcium concentration. The integrated Ca2+ flux within the first 5 min of stimulation was calculated using the following formula: Integrated Ca2+ (Σ: summation, R: ratio of fluorescence intensity upon excitation at 340 nm to that upon excitation at 380 nm, n: image frame number, R0: background fluorescence intensity ratio, Rn: fluorescence intensity ratio in frame n).
Western blot
CD44low naïve T cells were enriched using an EasySep Mouse T Cell Enrichment negative selection kit (Stem Cell Technologies) according to its manual. Biotin-anti-CD44 antibody was additionally added to exclude the CD44high cells. The purity of isolated T cells was >90% CD3+ CD44low. Equal numbers of T cells were incubated with biotin-labeled anti-CD3 (5 μg/ml), biotin-labeled anti-CD4 (1 μg/ml) and biotin-labeled anti-CD8 antibodies (1 μg/ml) for 1 min and cross-linked with streptavidin (25 μg/ml) for 1, 1.5, 3, 5, or 10 min, respectively. Reactions were stopped on ice and cells were lysed with cell lysis buffer (25 mM Tris-HCl pH 7.4, 150 mM NaCl, 5 mM EDTA, 1 mM PMSF, 1 mM sodium vanadate, 2 mM sodium pyrophosphate, 10 mM β-glycerol phosphate, 10 μg/ml leupeptin, 10 μg/ml aprotinin, and 1% Triton X-100). Cell lysates were separated by SDS-PAGE and transferred to PVDF membrane. Membranes were probed with primary antibody in PBS containing 3% BSA and 0.5% Tween 20 at 4°C overnight. Membranes were then incubated with Alexa Fluor 680- (Invitrogen) or IRDye 800- (Rockland Immunochemicals, Gilbertsville, PA) labeled secondary antibodies at RT for 1 hr. After washing, blots were visualized using an Odyssey Infrared Imaging System and analyzed using Odyssey software (LI-COR Bioscience, Lincoln, NE). Numbers below blots represent the ratio of intensity of each target molecule to intensity of loading control. SERCA2 antibody is from Abcam (Cambridge, UK). Anti-pERK, anti-pp38, and anti-pPLCγ1 antibodies are from Cell Signaling Technology (Santa Cruz, CA). Anti-Grp78, anti-Grp94, and anti-PDI antibodies are from Assay Designs (Ann Arbor, Michigan). Anti-Orai1 antibody is from Abcam (Cambridge, MA). Anti-actin antibody is from Santa Cruz Biotechnology (Santa Cruz, CA).
Retrovirus propagation and primary T cell transduction
Bosc cells were cotransfected with a target retroviral construct (pIB2-ER-probe-YFP) and the packaging vector pCL-Eco at a 4:1 ratio using LF2000 (Invitrogen) following the manufacturer’s instructions. Supernatants were harvested 48 hrs after transfection. Wild type and Atg7f/fLck-Cre splenocytes were stimulated with anti-CD3 (2C11; 5 μg/ml) and anti-CD28 (2 μg/ml, Biolegend, San Diego, CA). 100 U/ml IL-2 was added one day after stimulation. Six hrs after IL-2 treatment, stimulated splenocytes were transduced with retroviral supernatants by spin infection at 2500 rpm for 1.5 hrs with 1 μg/ml polybrene (Sigma). Live cell imaging was performed using a Zeiss Axio Observer D1-based imaging station equipped with a CoolSNAP HQ CCD camera (Roper Scientific) 48 hrs after retroviral transduction. Images were recorded and analyzed with MetaMorph 7.6 software (Universal Imaging).
Analysis of STIM-1 distribution
Glass coverslips were treated with biotin-Poly-lysine at RT for 1 hr, washed, and incubated with 10 μg/ml streptavidin for 1 hr. Coverslips were washed again and incubated with biotin-labeled anti-CD3 (2C11, 5 μg/ml) at RT for 30 min in HBSS containing 1.26 mM CaCl2 (Invitrogen). For unstimulated T cells, the coverslips were coated with anti H-2kb antibody. Purified T cells were stained with anti-CD4-Pacific Blue or anti CD8-Pacific Blue antibody, washed, and added to treated coverslips in 12-well plates. Cells were incubated on antibody coated coverslips for 20 min and then fixed with 2% paraformaldehyde for 10 min at RT. For thapsigargin stimulation, LN cells were stimulated with 100 nM thapsigargin in HBSS containing 1.26 mM CaCl2 for 20 min at 37 °C and then stopped and fixed with 2% paraformaldehyde. Fixed cells were washed and treated with PBS containing 0.5% saponin and 0.5% BSA for 10 min at RT. Cells were then incubated with anti-STIM-1 antibody (2 μg/ml, Sigma) for 30 min at RT, washed, and incubated with a Cy3-labeled anti-rabbit antibody (Jackson ImmunoResearch Laboratories, Inc., West Grove, PA) for another 30 min at RT and protected from light. STIM-1 punctae were detected using 100x oil objective in a Zeiss Axio Observer D1-based imaging station equipped with a CoolSNAP HQ CCD camera and recorded and analyzed with MetaMorph 7.6 software. Z-stacks were spaced at 1 μm apart. 3D deconvolution was processed using AutoQuant X software (Media Cybernetics, Inc. Bethesda, MD). The area and fluorescence intensity of STIM-1 punctae were quantitated by using MetaMorph 7.6 software.
IL-2 measurement
CD4+CD44low T cells from Atg7f/f or Atg7f/fLck-Cre mice were enriched by EasySep Mouse CD4 T Cell Enrichment negative selection kit and stimulated with coated anti-CD3(5μg/ml) or anti-CD3 plus anti CD28 (2μg/ml) antibodies over night. IL-2 in the cell culture supernatants was measured by ELISA. The anti-IL-2 capture and detection antibodies were from Biolegend.
Statistical analysis
The unpaired and two-tailed student t-test was used to analyze all data except the figure 1G, figure 4A and figure 6G which was paired and two-tailed student t-test.
FIGURE 1. Expanded ER in autophagy-deficient mature T lymphocytes.

(A, B). ER content in developing T lymphocytes from Atg7f/fLck-Cre and Atg7f/f mice. Thymocytes and splenocytes from three pairs of mice were loaded with ER-Tracker Blue-White DPX (ER-Tracker). Cells were washed, thymocytes were stained with anti-CD4-FITC and anti-CD8-PE antibodies, and splenocytes were stained with anti-CD44-FITC and either anti-CD4-PE or anti-CD8-PE antibodies. All samples were gated on 7-AAD negative live cells. To determine ER content, the mean fluorescence intensity (MFI) of ER-Tracker was divided by the mean forward scatter intensity for each population. ER content for each population was then normalized to ER content in wildtype DP thymocytes. Gates were defined as follows: DN thymocytes, CD4- CD8-; DP thymocytes, CD4+ CD8+; CD4 SP thymocytes, CD4+ CD8-; and CD8 SP thymocytes, CD4- CD8+. The mean and standard deviation (SD) are showed in the figure, *p=0.006 for CD4+ CD44low, **p=0.04 for CD8+ CD44low). (C). Representative FACS profiles showing ER-Tracker staining in mature T cells. Numbers represent MFI for each cell population. (D). The ratio of ER Tracker MFIs in Atg7-deficient cell populations to those in corresponding wild type cell populations. B220+ cells were used as a negative control. The mean and SD are showed in the figure. Data shown in Figure 1A-D were obtained from three pairs of Atg7f/fLck-Cre and Atg7f/f (wildtype) mice. (E). Fluorescent imaging of ER tracker staining in Atg7-deficient and control CD4+ T cells. The z-stack pictures were 1.2μm apart and using 63x oil object.
FIGURE 4. Impaired calcium flux in Atg7-deficient T cells stimulated with ionomycin.

(A). Calcium influx in autophagy-deficient T cells upon ionomycin stimulation. Lymph node cells from Atg7f/f or Atg7f/fLck-Cre mice were loaded with Indo-1 and stimulated with 13 nM ionomycin. Samples were gated on naïve CD44low CD4+7-AAD- or CD44low CD8+7-AAD- cells. Dashed lines represent Atg7f/f T cells and solid lines represent Atg7f/fLck-Cre T cells. This experiment was repeated four times. (B). Indo-1-loaded cells were stimulated with 60 nM ionomycin in calcium-free HBSS containing 1 mM EGTA, and [Ca2+]i were analyzed over a period of 5 min. Dashed lines represent Atg7f/f cells and solid lines represent Atg7f/fLck-Cre cells. This experiment was repeated three times. (C). The integrated increase in Ca2+ in Atg7f/f or Atg7f/fLck-Cre CD4+ T cells over a period of 5 min. Cells were loaded with Fura-2 and stimulated with 13 nM ionomycin. The integrated Ca2+ increase was calculated as described in Materials and Methods for sixty individual cells. The beginning of calcium influx was defined as the timepoint at which the first 5% increase in fluorescence intensity occurred. Thirty frames were collected over a period of 5 min after the beginning of calcium influx for calculation of the absolute integrated Ca2+ increase for each individual cell (p=6.19×10-46). (D). Kinetics of Ca2+ influx in Atg7-deficient and wildtype T cells. Sixty cells were synchronized by defining the beginning of calcium flux as the timepoint at which the first 5% of cells displayed an increased fluorescence intensity ratio. Images obtained during the 5 min period after initiation of calcium influx were used to analyze kinetic changes in calcium. (E). Length of time to reach the peak level of Ca2+ influx in each individual cell. Calcium influx was calculated in 60 cells for each group (p=6.13×10⁻⁹).
FIGURE 6. Impaired redistribution of STIM-1 in Atg7-deficient T cells.

Purified T cells were added to glass coverslips coated with anti-CD3 antibody or anti-H-2Kb antibody, incubated for 20 min, and fixed with 2% paraformaldehyde. Cells were surface stained with anti-CD4 and intracellularly stained with anti-STIM-1 antibody. Z-stack images were captured at 1 μm intervals using 100x oil objective. The best focused layers were used to quantitate the fluorescence intensity of STIM-1 in resting wildtype and Atg7f/fLck-Cre CD4+ cells. More than 30 individual cells were analysed. For the analysis of STIM-1 punctae, one layer was selected from 3D deconvolution images, and the layers on either side of the selected layer were subtracted. The size and intensity of STIM-1 punctae were measured using MetaMorph 7.6 software. Fifty wildtype or Atg7f/fLck-Cre CD4+ cells were randomly selected for analysis. (A). Representative images of endogenous of STIM-1 and STIM-1 punctae in wildtype and Atg7f/fLck-Cre CD4+ cells stimulated by anti-CD3 mAb or thapsigargin. Images were obtained with Zeiss ApoTome system using AxioVision software with a 63x oil objective. (B). Fluorescence intensity of STIM-1 in resting wildtype and Atg7f/fLck-Cre CD4+ cells. (C). Area of STIM-1 punctae in anti-CD3 antibody activated wildtype and Atg7f/fLck-Cre CD4+ cells (p=0.6). (D). Fluorescence intensity of STIM-1 punctae in anti-CD3 antibody activated CD4 cells (p=3.5×10⁻¹⁵). (E). Area of STIM-1 punctae in wildtype and Atg7f/fLck-Cre CD4+ cells stimulated with thapsigargin (p=0.03). The LN cells from wildtype or Atg7f/fLck-Cre mice were stimulated with 100nM thapsigargin for 20min. The cells were fixed and stained intracellularly with STIM-1 antibody. The images of STIM-1 punctae were captured and quantitated using the same method as described above. (F). Fluorescence intensity of STIM-1 punctae in wildtype and Atg7f/fLck-Cre CD4+ cells stimulated with thapsigargin (p=0.16). (G). Protein expressions of STIM-1 and Orai1 in Atg7-deficient T cells. The Western blot was repeated three times using purified T cells from three different pairs of wildtype and Atg7f/fLck-Cre mice. The numbers represents the ratios of intensity of STIM-1 or Orai1 bands to the intensity of actin bands. Normalized Western blot intensities were quantified and shown in the right panel. STIM-1 (mean±SD, *p=0.0069). Orai1 (mean±SD, p=0.47). (H). IL-2 production by autophagy-deficient T cells. Purified naïve CD4+ T cells were stimulated with plate-bound anti-CD3 (5μg/ml) or anti-CD3 plus anti-CD28 (2μg/ml) over night. IL-2 in the cell culture supernatants was measured by ELISA. (*p=0.0057, **p=0.00049).
RESULTS
Endoplasmic reticulum is expanded in Atg7-deficient T cells
Recent studies have demonstrated that autophagy plays an essential role in maintaining intracellular organelle homeostasis in yeast (14-16, 18). We previously found that mitochondrial content is developmentally regulated in T lymphocytes, and autophagy is required for mitochondrial clearance in mature T lymphocytes (26). Given these findings, we examined another important intracellular compartment, ER, in wildtype and autophagy-deficient developing T lymphocytes with two goals in mind. First, we wanted to determine whether ER content in T lymphocytes is developmentally regulated. Second, we wanted to examine whether autophagy regulates ER homeostasis in primary T lymphocytes.
To examine the ER compartment in T cells, we first stained thymocytes and splenic T cells from wild type and autophagy-deficient Atg7f/fLck-Cre mice with ER-Tracker Blue-White DPX (ER-Tracker) and analyzed the cells by flow cytometry. ER-Tracker, a cell permeable dye which is not toxic to live cells at low concentrations, is highly selective for ER and used to visualize ER in previous studies (32, 33). To account for the changing size of developing T cells, the mean fluorescence intensity (MFI) of ER-Tracker was divided by the mean forward scatter intensity (MFSCI) for each cell population. These values were then normalized to the ER-Tracker MFI/MFSCI value calculated for CD4+CD8+ double-positive (DP) thymocytes, which was set to 100%. In wildtype mice, DN thymocytes contain 1.5-fold more ER than DP thymocytes, while CD4+ SP thymocytes have similar ER content to that observed in DP thymocytes (Fig. 1A). Naïve wildtype CD4+ T cells exhibit a slight decrease in their ER content; these cells contain ~73% as much ER as DP thymocytes. In contrast, naïve wildtype CD8+ T cells exhibit a larger decrease in their ER content, containing ~62% as much ER as DP thymocytes (Fig. 1B). We next examined ER content in Atg7-deficient T lymphocytes. DN, DP, and SP thymocytes from Atg7f/fLck-Cre mice all contained levels of ER comparable to those observed in their wildtype counterparts (Fig. 1A, B); however, ER content in both CD44low and CD44hi peripheral T lymphocytes from Atg7f/fLck-Cre mice was 160%-170% of the level observed in wildtype T cells (Fig. 1C, D) (p<0.05). These results demonstrate that ER content in T lymphocytes is developmentally regulated, suggesting that autophagy regulates ER turnover in mature T lymphocytes.
In order to visualize the spatial distribution of ER in wildtype and autophagy-deficient T cells, purified CD4+ T cells were stained with ER-Tracker dye and surface stained with CD4-biotin and streptavidin-Alexa 594. Individual cells were examined by fluorescent microscopy. In both wildtype and Atg7-deficient T cells, ER-Tracker dye stained a discrete, reticular subcellullar structure within the cytoplasmic space. Imaging of wildtype CD4+ T cells showed that ER-Tracker staining was largely localized to one pole of each cell. In contrast, imaging of CD4+ T cells from Atg7f/fLck-Cre mice demonstrated abundant staining distributed throughout the entire cell (Fig. 1E). This increase in ER-Tracker staining is consistent with the increase in ER content observed by flow cytometry. To more specifically visualize the morphology of ER in Atg7-deficient T cells, wildtype or Atg7f/fLck-Cre T cells were infected with a retrovirus containing an ER probe (ER-probe-YFP). This probe is composed of an N-terminus derived from calnexin protein, including its transmembrane domain, followed by yellow fluorescent protein (YFP) and a C-terminal ER retrieval sequence (KKSL), which confines the probe to ER by blocking its transportation from ER to Golgi (34). Consistent with the above results, more ER-probe-YFP-labeled structures were observed in Atg7-deficient CD4+ T cells than in wildtype CD4+ T cells (Supplemental movie 1). Similar results were seen in Atg7-deficient CD8+ T cells (data not shown). In addition, electron microscopy analysis showed that autophagy-deficient CD4+ T cells contained more membrane structures/vesicles than wildtype CD4+ T cells (Fig. 2A, left panel figures). Quantification of these membrane structures showed increased membrane structures in both Atg7-deficient CD4+ and CD8+ T cells as compared to wildtype T cells (Fig.2A, right panel figure). To further specifically confirm that ER content was elevated in Atg7-deficient mature T cells, we examined the expression level of calnexin, an ER-resident protein (35), by Western blot. Calnexin protein expression was increased approximately 2-fold in Atg7-deficient T cells (Fig. 2B). Three independent calnexin Western blots were repeated with samples from three pairs of mice and quantified. As showed in Figure 2B, the expression of calnexin is significantly increased in Atg7-deficient T cells (p<0.05). Together, these results demonstrate that ER is expanded in autophagy-deficient mature T cells, suggesting that autophagy is essential for ER homeostasis in T lymphocytes.
FIGURE 2. Increased expression of ER stress markers in Atg7-deficient T cells.

(A). Representative EM images of naïve Atg7-deficient and wildtype CD4+ T cells (left two panels) and quantification of membrane structures in EM images (right panel figure). Each cell was divided into 12 equal sections based on the face of a clock. Membrane scores were defined as the number of sections per cell containing membrane structure(s). The bar figure are mean and SD (*n=50, p=3.23×10⁻⁷ for CD4 cells and **n=45, p=2.63×10⁻¹⁹ for CD8 cells). (B). Calnexin protein expression in purified total T cells from Atg7f/fLck-Cre and Atg7f/f mice was analyzed by Western blot. Numbers represent the ratios of intensity of calnexin bands to actin bands (upper panel). This Western blot analysis was repeated three times using samples from three different pairs of wildtype and Atg7f/fLck-Cre mice. The normalized intensities of three independent experiments are showed in the lower panel figure (mean±SD, *p=0.04). (C). Expression of ER stress markers in autophagy-deficient T cells. Cell lysates of purified total T cell from Atg7f/f or Atg7f/fLck-Cre mice splenocytes were prepared. The expression levels of PDI, Grp78, and Grp94 were analyzed by Western blot. Numbers represent the ratios of the intensity of target molecule band to the intensity of actin band. This Western blot was repeated twice using three pair of wildtype and Atg7f/fLck-Cre mice.
We further determined whether ER stress response is activated when ER homeostasis is disrupted in the absence of autophagy. Several ER stress markers, including ER resident molecule protein disulfide isomerase (PDI), ER chaperones glucose regulated protein 78 (Grp78), and Grp94, were analyzed in Atg7-deficient naïve T cells. High expression levels of Grp78, Grp94 and PDI were detected in autophagy-deficient T cells (Fig. 2C). This result indicates activation of ER stress response in autophagy-deficient T cells.
Calcium flux is impaired in Atg7-deficient T cells
The expansion of the ER compartment observed in autophagy-deficient T cells may affect T cell function. Given that ER is a Ca2+ storage site, and Ca2+ influx is an essential function of TCR signaling, we investigated calcium flux in Atg7-deficient T cells. Splenocytes from Atg7f/fLck-Cre or Atg7f/f mice were loaded with Indo-1, stimulated with biotin-labeled anti-CD3 and either anti-CD4 or anti-CD8 antibodies, and then cross-linked with streptavidin. The kinetic change in cytosolic calcium concentration [Ca2+]i was measured by flow cytometry. Naïve wildtype CD44low CD4+ or CD44low CD8+ T lymphocytes showed a rapid increase in [Ca2+]i after stimulation (Fig. 3A); however, the peak [Ca2+]i was dramatically decreased in Atg7-deficient CD8+ and CD4+ T cells (Fig. 3A).
FIGURE 3. Impaired calcium flux in Atg7-deficient T cells.

(A). Calcium influx in autophagy-deficient T cells upon TCR engagement. Lymph node cells from Atg7f/f or Atg7f/fLck-Cre mice were loaded with Indo-1 and then stained with7-AAD, anti-CD44-FITC and either anti-CD4-PE or anti-CD8-PE antibodies. Cells were resuspended in HBSS buffer containing 1.26 mM CaCl2. The Indo-1 loaded cells were stimulated with biotin-anti-CD3 (5 μg/ml) and biotin-anti-CD4 (1 μg/ml) antibodies for analysis of CD4+ T cells (or biotin-anti-CD8 antibody for CD8+ T cells) for 1 min. After establishing a base line, the cells were crosslinked with 25 μg/ml streptavidin and the stimulation was indicated by the arrow in the figure (same in other calcium flux figures). Intracellular Ca2+ kinetics were expressed as the ratio of emission at 405 nm to that at 510 nm. Graphs represent calcium influx in live naïve 7-AAD-CD44low CD4+ or 7-AAD- CD44low CD8+ cells. This experiment was repeated three times independently. (B). Phosphorylation of p38, ERK, and PLCγ1 in autophagy-deficient T cells upon TCR stimulation. Purified naïve CD44low T lymphocytes were stimulated with biotin-labeled anti-CD3 (5 μg/ml), biotin-labeled anti-CD4 (1 μg/ml) and biotin-labeled anti-CD8 (1 μg/ml) for 1 min and crosslinked with streptavidin (25 μg/ml) for 1, 1.5, 3, 5, or 10 min. Phosphorylated proteins were detected with anti-phosphorylated p38, ERK, or PLCγ1 and visualized using Alexa Fluor 680- or IRDye 800-conjugated anti-species antibodies. Numbers represent the ratios of intensity of the target molecule bands to intensity of actin bands. These Western blots analysis were repeated five times using purified T cells from different pairs of wildtype and Atg7f/fLck-Cre mice. (C). IkBα degradation in autophagy-deficient T cells after CD3/CD28 stimulation. T cells were stimulated with anti-CD3 (5μg/ml) and anti-CD28 (2μg/ml) antibodies overnight and whole cell lysates were subjected to Western blot analysis. Numbers represent the ratios of intensity of the IkBα bands to intensity of actin bands. (D). Increased calcium store in Atg7-deficient T cells. Lymph node cells from Atg7f/f or Atg7f/fLck-Cre mice were loaded with Indo-1 in Ca2+-free HBSS buffer. Cells were stained with anti-CD44-FITC and either anti-CD4-PE or anti-CD8-PE, and resuspended in calcium-free HBSS containing 1 mM EGTA. A total of 1×10⁶ cells were incubated in calcium-free conditions with biotin-anti-CD3 and either biotin-anti-CD4 or biotin-anti-CD8 antibodies for 1 min. After establishing a base line using flow cytometry, Ca2+-free streptavidin was added to crosslink anti-CD3 and anti-CD4 (or anti-CD8) antibodies (upper two panels). Above Indo-1 loaded cells were also stimulated with 1μM thapsigargin (TG) in calcium-free HBSS containing 1 mM EGTA to measure the calcium store in ER (lower two panels). The kinetic changes in [Ca2+]i were visualized as the ratio of emission at 405 nm to that at 510 nm over a period of 7 min. All cells were gated on CD44low and 7-AAD negative cells. Above experiments were repeated three times independently.
During TCR-mediated T cell activation, the calcium response is initiated by efflux of calcium from ER stores. The depletion of ER Ca2+ stores activates the calcium release activated calcium (CRAC) channel on the plasma membrane. Influx of calcium from the extracellular environment through the CRAC channel is the major source contributing to the change in [Ca2+]i (36). The dampened calcium response observed in Atg7-deficient T cells thus suggests a defect in CRAC channel activation; however, this defect could be caused by impaired TCR signaling upstream of IP3 production, impaired ER Ca2+ storage or release, or impaired function of CRAC channel itself.
T cell calcium flux is initiated by the activation of TCR proximal signaling. To determine whether decreased calcium flux in autophagy-deficient T cells is due to a proximal defect, we examined the activation of signaling molecules in the proximal TCR signaling pathway in Atg7-deficient T lymphocytes. Purified Atg7-deficient and wildtype CD44low naïve T cells were stimulated with biotin-labeled anti-CD3, anti-CD4 and anti-CD8 antibodies and cross-linked with streptavidin at different time points. Phosphorylation of PLCγ1, p38, and extracellular receptor-activated kinase (ERK) was analyzed. As shown in Fig. 2B, TCR stimulation induced similar levels of phosphorylation of PLCγ1 in Atg7f/f and Atg7f/fLck-Cre T cells. No defect was observed in phosphorylation of p38 and ERK in Atg7-deficient T cells; phosphorylation of these proteins was either not changed or increased as compared to that in wildtype T cells (Fig. 3B). Furthermore, degradation of IκBα was not impaired in Atg7-deficient T cells (Fig. 3C). These results demonstrate that proximal TCR signaling and NFκB activation remain intact in Atg7-deficient T cells, suggesting that the calcium flux defect observed in Atg7-deficient T lymphocytes is not a consequence of impaired proximal TCR signaling.
To examine ER calcium store function, we detected calcium efflux in calcium-free HBSS buffer containing 1 mM of the chelator EGTA. Calcium store release was higher in Atg7-deficient CD4+ or CD8+ T lymphocytes stimulated with anti-CD3 and either anti-CD4 or anti-CD8 antibodies than that in stimulated wild type T lymphocytes (Fig. 3D upper panels). The magnitude of calcium efflux from the ER is much lower than that of calcium influx across the plasma membrane. ER takes up calcium through the sarco/endoplasmic reticulum Ca2+-ATPase (SERCA) pump, which is expressed on the ER membrane and maintains ER calcium stores. To exactly measure the ER calcium content, the Atg7-deficient T cell or wildtype T cells were stimulated with SERCA pump inhibitor, thapsigargin(37), using 1μM concentration in calcium free HBSS with 1mM EGTA. As showed in Figure 3D lower two panels, more calcium contents were detected in Atg7-deficient T cells than that in wildtype T cells. These results suggest that more calcium is stored in ER of Atg7-deficient T cells than in ER of wildtype T lymphocytes and that there is no Ca2+ efflux defect. The reduced calcium response peak observed in Atg7-deficient T cells is thus likely due to a defect in calcium influx. These results are consistent with our observation that ER content is dramatically expanded in Atg7-deficient T cells due to a defect of autophagy.
Impaired calcium flux in Atg7-deficient T cells is due to an intrinsic defect in ER
To further confirm these results, we examined calcium flux in Atg7-deficient T cells stimulated with ionomycin, which bypasses surface TCR engagement to mobilize calcium. Ionomycin readily induces store-regulated calcium uptake in T lymphocytes (38) and other cell types (39). Consistent with our observation that TCR stimulation-induced calcium responses were dampened in autophagy-deficient T cells, [Ca2+]i in Atg7-deficient CD4+ and CD8+ T lymphocytes stimulated with a low concentration of ionomycin (13 nM) peaked at levels that were ~50% of peak [Ca2+]i levels in wildtype T cells (Fig. 4A). Interestingly, when cells were stimulated with a high concentration of ionomycin (more than 300 nM), the kinetics of calcium influx and levels of calcium response peaks were similar between Atg7-deficient and wildtype T lymphocytes (data not shown). Stimulation with a low concentration of ionomycin causes depletion of ER calcium stores and influx of calcium through the CRAC channel. The restoration of calcium levels in autophagy-deficient T cells after stimulation with a high concentration of ionomycin may be due to a CRAC channel-independent direct transfer of Ca2+ across the plasma membrane (38). Consistent with the results shown in Fig. 3D, increased calcium efflux was observed in Atg7-deficient T cells stimulated with ionomycin under zero extracellular calcium conditions (Fig. 4B).
We further analyzed calcium mobilization in Atg7-deficient T lymphocytes at a single cell level by using microscopy to monitor [Ca2+]i kinetics in T cells stimulated with ionomycin. We found that the integrated increase in cytosolic calcium in Atg7-deficient CD4+ T cells during the 5 min following addition of ionomycin was <20% of that in wildtype CD4+ T cells (Fig. 4C and Supplemental Movie 2). [Ca2+]i in Atg7-deficient CD4+ T cells was lower and decreased faster than that in wildtype CD4+ T cells (Fig. 4D). In addition, the peak value of the increased [Ca2+]i in individual Atg7-deficient CD4+ T cells was less than 50% of that in wildtype CD4+ T cells. Furthermore, Atg7-deficient T cells reached their peak [Ca2+]i faster (56 seconds on average) during calcium influx than wild type T cells (76 seconds on average) (Fig. 4E).
The abnormal ER homeostasis and increased intracellular calcium stores in Atg7-deficient T cells may account for the calcium influx defect observed upon TCR stimulation. ER takes up calcium through SERCA pump to maintain ER calcium stores. Western blot analysis showed increased expression of the SERCA pump on the expanded ER found in autophagy-deficient T cells – the expression of SERCA2 was more than 2-fold higher in Atg7-deficient T cells than in wildtype T cells (Fig. 5A left panel figure). The Western blots of SERCA2 were repeated, quantified and showed in Figure 5A right panel figure. Expansion of ER and increased expression of SERCA2 may lead to increased ER calcium stores and incomplete ER calcium store depletion after stimulation in Atg7-deficient T cells. If the calcium mobilization defect in Atg7-deficient T cells is due to increased ER calcium stores or incomplete ER calcium store depletion, treatment with the SERCA pump inhibitor should rescue the calcium influx defect in Atg7-deficient T cells by decreasing ER calcium stores and inhibiting calcium uptake by the ER. To test this hypothesis, we loaded Atg7-deficient and wildtype T lymphocytes with Indo-1, stimulated these cells with different concentrations of thapsigargin, and examined calcium influx. The calcium influx profiles of autophagy-deficient and wild type T cells were similar during the initial phase of thapsigargin stimulation (Fig. 5B). Interestingly, calcium influx was enhanced at later timepoints in Atg7-deficient T cells stimulated with a low concentration of thapsigargin (Fig. 5B, left panel figure). Calcium influx was comparable between Atg7-deficient and wildtype T cells stimulated with higher concentrations of thapsigargin (Fig. 5B, middle and right panel figures). This result suggests there is no intrinsic defect in CRAC channel function in Atg7-deficient T cells, and the calcium flux defect in Atg7-deficient T cells is likely due to the abnormal expansion of ER and redistribution of calcium into ER after stimulation.
FIGURE 5. The SERCA pump inhibitor thapsigargin rescues the calcium influx defect in Atg7-deficient T cells.
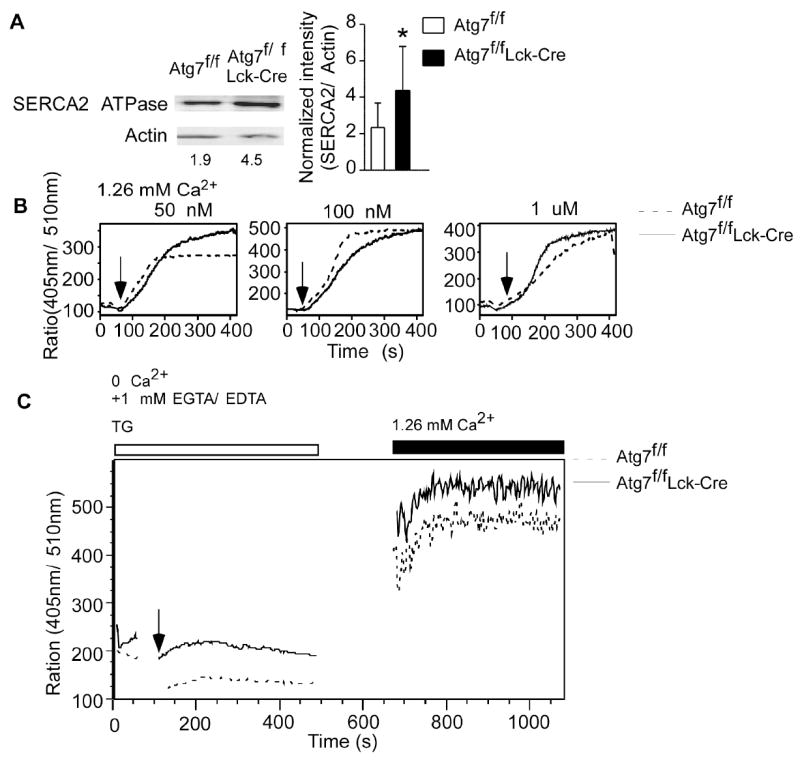
(A). The expression of SERCA2 was analyzed by Western blot (left panel). Numbers represent ratios of the intensity of SERCA2 bands to intensity of actin bands. This Western blot analysis was repeated six times using purified T cells from different pairs of wildtype and Atg7-deficient mice splenocytes. Normalized Western blot intensities were quantified and showed in the right panel figure (mean ± SD, *p=0.006). (B). Thapsigargin-induced calcium influx in Atg7-deficient T cells. Lymph node cells from Atg7f/f and Atg7f/fLck-Cre mice were loaded with Indo-1, suspended in HBSS containing 1.26 mM CaCl2 and stimulated with different concentrations of thapsigargin. Samples were gated on naïve CD44low CD4+ 7-AAD- or CD44low CD8+ 7-AAD- cells. Dashed lines represent Atg7f/f cells and solid lines represent Atg7f/fLck-Cre cells. This experiment was repeated three times. (C). Analyzing the calcium influx through CRAC channel in autophagy-deficient T cells by flow cytometry. Lymph node cells from Atg7f/fLck-Cre and Atg7f/f mice were loaded with Indo-1 and cell surfaces were stained with anti-CD4-PE, anti-CD44-FITC and 7-AAD. The Indo-1 loaded cells were resuspended in HBSS containing 1 mM EGTA and 1 mM EDTA but without Ca2+ and Mg2+. After establishing a base level of fluorescence intensity ratio of 405 nm to 510 nm on flow cytometry for 1 min, the Indo-1 loaded cells were stimulated with 1 μM thapsigargin (TG) and the events were collected over a period of 7 min. Then the flow cytometry was paused and TG stimulated cells were spun down. The Ca2+-free buffer was removed and replaced with HBSS containing 1.26 mM Ca2+. The TG stimulated cells were washed once and then resuspended in HBSS with 1.26 mM Ca2+. The flow cytometry was resumed and more events were recorded for another 7 min period. The profiles were gated on CD4+CD44LOW7-AAD- cell population. This experiment was repeated three times independently.
To directly analyze the calcium influx through CRAC channel in Atg7-deficient T cells, we stimulated Indo-1 loaded Atg7-deficient and wildtype T cells with thapsigargin in Ca2+-free buffer and then resuspended the cells in HBSS containing 1.26 mM Ca2+ after stimulation. Calcium influx was analyzed by flow cytometry. Thapsigargin stimulation induced obvious calcium flux in both Atg7-deficient and wildtype T cells in Ca2+-free buffer (Fig. 5C). This calcium flux was from the ER calcium store. As expected, after replacing Ca2+-free buffer with buffer containing Ca2+, the [Ca2+]i was readily increased in both Atg7-deficient and wild type T cells (Fig. 5C). Similar experiments were performed using Fura-2 loaded Atg7-deficient T cells and analyzed by calcium live images under microscope. The calcium influx from each individual Atg7-deficient T cells were very similar after switching calcium free buffer to calcium buffer when stimulated with thapsigargin (data not shown). Together, these results demonstrate that the CRAC channel remains intact in Atg7-deficient T cells, suggesting that the excess ER and increased ER calcium stores in Atg7-deficient T cells are the cause of impaired calcium influx. These results strongly suggest that autophagy is involved in the regulation of calcium mobilization in T lymphocytes. The calcium flux defect in Atg7-deficient T cells is an ER-intrinsic defect caused by impaired depletion of ER calcium stores after stimulation.
Redistribution of STIM-1 is impaired in Atg7-deficient T cells upon TCR activation
CRAC channel opening is tightly regulated by the calcium sensor STIM-1, which is expressed on ER (23). After T cell activation, STIM-1 is triggered by the depletion of ER calcium stores and redistributed to form punctae near ER-plasma membrane junctions, allowing STIM-1 to engage Orai1, the CRAC channel pore-forming subunit, resulting in opening of the CRAC channels. To further determine whether defective Ca2+ depletion causes impaired calcium influx in autophagy-deficient T cells, Atg7-deficient T cells were stimulated with plate-bound anti-CD3 antibody, and STIM-1 distribution was analyzed. As shown in Fig. 6A, the endogenous STIM-1 is expressed in naïve resting Atg7-deficient T cells. The total intensity of STIM-1 in Atg7-deficient T cells is even higher than that in wildtype T cells (Fig. 6B). STIM-1 punctae could be visualized in stimulated T cells. STIM-1 was redistributed after stimulation in both Atg7-deficient and wildtype T cells. The size of STIM-1 punctae in Atg7-deficient T cells was comparable to that in wildtype T cells (Fig. 6C); however, the fluorescence intensity of these punctae was much lower in Atg7-deficient T cells upon TCR stimulation (Fig. 6D). The decreased intensity of STIM-1 punctae in Atg7-deficient T cells suggests that fewer CRAC channels are opened in these cells after T cell activation.
To further determine that the impairment of STIM-1 redistribution is caused by defective depletion of ER calcium store in Atg7-deficient T cells, the redistribution of STIM-1 under stimulation of the SERCA pump inhibitor, thapsigargin, was analyzed. As expected, STIM-1 was redistributed in both Atg7-deficient T cells and wildtype T cells when stimulated by thapsigargin. The area of STIM-1 punctae in Atg7-deficient T cells was significantly higher (p=0.03) than that in wildtype cells and the intensity of STIM-1 punctae was comparable between Atg7-deficient and wildtype T cells (p=0.16) when stimulated with thapsigargin (Fig. 6E and 6F). These results are consistent with the calcium influx profiles in Atg7-deficient T cells stimulated with thapsigargin.
We further examine the expression levels of STIM-1 and the CRAC channel pore-forming subunit Orai1 in Atg7-deficient T cells by Western blot. The expression of STIM-1 is higher in Atg7-deficient T cells, while Orai1 expression is comparable between wildtype and Atg7-deficient T cells (Fig 6G). The higher expression of STIM-1 may be due to the expanded ER organelle in autophagy-deficient T cells.
To test whether calcium flux defect affects IL-2 production in autophagy-deficient T cells, both purified wildtype and autophagy-deficient naïve CD4+ T cells were stimulated with plate bound anti-CD3 or anti-CD3 plus anti-CD28. Interestingly, more IL-2 were produced from autophagy-deficeint T cells either stimulated with anti-CD3 antibody or anti-CD3 plus anti-CD28 antibodies after overnight stimulation. This suggests that the calcium flux defect in autophagy-deficeint T cells may not reduce the IL-2 transcription and translation. More IL-2 produced in autophagy-deficient CD4+ T cells suggests that autophagy may regulate IL-2 secretion in T lymphocyte and this need to be further explored.
Discussion
Several important points emerge from this study. First, our data show that ER content is developmentally regulated in T lymphocytes, and this regulation is dependent on autophagy. Second, autophagy-deficient T lymphocytes exhibit a dramatic defect in calcium influx upon TCR stimulation. This calcium influx defect is related to abnormal expansion of ER and increased intracellular calcium stores. Consequently, the defect in calcium store depletion results in a decline in CRAC channel function. To our knowledge, this is the first evidence to illustrate the impact of autophagy on calcium homeostasis and CRAC channel-related calcium mobilization.
Rough ER is the site of protein translation, secretory protein transportation, and protein glycosylation, while smooth ER is the site of steroid synthesis, detoxification of drugs and poisons, and calcium sequestration. In T lymphocytes, several studies have demonstrated that ER calcium homeostasis regulates T cell function. For example, T cells lacking both Bax and Bak, two proapoptotic proteins, exhibit defective calcium signaling and impaired proliferation after TCR stimulation (40). It has also been demonstrated that Bax and Bak control ER calcium release (40). Furthermore, the antiapoptotic protein Bcl-2 can inhibit TCR-induced release of calcium from ER by binding to the IP3 receptor (41). Our data suggest that autophagy is a novel mechanism regulating calcium mobilization by maintaining ER homeostasis in mature T lymphocytes. These findings provide an interesting contrast to a previous study demonstrating that calcium mobilization regulates autophagy, in which it was shown that calcium mobilization reagents increase the cytosolic calcium concentration, inducing autophagy (42). Calcium-dependent induction of autophagy is mediated by Ca2+/calmodulin-dependent kinase kinase-β and AMP-activated protein kinase and inhibited by ectopic expression of Bcl-2 in the ER (42). Together, these results indicate that autophagy and calcium mobilization are interrelated and can affect each other.
A requirement for regulation of ER content in T cells has not been previously demonstrated. In yeast, selective sequestration of ER by autophagy is part of the unfolded protein response (16-18). In Atg7-deficient T cells, Grp94, Grp78, and PDI are constitutively upregulated, indicating activation of the ER stress response. This suggests that similar to what has been observed in the yeast system, ER stress may initiate autophagy to maintain ER homeostasis and normal functional responses in T lymphocytes. This likely enables eukaryotic cells to both adapt during periods of stress and also effectively modify cellular functions such as calcium signaling in mature T cells and secretory protein synthesis in developing and mature T cells. Autophagy may not directly regulate calcium mobilization in T lymphocytes and Atg7 is not a calcium sensor to directly control the calcium flux. Our recent data showed that autophagy temporarily regulates the organelles homeostasis in T lymphocytes (manuscript submitted). However, the other functions of ER, such as translation, in Atg7-deficient T cells may not be affected. The Atg7-deficient T cells express similar surface markers as the wildtype T cells, for example: CD4, CD8 and TCRβ(26). Atg7-deficient T cells can be activated to express CD25 and CD69 comparable to wildtype T cells after anti-CD3 stimulation (data not shown). Although the calcium influx is impaired in autophagy-deficient T cells, there is still certain level of calcium mobilized in autophagy-deficient T cells after anti-CD3 antibody stimulation. This may be the reason why IL-2 production is not defective in autophagy-deficient T cells.
STIM-1 serves as the calcium sensor in ER, and the interaction between STIM-1 and Orai1 is required for CRAC channel opening (20, 22). The size of STIM-1 punctae is similar in Atg7-deficient and wildtype T cells, but the intensities of these punctae are much lower in Atg7-deficient T cells. Our data suggest that the redistribution of STIM-1 is essential for CRAC channel opening in T cells. This is consistent with a previous report that the CRAC channel is constitutively activated in Jurkat cells that overexpress wildtype STIM-1 or an EF-hand mutant of STIM-1 (21). Calcium influx is also regulated by mitochondria. Mitochondria buffer intracellular calcium and sustain CRAC channel opening in T lymphocytes (43, 44). Although Atg7-deficient T cells contain excess mitochondria (26), the mitochondrial homeostasis defect may not be related to the calcium influx defect in these cells. We treated Atg7-deficient T cells with carbonyl cyanide m-chlorophenylhydrazone (CCCP), which inhibits mitochondria from taking up calcium (43), and then stimulated the cells with thapsigargin. Both Atg7-deficient and wildtype T cells displayed similar [Ca2+]i. Similarly, when cells were stimulated with thapsigargin before CCCP treatment, both Atg7-deficient and wildtype T cells displayed similar [Ca2+]i (data not shown), suggesting mitochondrial Ca2+ uptake and release is not dysregulated in Atg7-deficient T lymphocytes. Recently published data found that Orai1 channel could be inhibited by H2O2 in T lymphocytes (45). Reactive oxygen species (ROS) production is increased in Atg7-deficient T cells (26). However, polyethylene glycol (PEG)-catalase, the ROS production scavenger, does not rescue the calcium influx defect in Atg7-deficient T cells (data not shown).
Although our data show that both ER and mitochondria are regulated by autophagy in T lymphocytes (26), the homeostasis of ER is regulated differently from that of mitochondria in these cells. Mitochondrial content is relatively high in DN, DP, and CD4+ SP thymocyte subpopulations, and excess mitochondria must be cleared when immature T cells exit the thymus to the periphery (26). In contrast, ER content peaks in the DN thymocyte subpopulation and is maintained at a low level in more mature thymocyte subpopulations and in mature peripheral T cells. In the absence of autophagy, ER is expanded in mature T lymphocytes. Differences in homeostasis of mitochondria and ER during T cell development may be related to the different functions of these organelles. ROS, which are produced as a byproduct of the mitochondrial respiratory chain, are toxic to cells. For mature T lymphocytes, mitochondrial content must be maintained at a low level to prevent excess ROS production. This is supported by the finding that autophagy-deficient T cells produce more ROS than wildtype T cells (26). Another potential explanation for the differences observed in ER and mitochondrial homeostasis may be the role of mitochondria in apoptosis. Autophagy-deficient T cells express more cytochrome c than wild type T cells, making them more sensitive to apoptosis (26).
Future studies will provide important information about the way in which autophagy-mediated regulation of ER content may fit into particular cellular responses during T cell development, homeostasis, and function. Our functional data points to an interesting connection between autophagy-mediated regulation of ER content and calcium signaling in T cells. In yeast, organelle homeostasis is maintained largely through organelle-specific autophagic processes such as pexophagy, mitophagy, and ER-phagy (14, 16). Here we found that ER, like mitochondria, is developmentally regulated by autophagy in T lymphocytes. We previously showed that Atg5 is essential for T lymphocyte survival and proliferation (25), and we recently found that both Atg5 and Atg7 are required for mitochondrial homeostasis in T lymphocytes (26). Together with the calcium influx defect in Atg7-deficient T cells reported here, these data strongly suggest that autophagy plays multiple important physiological roles in regulating T lymphocyte function by controlling organelle homeostasis.
In summary, our results demonstrate that autophagy is essential for ER homeostasis. The abnormal expansion of ER and increased intracellular calcium stores in Atg7-deficient T cells result in impaired ER calcium stores depletion and redistribution of STIM-1 to the ER-plasma membrane junction after activation, leading to defective calcium flux upon stimulation in Atg7-deficient T cells.
Supplementary Material
Acknowledgments
We thank Dr. Michael Cook for help with the flow cytometry, and Dr. Sara Miller and Philip Christopher for help with transmission electron microscopy. We thank Claire L. Gordy for editing the manuscript.
This work was supported by NIH grants AI074944 and AI074754 (both to Y.-W. H.).
Abbreviations
- CRAC
store-operated Ca2+-release activated Ca2+
- ER
endoplasmic reticulum
- SERCA
ER sarco/endoplasmic reticulum Ca2+-ATPase
- STIM-1
stromal interaction molecule-1
Footnotes
Conflict of interest: The authors declare no financial or commercial conflict of interest.
References
- 1.Mizushima N, Ohsumi Y, Yoshimori T. Autophagosome formation in mammalian cells. Cell Structure & Function. 2002;27:421–429. doi: 10.1247/csf.27.421. [DOI] [PubMed] [Google Scholar]
- 2.Klionsky DJ. Autophagy: from phenomenology to molecular understanding in less than a decade. Nat Rev Mol Cell Biol. 2007;8:931–937. doi: 10.1038/nrm2245. [DOI] [PubMed] [Google Scholar]
- 3.Levine B, Deretic V. Unveiling the roles of autophagy in innate and adaptive immunity. Nat Rev Immunol. 2007;7:767–777. doi: 10.1038/nri2161. [DOI] [PMC free article] [PubMed] [Google Scholar]
- 4.Münz C. Enhancing Immunity Through Autophagy. Annu Rev Immunol. 2009;27:423–449. doi: 10.1146/annurev.immunol.021908.132537. [DOI] [PubMed] [Google Scholar]
- 5.Ohsumi Y. Molecular dissection of autophagy: two ubiquitin-like systems. Nat Rev Mol Cell Biol. 2001;2:211–216. doi: 10.1038/35056522. [DOI] [PubMed] [Google Scholar]
- 6.Mizushima N, Levine B, Cuervo AM, Klionsky DJ. Autophagy fights disease through cellular self-digestion. Nature. 2008;451:1069–1075. doi: 10.1038/nature06639. [DOI] [PMC free article] [PubMed] [Google Scholar]
- 7.Liang XH, Jackson S, Seaman M, Brown K, Kempkes B, Hibshoosh H, Levine B. Induction of autophagy and inhibition of tumorigenesis by beclin 1. Nature. 1999;402:672–676. doi: 10.1038/45257. [DOI] [PubMed] [Google Scholar]
- 8.Kihara A, Noda T, Ishihara N, Ohsumi Y. Two distinct Vps34 phosphatidylinositol 3-kinase complexes function in autophagy and carboxypeptidase Y sorting in Saccharomyces cerevisiae. J Cell Biol. 2001;152:519–530. doi: 10.1083/jcb.152.3.519. [DOI] [PMC free article] [PubMed] [Google Scholar]
- 9.Levine B, Klionsky DJ. Development by self-digestion: molecular mechanisms and biological functions of autophagy. Dev Cell. 2004;6:463–477. doi: 10.1016/s1534-5807(04)00099-1. [DOI] [PubMed] [Google Scholar]
- 10.Levine B, Kroemer G. Autophagy in the pathogenesis of disease. Cell. 2008;132:27–42. doi: 10.1016/j.cell.2007.12.018. [DOI] [PMC free article] [PubMed] [Google Scholar]
- 11.Lee HK, Lund JM, Ramanathan B, Mizushima N, Iwasaki A. Autophagy-dependent viral recognition by plasmacytoid dendritic cells. Science. 2007;315:1398–1401. doi: 10.1126/science.1136880. [DOI] [PubMed] [Google Scholar]
- 12.Schmid D, Pypaert M, Munz C. Antigen-loading compartments for major histocompatibility complex class II molecules continuously receive input from autophagosomes. Immunity. 2007;26:79–92. doi: 10.1016/j.immuni.2006.10.018. [DOI] [PMC free article] [PubMed] [Google Scholar]
- 13.Lee HK, Mattei LM, Steinberg BE, Alberts P, Lee YH, Chervonsky A, Mizushima N, Grinstein S, Iwasaki A. In vivo requirement for Atg5 in antigen presentation by dendritic cells. Immunity. 2010;32:227–239. doi: 10.1016/j.immuni.2009.12.006. [DOI] [PMC free article] [PubMed] [Google Scholar]
- 14.Monastyrska I, Klionsky DJ. Autophagy in organelle homeostasis: peroxisome turnover. Mol Aspects Med. 2006;27:483–494. doi: 10.1016/j.mam.2006.08.004. [DOI] [PMC free article] [PubMed] [Google Scholar]
- 15.Lemasters JJ. Selective mitochondrial autophagy, or mitophagy, as a targeted defense against oxidative stress, mitochondrial dysfunction, and aging. Rejuvenation Res. 2005;8:3–5. doi: 10.1089/rej.2005.8.3. [DOI] [PubMed] [Google Scholar]
- 16.Bernales S, Schuck S, Walter P. ER-phagy: selective autophagy of the endoplasmic reticulum. Autophagy. 2007;3:285–287. doi: 10.4161/auto.3930. [DOI] [PubMed] [Google Scholar]
- 17.Mijaljica D, Prescott M, Devenish RJ. Endoplasmic reticulum and Golgi complex: Contributions to, and turnover by, autophagy. Traffic. 2006;7:1590–1595. doi: 10.1111/j.1600-0854.2006.00495.x. [DOI] [PubMed] [Google Scholar]
- 18.Bernales S, McDonald KL, Walter P. Autophagy counterbalances endoplasmic reticulum expansion during the unfolded protein response. PLoS Biol. 2006;4:e423. doi: 10.1371/journal.pbio.0040423. [DOI] [PMC free article] [PubMed] [Google Scholar]
- 19.Roos J, DiGregorio PJ, Yeromin AV, Ohlsen K, Lioudyno M, Zhang S, Safrina O, Kozak JA, Wagner SL, Cahalan MD, Velicelebi G, Stauderman KA. STIM1, an essential and conserved component of store-operated Ca2+ channel function. J Cell Biol. 2005;169:435–445. doi: 10.1083/jcb.200502019. [DOI] [PMC free article] [PubMed] [Google Scholar]
- 20.Liou J, Kim ML, Heo WD, Jones JT, Myers JW, Ferrell JE, Jr, Meyer T. STIM is a Ca2+ sensor essential for Ca2+-store-depletion-triggered Ca2+ influx. Curr Biol. 2005;15:1235–1241. doi: 10.1016/j.cub.2005.05.055. [DOI] [PMC free article] [PubMed] [Google Scholar]
- 21.Zhang SL, Yu Y, Roos J, Kozak JA, Deerinck TJ, Ellisman MH, Stauderman KA, Cahalan MD. STIM1 is a Ca2+ sensor that activates CRAC channels and migrates from the Ca2+ store to the plasma membrane. Nature. 2005;437:902–905. doi: 10.1038/nature04147. [DOI] [PMC free article] [PubMed] [Google Scholar]
- 22.Prakriya M, Feske S, Gwack Y, Srikanth S, Rao A, Hogan PG. Orai1 is an essential pore subunit of the CRAC channel. Nature. 2006;443:230–233. doi: 10.1038/nature05122. [DOI] [PubMed] [Google Scholar]
- 23.Park CY, Hoover PJ, Mullins FM, Bachhawat P, Covington ED, Raunser S, Walz T, Garcia KC, Dolmetsch RE, Lewis RS. STIM1 clusters and activates CRAC channels via direct binding of a cytosolic domain to Orai1. Cell. 2009;136:876–890. doi: 10.1016/j.cell.2009.02.014. [DOI] [PMC free article] [PubMed] [Google Scholar]
- 24.Penna A, Demuro A, Yeromin AV, Zhang SL, Safrina O, Parker I, Cahalan MD. The CRAC channel consists of a tetramer formed by Stim-induced dimerization of Orai dimers. Nature. 2008;456:116–120. doi: 10.1038/nature07338. [DOI] [PMC free article] [PubMed] [Google Scholar]
- 25.Pua HH, Dzhagalov I, Chuck M, Mizushima N, He YW. A critical role for the autophagy gene Atg5 in T cell survival and proliferation. Journal of Experimental Medicine. 2007;204:25–31. doi: 10.1084/jem.20061303. [DOI] [PMC free article] [PubMed] [Google Scholar]
- 26.Pua HH, Guo J, Komatsu M, He YW. Autophagy is essential for mitochondrial clearance in mature T lymphocytes. J Immunol. 2009;182:4046–4055. doi: 10.4049/jimmunol.0801143. [DOI] [PubMed] [Google Scholar]
- 27.Pua HH, He YW. Maintaining T lymphocyte homeostasis: another duty of autophagy. Autophagy. 2007;3:266–267. doi: 10.4161/auto.3908. [DOI] [PubMed] [Google Scholar]
- 28.Stephenson LM, Miller BC, Ng A, Eisenberg J, Zhao Z, Cadwell K, Graham DB, Mizushima NN, Xavier R, Virgin HW, Swat W. Identification of Atg5-dependent transcriptional changes and increases in mitochondrial mass in Atg5-deficient T lymphocytes. Autophagy. 2009;5:625–635. doi: 10.4161/auto.5.5.8133. [DOI] [PMC free article] [PubMed] [Google Scholar]
- 29.Pua HH, He YW. Mitophagy in the little lymphocytes: An essential role for autophagy in mitochondrial clearance in T lymphocytes. Autophagy. 2009;5:745–746. doi: 10.4161/auto.5.5.8702. [DOI] [PubMed] [Google Scholar]
- 30.Komatsu M, Waguri S, Ueno T, Iwata J, Murata S, Tanida I, Ezaki J, Mizushima N, Ohsumi Y, Uchiyama Y, Kominami E, Tanaka K, Chiba T. Impairment of starvation-induced and constitutive autophagy in Atg7-deficient mice. J Cell Biol. 2005;169:425–434. doi: 10.1083/jcb.200412022. [DOI] [PMC free article] [PubMed] [Google Scholar]
- 31.Hennet T, Hagen FK, Tabak LA, Marth JD. T-cell-specific deletion of a polypeptide N-acetylgalactosaminyl-transferase gene by site-directed recombination. Proc Natl Acad Sci U S A. 1995;92:12070–12074. doi: 10.1073/pnas.92.26.12070. [DOI] [PMC free article] [PubMed] [Google Scholar]
- 32.Franz S, Herrmann K, Furnrohr BG, Sheriff A, Frey B, Gaipl US, Voll RE, Kalden JR, Jack HM, Herrmann M. After shrinkage apoptotic cells expose internal membrane-derived epitopes on their plasma membranes. Cell Death Differ. 2007;14:733–742. doi: 10.1038/sj.cdd.4402066. [DOI] [PubMed] [Google Scholar]
- 33.Paemeleire K, Martin PE, Coleman SL, Fogarty KE, Carrington WA, Leybaert L, Tuft RA, Evans WH, Sanderson MJ. Intercellular calcium waves in HeLa cells expressing GFP-labeled connexin 43, 32, or 26. Mol Biol Cell. 2000;11:1815–1827. doi: 10.1091/mbc.11.5.1815. [DOI] [PMC free article] [PubMed] [Google Scholar]
- 34.Jackson MR, Nilsson T, Peterson PA. Retrieval of transmembrane proteins to the endoplasmic reticulum. J Cell Biol. 1993;121:317–333. doi: 10.1083/jcb.121.2.317. [DOI] [PMC free article] [PubMed] [Google Scholar]
- 35.Williams DB. Beyond lectins: the calnexin/calreticulin chaperone system of the endoplasmic reticulum. J Cell Sci. 2006;119:615–623. doi: 10.1242/jcs.02856. [DOI] [PubMed] [Google Scholar]
- 36.Lewis RS. Calcium signaling mechanisms in T lymphocytes. Annu Rev Immunol. 2001;19:497–521. doi: 10.1146/annurev.immunol.19.1.497. [DOI] [PubMed] [Google Scholar]
- 37.Sagara Y, Inesi G. Inhibition of the sarcoplasmic reticulum Ca2+ transport ATPase by thapsigargin at subnanomolar concentrations. J Biol Chem. 1991;266:13503–13506. [PubMed] [Google Scholar]
- 38.Mason MJ, Grinstein S. Ionomycin activates electrogenic Ca2+ influx in rat thymic lymphocytes. Biochem J. 1993;296(Pt 1):33–39. doi: 10.1042/bj2960033. [DOI] [PMC free article] [PubMed] [Google Scholar]
- 39.Morgan AJ, Jacob R. Ionomycin enhances Ca2+ influx by stimulating store-regulated cation entry and not by a direct action at the plasma membrane. Biochem J. 1994;300(Pt 3):665–672. doi: 10.1042/bj3000665. [DOI] [PMC free article] [PubMed] [Google Scholar]
- 40.Jones RG, Bui T, White C, Madesh M, Krawczyk CM, Lindsten T, Hawkins BJ, Kubek S, Frauwirth KA, Wang YL, Conway SJ, Roderick HL, Bootman MD, Shen H, Foskett JK, Thompson CB. The proapoptotic factors Bax and Bak regulate T Cell proliferation through control of endoplasmic reticulum Ca(2+) homeostasis. Immunity. 2007;27:268–280. doi: 10.1016/j.immuni.2007.05.023. [DOI] [PMC free article] [PubMed] [Google Scholar]
- 41.Rong YP, Aromolaran AS, Bultynck G, Zhong F, Li X, McColl K, Matsuyama S, Herlitze S, Roderick HL, Bootman MD, Mignery GA, Parys JB, De Smedt H, Distelhorst CW. Targeting Bcl-2-IP3 receptor interaction to reverse Bcl-2’s inhibition of apoptotic calcium signals. Mol Cell. 2008;31:255–265. doi: 10.1016/j.molcel.2008.06.014. [DOI] [PMC free article] [PubMed] [Google Scholar]
- 42.Hoyer-Hansen M, Bastholm L, Szyniarowski P, Campanella M, Szabadkai G, Farkas T, Bianchi K, Fehrenbacher N, Elling F, Rizzuto R, Mathiasen IS, Jaattela M. Control of macroautophagy by calcium, calmodulin-dependent kinase kinase-beta, and Bcl-2. Mol Cell. 2007;25:193–205. doi: 10.1016/j.molcel.2006.12.009. [DOI] [PubMed] [Google Scholar]
- 43.Hoth M, Fanger CM, Lewis RS. Mitochondrial regulation of store-operated calcium signaling in T lymphocytes. J Cell Biol. 1997;137:633–648. doi: 10.1083/jcb.137.3.633. [DOI] [PMC free article] [PubMed] [Google Scholar]
- 44.Quintana A, Schwarz EC, Schwindling C, Lipp P, Kaestner L, Hoth M. Sustained activity of calcium release-activated calcium channels requires translocation of mitochondria to the plasma membrane. J Biol Chem. 2006;281:40302–40309. doi: 10.1074/jbc.M607896200. [DOI] [PubMed] [Google Scholar]
- 45.Bogeski I, Kummerow C, Al-Ansary D, Schwarz EC, Koehler R, Kozai D, Takahashi N, Peinelt C, Griesemer D, Bozem M, Mori Y, Hoth M, Niemeyer BA. Differential redox regulation of ORAI ion channels: a mechanism to tune cellular calcium signaling. Sci Signal. 3:ra24. doi: 10.1126/scisignal.2000672. [DOI] [PubMed] [Google Scholar]
Associated Data
This section collects any data citations, data availability statements, or supplementary materials included in this article.