Abstract
Background
Aortic valve calcification is believed to involve the differentiation of valvular interstitial cells (VICs) into either a myofibroblastic or an osteoblast-like phenotype. Despite purported similarities between diseased VICs and osteoblasts, few studies have directly compared VICs and osteoblasts in side-by-side experiments. The present work compares VICs against multiple osteoblastic cell types at different stages of differentiation, and may also help to resolve whether VICs progress through a myofibroblastic phenotype prior to reaching an osteoblast-like stage.
Methods
Three cell types representing a range of osteoblastic lineage commitment and differentiation were used in the phenotypic comparison against VICs. Specifically, VICs, embryonic fibroblasts (C3H10T1/2), pre-osteoblasts (MC3T3-E1), and mature primary osteoblasts were cultured on tissue culture polystyrene in control or mineralization medium, and were harvested for qPCR, DNA, and protein analysis at time points ranging from 1–8 days.
Results
Culture of VICs in mineralization medium decreased expression of alpha-smooth muscle actin (α-SMA), a myofibroblast marker, with no peak in α-SMA gene or protein expression in mineralization medium at any time point. Application of mineralization medium led to increased expression levels of alkaline phosphatase (ALP), an early mineralization marker, for all cell types, although the magnitude of the increase in ALP was drastically smaller for VICs than for the osteogenic cell types. Only the osteogenic cell types demonstrated an appreciable increase in osteocalcin, an indicator of later-stage mineralization.
Conclusion
While the addition of mineralization medium generally increased the expression of osteogenic markers and decreased the expression of myofibroblastic markers, VICs displayed different levels and patterns of expression than the osteoblastic cell types used for comparison. Additionally, the lack of an α-SMA increase at any point after the addition of mineralization medium to VICs indicated that VICs may not need to progress through a myofibroblastic stage before reaching an osteoblast-like gene expression profile.
Keywords: valvular interstitial cell, osteoblast, myofibroblast, gene expression
Introduction
Aortic valve calcification is the primary cause of heart valve failure, yet its mechanisms are not completely understood. The valvular interstitial cell (VIC), the predominant cell type present in the heart valve, is a fibroblast-like cell type thought to be responsible for both valvular remodeling as well as calcification (1, 2). VICs are believed to progress toward calcification by differentiating to express either a myofibroblastic or an osteoblast-like phenotype (3, 4). Both the activated, myofibroblastic VICs (aVICs) and the osteoblast-like VICs (obVICs) are characterized by specific phenotypic markers. The hallmark feature of aVICs is considered to be alpha-smooth muscle actin (α-SMA) expression (4). The obVICs are characterized by markers that indicate osteoblastic differentiation, which include alkaline phosphatase (ALP), osteopontin (OPN), bone sialoprotein (BSP), bone morphogenetic proteins-2 and -4 (BMP-2 and -4), as well as osteocalcin (OCN) (4, 5). However, although obVICs are described as “osteoblast-like” and are characterized by markers of osteoblastic differentiation, it is unknown exactly how similar obVICs and osteoblasts are to each other, and few studies have directly compared VICs and osteoblasts in side-by-side experiments (6, 7). Moreover, the time-dependent sequence of events that occur in VIC differentiation is not well understood, and it is unclear if VICs must pass through an aVIC phenotype before reaching the obVIC stage.
Most of the groups that have investigated the osteoblastic properties of VICs have not directly compared VICs against osteoblasts, instead comparing osteoblastic traits across populations consisting of valve cells exposed to different culture conditions (8, 9). Among the obstacles to determining whether obVICs resemble true osteoblasts are the significant temporal variations in gene expression that occur during cellular differentiation. Thus, achieving an accurate comparison of VICs against osteoblastic cell types necessitates the quantification of cell phenotype at numerous time points, in contrast to the more common practice of measuring gene expression at only a single end-point. Accurately comparing VICs and osteoblasts is further complicated by the fact that VICs, a heterogeneous cell population, have been found to contain mesenchymal and osteogenic progenitor cells (10). Due to this progenitor population within VICs, obVICs may range from being immature to relatively advanced in their osteoblastic expression.
Thus, in the current work, the myofibroblastic and osteogenic differentiation of VICs was compared against the phenotype of three osteogenic cell types at multiple time points. Listed in order of increasing differentiation commitment, the osteogenic cell types examined herein were: embryonic fibroblasts (C3H10T1/2), pre-osteoblasts (MC3T3-E1), and primary mature osteoblasts. By performing a quantitative time-course analysis of key phenotypic markers during the differentiation of VICs and three cell types representing different stages of osteogenic lineage commitment, the current study addresses: 1) whether the phenotypic changes that occur in the differentiation of VICs to obVICs mimic the phenotypic changes observed during true osteogenesis, 2) whether obVICs phenotypically resemble osteoblasts or osteoblast precursor cells, and 3) whether VICs transition through an aVIC phenotype before becoming obVICs. Characterizing the differentiation potential of VICs and the phenotypic profiles of diseased VICs is anticipated to aid in better understanding the role of this heterogeneous cell population in valvular calcification and its response to potential interventions.
Methods
All reagents were obtained from Sigma-Aldrich (St. Louis, MO) unless otherwise noted. Raw data were analyzed via ANOVA with a Tukey’s HSD post-test, and p values <0.05 were considered statistically significant. All data are presented as mean ± standard deviation.
Cell culture
All cultures were refed with fresh medium every 48 hours.
VICs
Valvular interstitial cells (VICs) were isolated from porcine aortic valves (Hormel, Inc., Austin, MN) by collagenase digestion and cultured as previously described (11). VICs (P2–P4) were seeded onto tissue culture polystyrene plates at a density of 50,000 cells/cm2 and cultured in either control medium (M199, 1% fetal bovine serum (FBS, HyClone, Logan, UT), 100 U/mL penicillin (HyClone), 100 μg/mL streptomycin (HyClone), 2 mM L-Glutamine (HyClone)) or mineralization medium (M199, 10% FBS, 100 U/mL penicillin, 100 μg/mL streptomycin, 2 mM L-Glutamine, 10 mM β-glycerophosphate and 50 μg/mL ascorbic acid). The addition of ascorbic acid and β-glycerophosphate in osteogenic differentiation medium has been described previously for multiple cell types (12, 13).
C3H10T1/2, Clone 8
C3H10T1/2 cells (murine embryonic fibroblasts, American Type Culture Collection, Manassas, VA, ATCC CCL-226) (14, 15), were seeded onto tissue culture polystyrene plates at 50,000 cells/cm2 and cultured in either control medium (α-MEM (Invitrogen, Carlsbad, CA), 10% FBS, 100 U/mL penicillin, 100 μg/mL streptomycin) or mineralization medium (control medium supplemented with 10 mM β-glycerophosphate and 50 μg/mL ascorbic acid).
MC3T3-E1, Subclone 4
MC3T3-E1 cells (murine pre-osteoblasts, ATCC CRL-2593) (16), were seeded and cultured as described above for C3H10T1/2 cells.
Primary osteoblasts
Osteoblasts were isolated from adult mouse calvariae as described previously (17) and were cultured in mineralization medium (α-MEM, 10% FBS, 100 U/mL penicillin, 100 μg/mL streptomycin, 10 mM β-glycerophosphate and 50 μg/mL ascorbic acid).
Quantitative polymerase chain reaction (qPCR)
VICs, C3H10T1/2 cells, and MC3T3-E1 cells were cultured in either control or mineralization medium for 8 days. On each day of the experiment, 4–6 wells per condition were harvested for qPCR analysis via addition of TRI Reagent. Primary osteoblasts were cultured in mineralization medium and were lysed in TRI Reagent on Day 5 of culture. RNA from all conditions was isolated according to the TRI Reagent protocol and DNAse-treated with 1 μL Turbo DNAse (Ambion, Austin, TX). RNA (200 ng) from each sample was reverse-transcribed with the High Capacity cDNA Reverse Transcription Kit (Applied Biosystems, Carlsbad, CA), with thermal cycling at 25°C for 10 minutes, 37°C for 120 minutes, 85°C for 5 minutes, ending with 4°C. The samples were analyzed via qPCR (StepOnePlus Real-Time PCR System, Applied Biosystems) using TaqMan gene expression assays (Applied Biosystems) customized to detect the following genes: alpha-smooth muscle actin (α-SMA), alkaline phosphatase (ALP), and osteocalcin (OCN). The qPCR cycling conditions consisted of initial heating to 50°C for 2 minutes followed by 95°C for 10 minutes, and 40–42 cycles of denaturing at 95°C for 15 seconds followed by annealing at 60°C for 1 minute. Data were analyzed using the ΔΔCT method (18). All samples were initially normalized to glyceraldehyde 3-phosphate dehydrogenase (GAPDH) and subsequently normalized to the control VIC condition.
α-SMA ELISA
VICs, C3H10T1/2 cells, and MC3T3-E1 cells were cultured for 5 days in either control medium or mineralization medium. On Day 5, cells were fixed in 10% neutral buffered formalin and were assayed for α-SMA via quantitative immunocytochemical detection with monoclonal mouse anti-α-SMA (Clone 1A4, 7.5 μg/mL) and AlexaFluor 488-labeled goat-anti-mouse secondary antibody (Invitrogen, 2 μg/mL). The cells were counter-stained with 4′-6 diamidino-2-phenylindole (DAPI, 1 μg/mL). Fluorescence measurements were acquired using a Synergy HT plate reader (Biotek, Winooski, VT) to detect the α-SMA signal (485/528 nm ex/em), which was normalized to DAPI fluorescence (360/460 nm ex/em). Photomicrographs of the stained cells were also acquired in order to examine the organization and distribution of the α-SMA fibers (Olympus IX51).
ALP Assay
VICs, C3H10T1/2 cells, and MC3T3-E1 cells were cultured for 5 days in either control medium or mineralization medium. On Day 5, cells received lysis buffer (deionized water containing 6.3% glycerol (Thermo Scientific), 2% sodium dodecyl sulfate, 5% 1M Tris (pH 6.8), 5% phosphatase inhibitor cocktail (Boston Bioproducts, Worcester, MA), and 0.5% protease inhibitor III (Calbiochem, Gibbstown, NJ)). PNPP (P-nitrophenol phosphate, Thermo Scientific) was added to wells containing cell lysate or calf intestinal ALP standards (Promega Corporation, Madison, WI) for 30 minutes, the reaction was stopped with 2 N NaOH, and the sample absorbance at 405 nm was detected using a Synergy HT plate reader (Biotek). Sample absorbance values were converted to phosphatase activity Units after linear regression of the absorbance readings for the ALP standards.
DNA assay
VICs, C3H10T1/2 cells, and MC3T3-E1 cells were cultured for 3 days in either control medium or mineralization medium, with all conditions for all cell types in 10% FBS. Each day of the experiment, one set of samples was lysed in either MPER (Mammalian Protein Extraction Reagent, Thermo Scientific, Waltham, MA; applied to VICs and C3H10T1/2 cells) or radioimmunoprecipitation assay (RIPA) buffer (150 mmol/L NaCl, 1% NP-40, 0.5% deoxycholate, 0.1% SDS, 50 mmol/L Tris-HCl; applied to MC3T3-E1 cells), and cell number was quantified using the QuantIt PicoGreen assay kit (Invitrogen).
Results
Effect of osteogenic culture conditions on cell phenotype
α-SMA gene expression
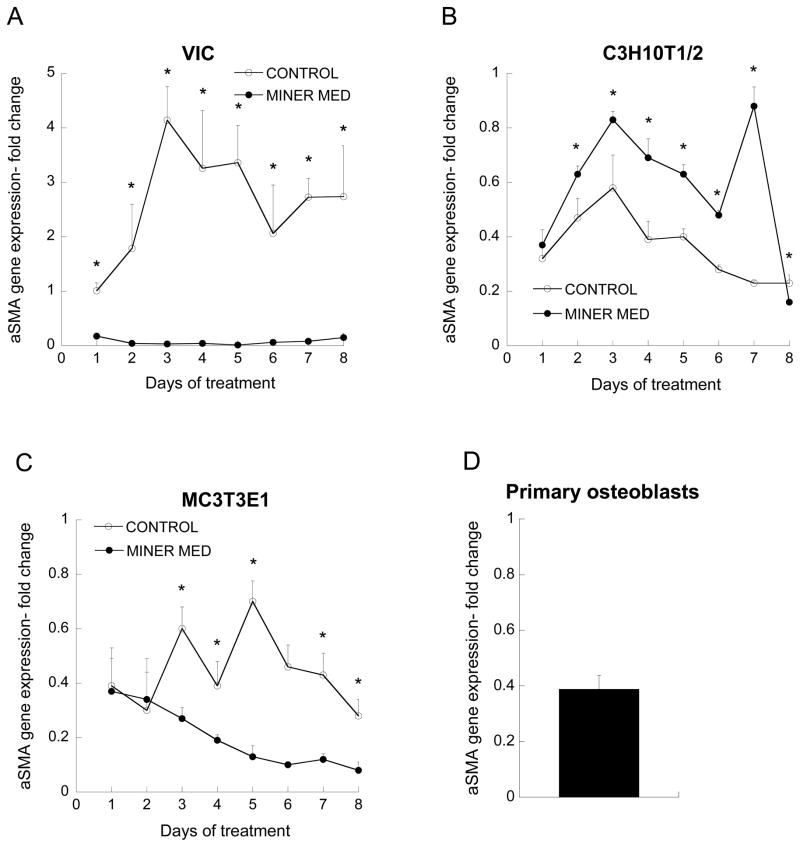
When control medium was applied to VICs, α-SMA expression was increased and remained elevated throughout the experiment, while mineralization medium led to α-SMA expression that was reduced below Day 1 levels (Figure 1a). Mineralization medium did not reduce α-SMA expression in C3H10T1/2 cells (Figure 1b); however, α-SMA expression was low, and never rose above the expression level of the control VIC culture on Day 1. Despite similarly low α-SMA expression by MC3T3-E1 cells, the application of mineralization medium did reduce α-SMA expression when compared to control medium, although the difference between the media conditions was not as striking as it was for VICs (Figure 1c). Primary mature osteoblasts exhibited α-SMA expression that was consistent with the range observed for both C3H10T1/2 and MC3T3-E1 cultures (Figure 1d).
Figure 1.
α-SMA gene expression. All values are expressed as fold-change relative to the VIC Day 1 control condition (*p<0.01 compared to paired condition on same day, n=3–6 per day per cell type).
ALP gene expression
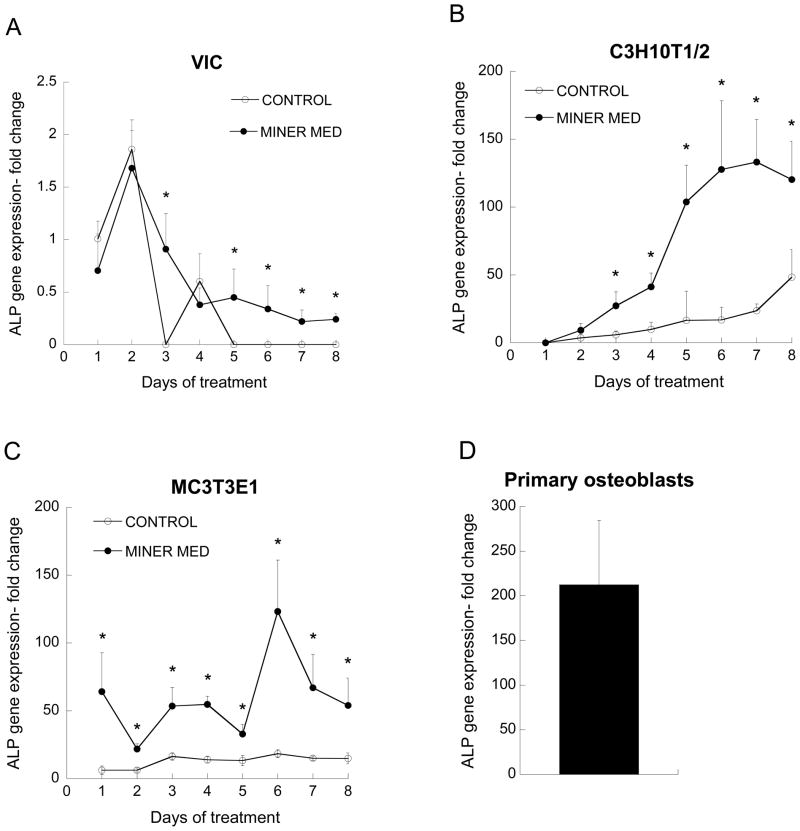
The application of mineralization medium resulted in elevated ALP expression for each cell type examined. After an initial peak on Day 2, ALP expression by VICs cultured in control medium decreased to undetectable levels, but remained elevated in VIC cultures receiving mineralization medium (Figure 2a). ALP expression by C3H10T1/2 cells was not detected on Day 1, but steadily rose over time for both the control and mineralization medium conditions (Figure 2b). Application of mineralization medium induced a more dramatic increase in ALP expression by C3H10T1/2 cells than control medium, with ALP expression ranging from 3–8 times the values obtained for untreated C3H10T1/2 cells at each time point. By Day 7, ALP expression by C3H10T1/2 cells peaked at a 120-fold increase relative to the Day 1 VIC control. MC3T3-E1 cells exhibited an immediate increase in ALP expression upon culture in mineralization medium, achieving values that fluctuated between roughly 50–100 times that of the untreated VIC control, and 3–10 times that of the untreated MC3T3-E1 condition (Figure 2c). Primary mature osteoblasts exhibited levels of ALP expression above any other cell type and more than 100 times the maximum level expressed by VICs (Figure 2d).
Figure 2.
ALP gene expression. All values are expressed as fold-change relative to the VIC Day 1 control condition (*p<0.01 compared to paired condition on same day; n=3–6 per day per cell type).
OCN gene expression
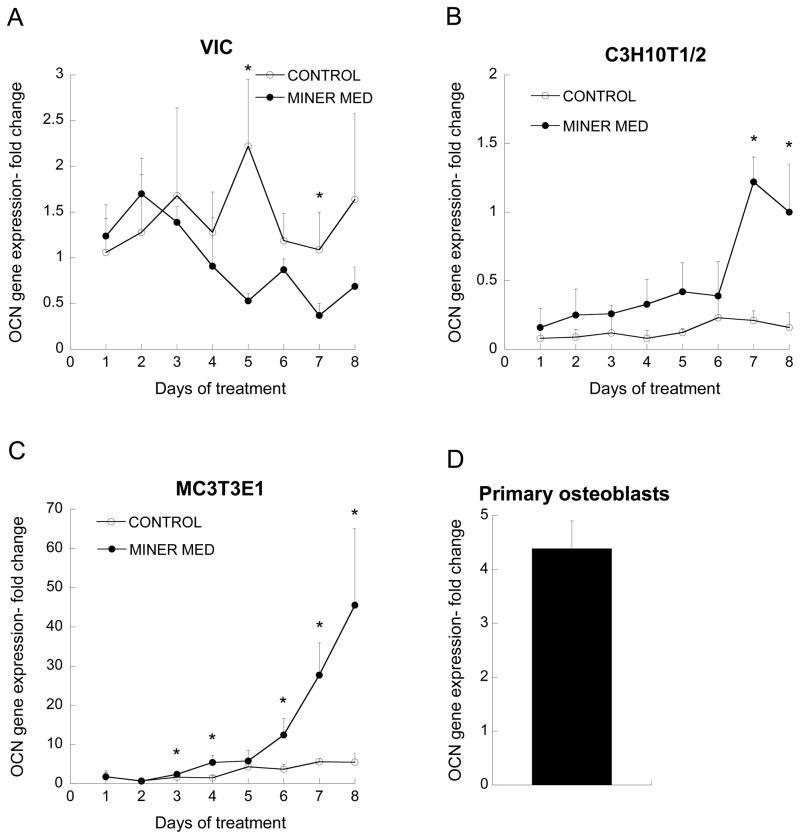
While no trend emerged for VIC expression of OCN (Figure 3a), both osteoblast precursor cell types experienced a significant elevation in OCN expression upon culture in mineralization medium relative to the corresponding control conditions (Figures 3b and 3c). Throughout the first 5 days of the experiment, OCN expression by C3H10T1/2 cells cultured in mineralization medium was slightly elevated relative to the control condition, but then commenced a rapid increase starting on Day 6 (Figure 3b). The most profound difference between control and mineralization medium conditions was seen for the MC3T3-E1 cells, which exhibited a sharp rise in OCN expression upon osteogenic treatment, reaching an OCN expression level that was 9 times that of untreated MC3T3-E1 cells at the same time point and 45 times that of VICs (Figure 3c). Expression of OCN by primary mature osteoblasts was higher than the maximum levels found for both VICs and C3H10T1/2 cells, but below the maximum level expressed by the MC3T3-E1 cells (Figure 3d).
Figure 3.
OCN gene expression. All values are expressed as fold-change relative to the VIC Day 1 control condition (*p<0.01 compared to paired condition on same day; n=3–6 per day per cell type).
α-SMA protein levels
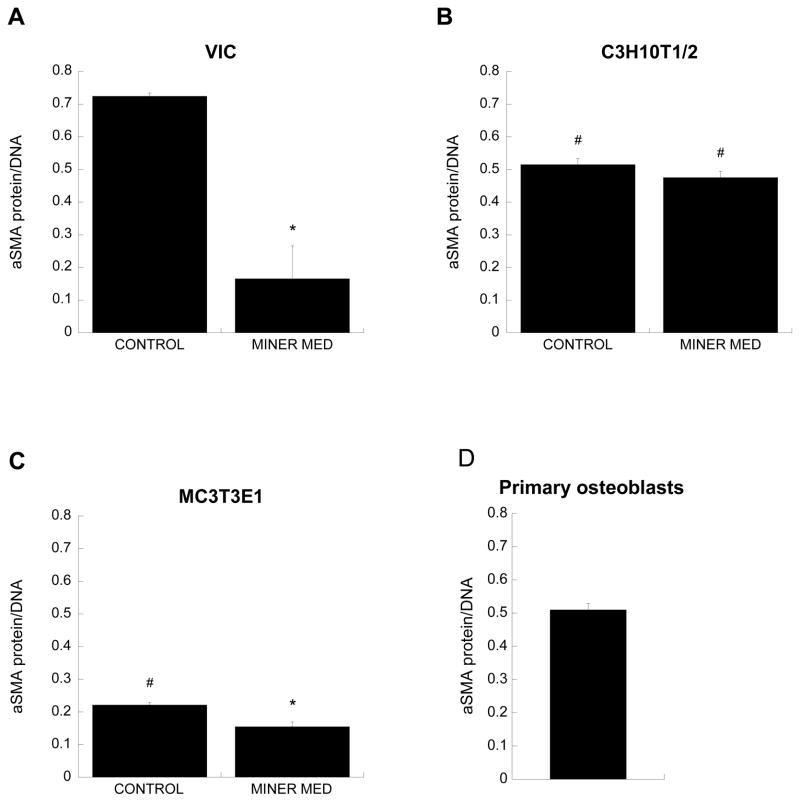
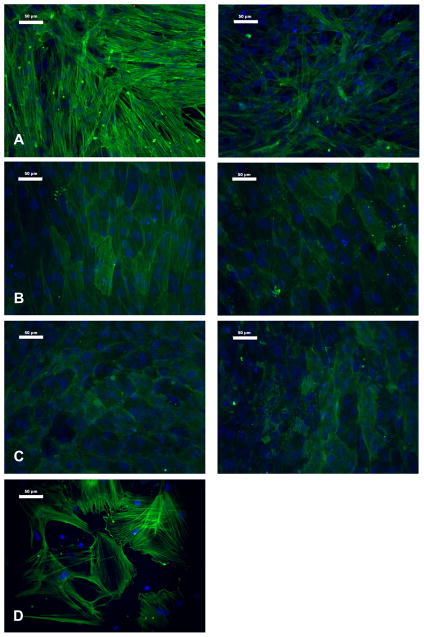
The trends in α-SMA protein levels in cell cultures on Day 5 (Figure 4) were consistent with the gene expression data (Figure 1), where in the application of mineralization medium decreased α-SMA levels in both VIC and MC3T3-E1 cultures relative to the corresponding control conditions. Also mirroring the gene expression results, the difference in α-SMA protein levels between mineralization medium and control medium was more pronounced in VICs than in MC3T3-E1 cells, and both C3H10T1/2 and MC3T3-E1 cells produced less α-SMA protein than VICs. Treatment with mineralization medium did not significantly affect α-SMA production by C3H10T1/2 cells (Figure 4b). These trends were also reflected in photomicrographs of α-SMA staining (Figure 5). Control VIC cultures stained strongly for α-SMA, which was arranged in distinct stress fibers, and the intensity of this staining decreased upon treatment with mineralization medium (Figure 5A). Meanwhile, all MC3T3-E1 and C3H10T1/2 cultures displayed weak and diffuse α-SMA staining (Figures 5B and 5C). The primary osteoblast culture was heterogeneous with respect to α-SMA expression (Figure 5D), with cells either exhibiting distinct α-SMA-positive fibers or not expressing any α-SMA at all; this finding is likely due to cells in this primary cell culture being in different stages of differentiation.
Figure 4.
α-SMA protein expression (*p<0.005 compared to paired condition on same day, #p<0.01 compared to VICs cultured in same culture medium; n=3 for each cell type).
Figure 5.
Immunocytochemical staining for α-SMA in cultures of A) VICs, B) C3H10T1/2 cells, C) MC3T3 cells, and D) primary osteoblasts. Panels on the left are cells cultured in control medium, and panels on the right are cells cultured in mineralization medium. Scale bar represents 50 μm.
ALP protein levels
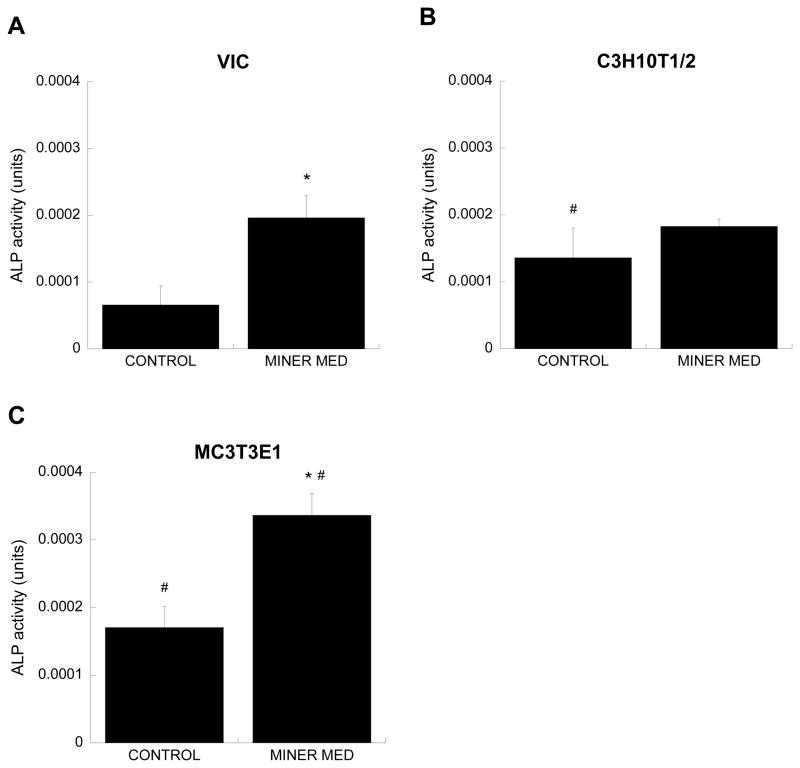
The trends in ALP production by the three cell types cultured in different media also mirrored the gene expression results obtained via qPCR analysis. The application of mineralization medium significantly increased ALP production by both VIC and MC3T3-E1 cultures relative to their respective control conditions (Figure 6), with the most pronounced difference between control and mineralization medium found in the MC3T3-E1 culture. The amount of ALP in C3H10T1/2 cultures had not significantly changed with application of mineralization medium at this Day 5 time point. Across the control conditions, ALP levels were higher in C3H10T1/2 and MC3T3-E1 cells relative to the VIC control condition, and a significantly greater amount of ALP was detected in MC3T3-E1 cultures treated with mineralization medium compared to the VIC mineralization medium condition.
Figure 6.
ALP protein expression, presented in phosphatase activity Units defined by ALP standards (* p<0.005 compared to untreated control, #p<0.05 compared to VICs cultured in same culture medium; n=3 for each cell type).
Effect of osteogenic culture condition on cell number
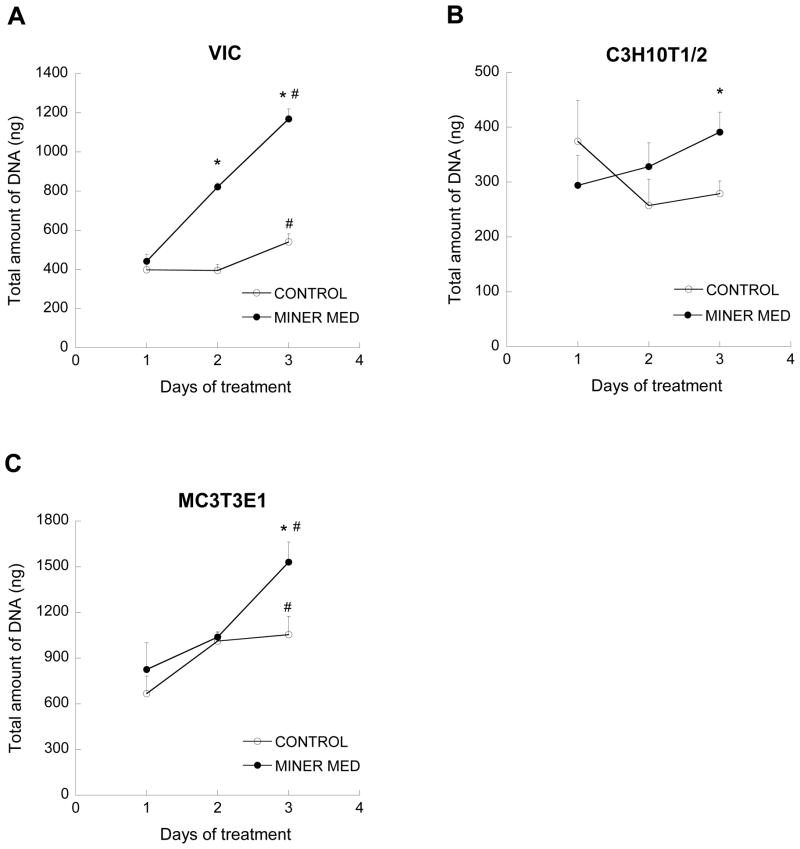
Culture of VICs in mineralization medium rapidly and significantly increased VIC cell number compared to culture in control medium (Figure 7a). Application of mineralization medium caused significantly higher DNA content than the untreated control on Day 3 of the experiment for both C3H10T1/2 cells (Figure 7b) and MC3T3-E1 cells (Figure 7c). The overall viability of cells in these culture conditions was also confirmed (Data Supplement, Figure S1).
Figure 7.
Amount of DNA in cell cultures. (*p<0.01, compared to untreated control on same day, #p<0.02 compared to Day 1 cells cultured in same culture medium; n=3 per day per cell type).
Discussion
Despite obVICs and true osteoblasts sharing the expression of similar phenotypic markers, there has been little research concentrated on validating if VICs can differentiate to become true osteoblasts or if they simply become “osteoblast-like” cells. Additionally, the sequence of phenotypic changes that accompanies osteoblastic VIC differentiation has not yet been fully described, although some studies have proposed that chronic activation of VICs precedes differentiation down the osteoblast lineage (19). A few studies have examined both VICs and osteoblasts (6, 7), but have not directly addressed the aforementioned question of whether VICs can differentiate to assume a true osteoblast phenotype. Although answering this question may appear straightforward, there exist many challenges intrinsic in directly comparing VICs against osteoblasts that prevent the generation of a simple answer to such a seemingly simple question. VIC populations may contain osteoprogenitor cells at different osteoblastic stages (in addition to myofibroblasts and quiescent VICs), so it is not sufficient to compare VICs against only a single type of osteoblastic cell. Moreover, the composition and phenotypic profiles of these VIC and osteoblast cultures change with time, meaning that analysis techniques must accommodate the study of multiple genes across numerous time points. In the current work, we addressed these challenges by performing a time-course quantification of select markers that are considered most indicative of myofibroblast and osteoblast activity across a spectrum of osteoblastic cell types. These cell types serve as an osteoblastic frame of reference, enabling an assessment of how VICs and obVICs fit into the spectrum of osteogenic cell types both in the presence and absence of osteogenic induction medium.
Culture of VICs in control medium led to a sustained elevation in α-SMA, which is consistent with the emergence of an aVIC phenotype that can spontaneously occur upon VIC culture on stiff tissue culture polystyrene substrates (8, 20). In addition to being the primary indicator of myofibroblast differentiation, changes in α-SMA have been found to accompany osteoblastic differentiation, as α-SMA expression by osteoblastic progenitor cells decreases as they differentiate toward osteoblasts (21, 22). This phenomenon was also seen in our cultures, as α-SMA expression in all cell types decreased with the application of mineralization medium. In VICs, the lack of an α-SMA peak before a mineralization medium-induced drop in α-SMA levels suggests that VICs progressed directly to an osteoblast-like phenotype without first passing through the aVIC phenotype. Moreover, VICs cultured in control medium expressed the highest levels of α-SMA mRNA and protein when compared to any of the osteoblastic cell types in either culture condition. This myofibroblastic potential of VICs may possibly highlight one fundamental difference between VICs and osteoblastic cell types.
Because no significant changes in apoptosis were observed across the conditions studied (Data Supplement, Figure S2), our investigation of VIC calcification focused upon ossific, rather than dystrophic, mechanisms. Thus, the acquisition of an osteoblastic phenotype upon culture of VICs and osteogenic cell types in control or osteogenic induction medium was assessed through quantification of expression of ALP and OCN, markers for early and late stages of mineralization, respectively. Application of mineralization medium had the expected effect on ALP expression for every cell type examined, elevating ALP levels when compared to culture in control medium. However, the magnitude of ALP expression varied with cell type, as did the pattern of expression over the course of the experiment. C3H10T1/2 cells, MC3T3-E1 cells, and primary osteoblasts all exhibited dramatically increased osteoblastic differentiation potential in comparison to VICs, with ALP values exceeding those expressed by VICs by over 50-fold. Furthermore, when comparing the effect of culture in osteogenic versus control medium within each cell type, the data also reveal that the average magnitude of ALP increase in response to osteogenic culture conditions was much greater for both C3H10T1/2 and MC3T3-E1 cells than it was for VICs. The temporal pattern of ALP expression also revealed cell type-specific trends in osteoblastic commitment. In contrast to the low, but sustained, elevation of ALP expression by VICs treated with mineralization medium, the multi-potent C3H10T1/2 cells responded to the osteogenic stimulus with a gradual, and then rapid increase in ALP, while the more committed pre-osteoblast MC3T3-E1 cells displayed an immediate jump in ALP expression in response to osteogenic medium. This immediate elevation in ALP mRNA expression by MC3T3-E1 cells was reflected by the results for ALP protein activity at Day 5. Meanwhile, the more gradual increase in ALP mRNA expression by C3H10T1/2 cells is likely the cause of the slight, but not significant, elevation in ALP activity at Day 5 for this cell type, as the increase in mRNA may not be reflected by changes in protein until a later time point.
VICs did not exhibit any discernible trend in OCN expression either with time or with osteogenic treatment, indicating that VIC cultures were not progressing toward an advanced stage of mineralization. Additionally, because OCN mRNA levels in VIC cultures were not high relative to the other cell types, it is not likely that VICs were somehow already at an advanced stage of mineralization. Although the overall level of OCN expression by C3H10T1/2 cells was low compared to that obtained in VIC cultures, the C3H10T1/2 cells responded much more dramatically to the application of mineralization medium. The pattern of OCN elevation observed with C3H10T1/2 cells would be expected of a cell type that has committed to the osteoblast lineage but not yet reached a mature osteoblastic phenotype. A more advanced osteoblastic differentiation pattern was observed in MC3T3-E1 cells, which have already been dedicated to the osteoblast lineage prior to treatment with osteogenic medium; OCN expression by these cells was elevated to approximately 50-fold that achieved by Day 1 VIC cultures and 8 times that achieved by MC3T3-E1 cells cultured in control medium. This behavior indicates that MC3T3-E1 cells were in the later stages of osteogenic differentiation by Day 8 of the experiment.
The data suggest that the overall population of undifferentiated, mature VICs falls between the embryonic fibroblasts (C3H10T1/2) and the pre-osteoblasts (MC3T3-E1) with respect to initial expression of an osteoblast phenotype, but that VICs do not possess the same potential as these other cell types to undergo robust osteogenesis upon treatment with standard mineralization medium, nor do they follow the expected osteogenic differentiation sequence. Because even the embryonic, multi-potent C3H10T1/2 cells demonstrated strong osteogenic differentiation over the course of this study, it is unlikely that the duration of the experiments was not sufficient to observe VIC differentiation. However, our findings do not rule out the possibility that perhaps more defined or aggressive stimuli (i.e., treatment with BMPs) are required for VICs to reach a state that more closely resembles true osteoblasts. Also, while myofibroblastic differentiation did not precede the osteoblast-like VIC phenotype obtained in our work, it is still possible that it could precede robust VIC osteogenesis, should that be successfully achieved via alternative stimuli. Another limitation of this work is that, although previous valve studies have also performed cross-species comparisons (6), the use of different cell sources may influence the findings. In general, however, the sequence of osteogenesis and the large increases in osteogenic marker expression by osteogenic cell types are features that do not appreciably differ across mammalian species (23, 24), and both murine and porcine animal models are sensitive to similar stimuli – for instance, atherogenic (25, 26) or Vitamin-D-rich diets (27, 28) – with respect to the induction of aortic valve disease.
Conclusion
This study examined gene expression profiles of VICs and compared them against several cell types in different stages of osteoblastic lineage commitment and differentiation. There were stark differences in both the level and pattern of gene expression between VICs and all of the osteoblastic cell types examined in this study. The differentiation and phenotype of VICs did not align with any of the osteoblastic cell types used, implying that VICs are not becoming true osteoblasts. Additionally, VICs did not exhibit increased α-SMA levels at any point after the application of mineralization medium, indicating that a myofibroblastic VIC phenotype does not necessarily precede VIC progression to an osteoblast-like phenotype. Although we cannot yet determine how these in vitro findings will translate to in vivo valve calcification phenomena, this study provides compelling evidence that the differentiation of VICs into obVICs significantly differs from the differentiation of osteoblast precursor cells into osteoblasts, and that obVICs obtained via treatment of cultures with mineralization medium are not equivalent to true osteoblasts.
Supplementary Material
Acknowledgments
Funding support for this work was provided by the NIH (R01 HL093281 to K.S.M.) and the Cardiovascular Training Program at the University of Wisconsin-Madison (NIH, T32 HL 007936-06 to E.L.M.).
References
- 1.Schoen FJ, Levy RJ. Calcification of tissue heart valve substitutes: progress toward understanding and prevention. Ann Thorac Surg. 2005;79:1072–1080. doi: 10.1016/j.athoracsur.2004.06.033. [DOI] [PubMed] [Google Scholar]
- 2.Mohler ER., 3rd Mechanisms of aortic valve calcification. Am J Cardiol. 2004;94:1396–1402. doi: 10.1016/j.amjcard.2004.08.013. [DOI] [PubMed] [Google Scholar]
- 3.Taylor PM, Batten P, Brand NJ, Thomas PS, Yacoub MH. The cardiac valve interstitial cell. Int J Biochem Cell Biol. 2003;35:113–118. doi: 10.1016/s1357-2725(02)00100-0. [DOI] [PubMed] [Google Scholar]
- 4.Liu AC, Joag VR, Gotlieb AI. The emerging role of valve interstitial cell phenotypes in regulating heart valve pathobiology. Am J Pathol. 2007;171:1407–1418. doi: 10.2353/ajpath.2007.070251. [DOI] [PMC free article] [PubMed] [Google Scholar]
- 5.Lian JB, Gundberg CM. Osteocalcin. Biochemical considerations and clinical applications. Clin Orthop Relat Res. 1988;226:267–291. [PubMed] [Google Scholar]
- 6.Wu B, Elmariah S, Kaplan FS, Cheng G, Mohler ER., 3rd Paradoxical effects of statins on aortic valve myofibroblasts and osteoblasts: implications for end-stage valvular heart disease. Arterioscl Throm Vas. 2005;25:592–597. doi: 10.1161/01.ATV.0000154278.01871.64. [DOI] [PubMed] [Google Scholar]
- 7.Chakraborty S, Cheek J, Sakthivel B, Aronow BJ, Yutzey KE. Shared gene expression profiles in developing heart valves and osteoblast progenitor cells. Physiol Genomics. 2008;35:75–85. doi: 10.1152/physiolgenomics.90212.2008. [DOI] [PMC free article] [PubMed] [Google Scholar]
- 8.Yip CY, Chen JH, Zhao R, Simmons CA. Calcification by valve interstitial cells is regulated by the stiffness of the extracellular matrix. Arterioscler Thromb Vasc Biol. 2009;29:936–942. doi: 10.1161/ATVBAHA.108.182394. [DOI] [PubMed] [Google Scholar]
- 9.Yang X, Fullerton DA, Su X, Ao L, Cleveland JC, Jr, Meng X. Pro-osteogenic phenotype of human aortic valve interstitial cells is associated with higher levels of Toll-like receptors 2 and 4 and enhanced expression of bone morphogenetic protein 2. J Am Coll Cardiol. 2009;53:491–500. doi: 10.1016/j.jacc.2008.09.052. [DOI] [PubMed] [Google Scholar]
- 10.Chen JH, Yip CY, Sone ED, Simmons CA. Identification and characterization of aortic valve mesenchymal progenitor cells with robust osteogenic calcification potential. Am J Pathol. 2009;174:1109–1119. doi: 10.2353/ajpath.2009.080750. [DOI] [PMC free article] [PubMed] [Google Scholar]
- 11.Johnson CM, Hanson MN, Helgeson SC. Porcine cardiac valvular subendothelial cells in culture: cell isolation and growth characteristics. J Mol Cell Cardiol. 1987;19:1185–1193. doi: 10.1016/s0022-2828(87)80529-1. [DOI] [PubMed] [Google Scholar]
- 12.Alfieri CM, Cheek J, Chakraborty S, Yutzey KE. Wnt signaling in heart valve development and osteogenic gene induction. Dev Biol. 2009;338:127–135. doi: 10.1016/j.ydbio.2009.11.030. [DOI] [PMC free article] [PubMed] [Google Scholar]
- 13.Seth A, Lee BK, Qi S, Vary CP. Coordinate expression of novel genes during osteoblast differentiation. J Bone Miner Res. 2000;15:1683–1696. doi: 10.1359/jbmr.2000.15.9.1683. [DOI] [PubMed] [Google Scholar]
- 14.Reznikoff CA, Bertram JS, Brankow DW, Heidelberger C. Quantitative and qualitative studies of chemical transformation of cloned C3H mouse embryo cells sensitive to post confluence inhibition of cell division. Cancer Res. 1973;33:3239–3249. [PubMed] [Google Scholar]
- 15.Reznikoff CA, Brankow DW, Heidelberger C. Establishment and characterization of a cloned line of C3H mouse embryo cells sensitive to post confluence inhibition of division. Cancer Res. 1973;33:3231–3238. [PubMed] [Google Scholar]
- 16.Wang D, Christensen K, Chawla K, Xiao G, Krebsbach PH, Franceschi RT. Isolation and characterization of MC3T3-E1 preosteoblast subclones with distinct in vitro and in vivo differentiation/mineralization potential. J Bone Miner Res. 1999;14:893–903. doi: 10.1359/jbmr.1999.14.6.893. [DOI] [PubMed] [Google Scholar]
- 17.Bakker A, Klein-Nulend J. Osteoblast isolation from murine calvariae and long bones. Methods Mol Med. 2003;80:19–28. doi: 10.1385/1-59259-366-6:19. [DOI] [PubMed] [Google Scholar]
- 18.Schmittgen TD, Livak KJ. Analyzing real-time PCR data by the comparative C(T) method. Nat Protoc. 2008;3:1101–1108. doi: 10.1038/nprot.2008.73. [DOI] [PubMed] [Google Scholar]
- 19.Benton JA, Kern HB, Leinwand LA, Mariner PD, Anseth KS. Statins block calcific nodule formation of valvular interstitial cells by inhibiting alpha-smooth muscle actin expression. Arterioscler Thromb Vasc Biol. 2009;29:1950–1957. doi: 10.1161/ATVBAHA.109.195271. [DOI] [PMC free article] [PubMed] [Google Scholar]
- 20.Rodriguez KJ, Masters KS. Regulation of valvular interstitial cell calcification by components of the extracellular matrix. J Biomed Mater Res A. 2009;90:1043–1053. doi: 10.1002/jbm.a.32187. [DOI] [PMC free article] [PubMed] [Google Scholar]
- 21.Kalajzic I, Kalajzic Z, Wang L, Jiang X, Lamothe K, San Miguel SM, et al. Pericyte/myofibroblast phenotype of osteoprogenitor cell. J Musculoskelet Neuronal Interact. 2007;7:320–322. [PubMed] [Google Scholar]
- 22.Kalajzic Z, Li H, Wang LP, Jiang X, Lamothe K, Adams DJ, et al. Use of an alpha-smooth muscle actin GFP reporter to identify an osteoprogenitor population. Bone. 2008;43:501–510. doi: 10.1016/j.bone.2008.04.023. [DOI] [PMC free article] [PubMed] [Google Scholar]
- 23.Goldstein DJ, Rogers CE, Harris H. Expression of alkaline phosphatase loci in mammalian tissues. Proc Natl Acad Sci U S A. 1980;77:2857–2860. doi: 10.1073/pnas.77.5.2857. [DOI] [PMC free article] [PubMed] [Google Scholar]
- 24.Pinto JP, Ohresser MC, Cancela ML. Cloning of the bone Gla protein gene from the teleost fish Sparus aurata. Evidence for overall conservation in gene organization and bone-specific expression from fish to man. Gene. 2001;270:77–91. doi: 10.1016/s0378-1119(01)00426-7. [DOI] [PubMed] [Google Scholar]
- 25.Aikawa E, Nahrendorf M, Sosnovik D, Lok VM, Jaffer FA, Aikawa M, et al. Multimodality molecular imaging identifies proteolytic and osteogenic activities in early aortic valve disease. Circulation. 2007;115:377–386. doi: 10.1161/CIRCULATIONAHA.106.654913. [DOI] [PubMed] [Google Scholar]
- 26.Pho M, Lee W, Watt DR, Laschinger C, Simmons CA, McCulloch CA. Cofilin is a marker of myofibroblast differentiation in cells from porcine aortic cardiac valves. Am J Physiol Heart Circ Physiol. 2008;294:H1767–1778. doi: 10.1152/ajpheart.01305.2007. [DOI] [PubMed] [Google Scholar]
- 27.Taura S, Taura M, Imai H, Kummerow FA, Tokuyasu K, Cho SB. Ultrastructure of cardiovascular lesions induced by hypervitaminosis D and its withdrawal. Paroi Arterielle. 1978;4:245–259. [PubMed] [Google Scholar]
- 28.Taura S, Taura M, Kamio A, Kummerow FA. Vitamin D-induced coronary atherosclerosis in normolipemic swine: comparison with human disease. Tohoku J Exp Med. 1979;129:9–16. doi: 10.1620/tjem.129.9. [DOI] [PubMed] [Google Scholar]
Associated Data
This section collects any data citations, data availability statements, or supplementary materials included in this article.


