Abstract
Quantitative magnetization transfer imaging yields indices describing the interactions between free water protons and immobile, macromolecular protons—including the macromolecular to free pool size ratio (PSR) and the rate of magnetization transfer between pools kmf. This study describes the first implementation of the selective inversion recovery quantitative magnetization transfer method on a clinical 3.0-T scanner in human brain in vivo. Selective inversion recovery data were acquired at 16 different inversion times in nine healthy subjects and two patients with relapsing remitting multiple sclerosis. Data were collected using a fast spin-echo readout and reduced repetition time, resulting in an acquisition time of 4 min for a single slice. In healthy subjects, excellent intersubject and intrasubject reproducibilities (assessed via repeated measures) were demonstrated. Furthermore, PSR values in white (mean ± SD = 11.4 ± 1.2%) and gray matter (7.5 ± 0.7%) were consistent with previously reported values, while kmf values were approximately 2-fold slower in both white (11 ± 2 s−1) and gray matter (15 ± 6 s−1). In relapsing remitting multiple sclerosis patients, quantitative magnetization transfer indices were sensitive to pathological changes in lesions and in normal appearing white matter.
Keywords: magnetization transfer, selective inversion recovery, multiple sclerosis, brain, myelin
INTRODUCTION
Magnetization transfer (MT) imaging provides contrast that is sensitive to interactions between free water protons and immobile macromolecular protons (1). The magnitude of the MT effect is commonly characterized via the MT ratio (MTR), a measure that has been shown to correlate with myelin content (2). Given this correlation, MTR imaging has been used to characterize white matter (WM) degeneration in multiple sclerosis (MS) (3–8) and neuropsychiatric diseases (9–11). Unfortunately, the MTR is also sensitive to nonphysiological parameters [scanner hardware (12) and radiofrequency pulse parameters] and tissue relaxation times (13).
Quantitative MT (qMT) imaging (13,14) can alleviate these dependencies by delivering indices derived from a two-pool model of the MT effect—these include the ratio of the macromolecular to free pool size [pool size ratio (PSR)] and the rate of MT exchange kmf. Pulsed saturation qMT imaging (14,15) has received attention because it allows qMT data to be collected in clinically feasible acquisition times. Unfortunately, this approach suffers from (i) the need to acquire and coregister additional data (maps of ΔB0, B1, and T1), (ii) sensitivity to assumptions about the macromolecular proton lineshape, and (iii) complicated data analysis (6,14–18). In contrast, selective inversion recovery (SIR) (19–22) (i) allows for parameter estimation via analysis of transient data alone, (ii) yields parameters that are less sensitive to macromolecular pool lineshape assumptions, and (iii) is based on a straightforward biexponential model of inversion recovery data (similar to the approach described in Ref. 23). To date, this approach has been limited to studies in phantoms (20,21) and animal models (22,24,25) by its longer acquisition times.
In this study, SIR qMT imaging was implemented on a clinical 3.0-T scanner. In vivo data were collected from the brains of healthy controls and from patients with relapsing remitting MS (RRMS). To acquire these data in clinically feasible acquisition times, a fast spin echo readout (SIR-FSE) and reduced repetition time (TR) were employed (22). To assess the reproducibility of the technique, several of the healthy controls were scanned twice. Additional measurements were performed on crosslinked bovine serum albumin phantoms for validation purposes.
THEORY
Consider two pools—a free water pool (f) and macro-molecular (m) pool—in which MT can occur. Define unique equilibrium magnetizations (M0f and M0m) and spin–lattice relaxation rates (R1f and R1m) for each pool. The resulting recovery of the free pool longitudinal magnetization Mf(t) when there is no applied irradiation can be described by a biexponential function (19–22)
| [1] |
where
| [2] |
| [3] |
kfm is the MT rate from the free to the macromolecular pool, and kmf is the rate in the reverse direction.
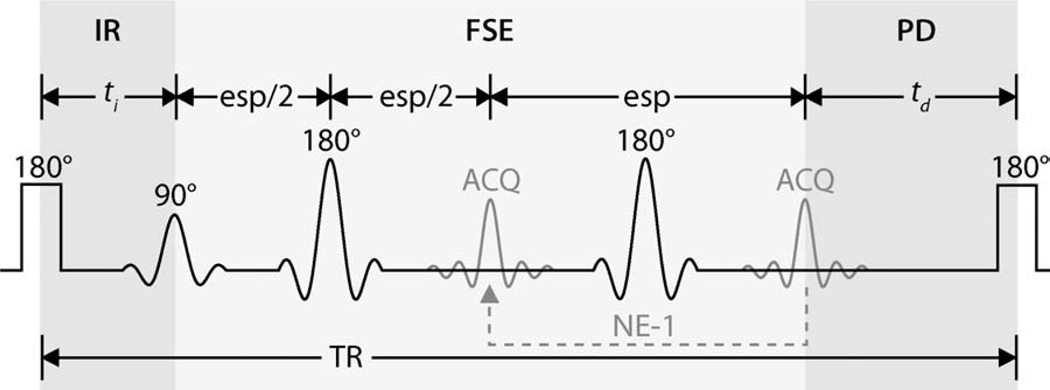
Signal equations for the SIR-FSE sequence (Fig. 1) can be generated from Eqs. 1–3. Previous numerical simulations (22) have shown that if the FSE train is sufficiently long, the longitudinal magnetizations of both pools are effectively zero at the end of this train. Using this as the initial condition, signal equations can be generated for the predelay period in Fig. 1. The ending values for this period can then be used as the initial condition for the inversion recovery period, taking account for the effect of the inversion pulse on each pool
| [4] |
| [5] |
where Sf is the inversion efficiency of the free pool, Sm accounts for the saturation of the macromolecular pool, and (or ) is the time just before (or after) the inversion pulse.
FIG. 1.
SIR pulse sequence with an FSE readout (SIR-FSE) and reduced TR. In this figure, ti is the inversion recovery (IR) time and td is the predelay (PD) time. A low-power inversion pulse (1-ms block pulse) inverts the free pool longitudinal magnetization, affecting the macromolecular pool to a lesser degree. The resulting observed recovery of free pool longitudinal magnetization can described by the biexponential function in Eq. 1. A total of 24 FSE echoes (NE) were acquired (ACQ) with an echo spacing (esp) of 5.9 ms during each TR period. Based on previous simulations (22), the longitudinal magnetization of both free and macromolecular pools can be assumed to be zero at the end of the FSE train. This assumption was used as the initial condition for the SIR-FSE signal equations (see Theory section for details).
This results in a model with seven independent parameters: R1m, R1f, Sm, Sf, M0f, kmf, and PSR = M0m/M0f = kfm/kmf. As is the case with pulsed saturation methods (14–16), the signal dependence on R1m for SIR data is weak (26). Therefore, R1m is set equal to R1f for fitting purposes. The parameter Sm can be numerically estimated for any given radiofrequency pulse, macromolecular pool lineshape, and T2m—Sm = 0.83 ± 0.07 for a 1-ms hard inversion pulse, Gaussian lineshape, and T2m = 10–20 µs (22,26). The remaining five parameters (R1f, Sf, M0f, kmf, and PSR) can be estimated by fitting SIR-FSE data to the derived signal equations, which are described in more detail in Ref. 26.
MATERIALS AND METHODS
Phantom Preparation
Bovine serum albumin (Sigma-Aldrich Corp., St. Louis, MO) phantoms of 10% and 15% (by mass) were prepared in distilled water. Phantoms were crosslinked with 5% glutaraldehyde (Electron Microscopy Sciences, Ft. Washington, PA) and centrifuged to remove bubbles.
Subjects
Nine healthy volunteers (27–35 years old, three males, six females) and two RRMS patients (52-year-old male, 43-year-old female) received an MRI as part of this study. To test reproducibility, four of the healthy volunteers were asked to undergo a second MRI at least 11 weeks after the first session. For the RRMS patients, diagnosis of disease status was made in the clinic prior to our examination. The study was approved by our local institutional review board, and signed consent was obtained prior to all examinations.
Data Acquisition
Imaging was performed using a 3.0-T, Philips Achieva whole-body MR scanner (Philips Healthcare, Best, The Netherlands). A quadrature body coil was used for excitation and a coil with eight head elements was used for signal reception.
Single-slice SIR-FSE data were acquired in each volunteer (parallel to AC–PC line) and bovine serum albumin phantom using the following parameters: inversion times (ti) logarithmically spaced between 10 ms and 2 s (15 values) and ti = 10 s, predelay time (td) = 2.5 s, block inversion pulse duration = 1 ms, number of echoes (NE) = 24, echo spacing (esp) = 5.9 ms, effective echo time (TE) = 74 ms, sensitivity encoding (SENSE) factor = 2, field-of-view = 212 × 212 mm2, in-plane resolution = 2.0 × 2.2 mm2, slice thickness = 5 mm, and number of signal acquisitions averaged = 2. This resulted in an acquisition time ≈4 min for a single slice.
In the RRMS patients and in one control, colocalized conventional double-echo T2-weighted (T2w: TE1/TE2/TR = 21/80/9250 ms), fluid-attenuated inversion recovery (FLAIR: TE/TI/TR = 100/2800/11,000 ms) and pulsed MT saturation data (TE/TR/α = 11.5 ms/64 ms/12°, 24-ms single-lobe sinc MT pulse with Gaussian apodization, offset frequency Δω = 1.5 kHz, nominal flip angle = 1000°) were also acquired to identify lesions.
Data Analysis
Data analysis was performed in MATLAB (MathWorks, Natick, MA). To determine qMT parameters, SIR-FSE data (normalized to ti = 10 s data) from each voxel were fit to a two-pool model of MT in a least-squares sense using a subspace trust-region method (27) (implemented with the lsqnonlin function in MATLAB). The five independent parameters X = {R1f, Sf, M0f, kmf, PSR} were fit with the following initial conditions (Xi), lower bounds (Xlb), and upper bounds (Xub): Xi = {1, −0.95, 1, 10, 0.1}, Xlb = {0.3, −1.05, 0.5, 0, 0}, and Xub = {2, −0.1, 2, 50, 0.3}. Monte Carlo simulations (results not shown) were performed to ensure that this algorithm uniquely converged to the correct solution over the range of expected qMT parameters in controls and RRMS patients.
In the RRMS patients and in one control, quantitative T2 (qT2) maps were generated from double-echo T2w data using the relationship
| [6] |
where S(TEi) is the singal at TEi. MTR maps were generated from the pulsed saturation data using the relationship
| [7] |
where S(Δω) is the signal in the presence of the MT saturation pulse and S0 is the signal in the absence of this pulse.
RESULTS
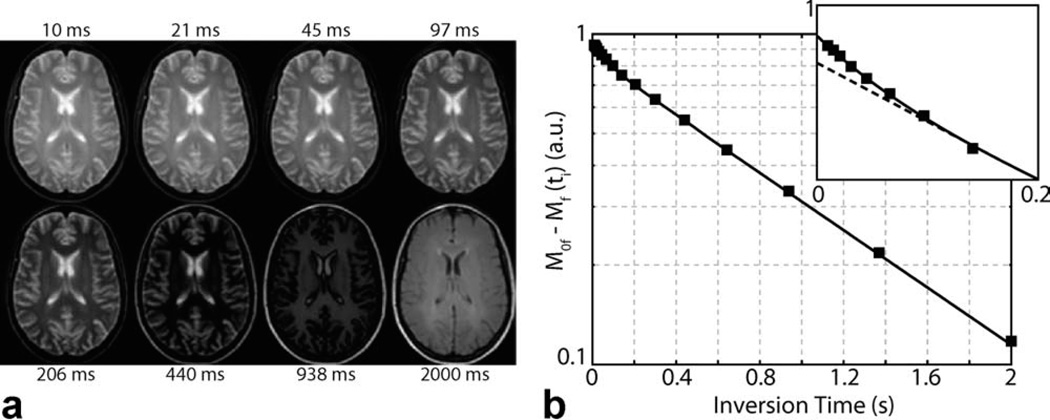
To validate our method, SIR-FSE data were acquired in bovine serum albumin phantoms. The resulting PSR values parameters in Table 1 were consistent with previously published values obtained at 2 T (21), while the kmf rates were roughly 30% slower. Figure 2 displays sample SIR-FSE images from a healthy control and a corresponding model fit from a single voxel in WM. Note the agreement between SIR data and the biexponential model in Eq. 1, and the deviation from a monoexponential model, which is especially evident at the shortest inversion times. Although biexponential fitting is a difficult numerical problem, reproducible results can be obtained with sufficient signal-to-noise ratio (SNR). SIR-FSE data had an SNR of 240 ± 110 across all voxels in healthy subjects (SNR is defined as M0f divided by the standard deviation of the residuals). Monte Carlo simulations (results not shown) indicated this was sufficient to robustly extract the parameters reported herein.
Table 1.
Mean ± SD Fit Parameters for ROIs (≈70 voxels) Defined in BSA Phantoms
| Sample | PSR (%) |
kmf (s−1) |
R1f (s−1) |
Sf |
|---|---|---|---|---|
| 10% BSA | 5.2 ± 0.3 | 29 ± 5 | 0.71 ± 0.01 | −0.93 ± 0.01 |
| 15% BSA | 9.1 ± 0.3 | 35 ± 3 | 0.78 ± 0.01 | −0.95 ± 0.01 |
FIG. 2.
Sample SIR-FSE images (a) and model fit (b) from a healthy control. a: Eight of the 16 inversion times are shown. b: Data from a representative WM voxel were subtracted from thermal equilibrium and plotted on a semilogarithmic plot to demonstrate the biexponential nature of SIR data, which is especially evident at the shortest inversion times (see zoomed inset). Note the agreement between the SIR data (black squares) and biexponential model (solid black line, Eq. 1) and the deviation from a monoexponential model (dashed black line).
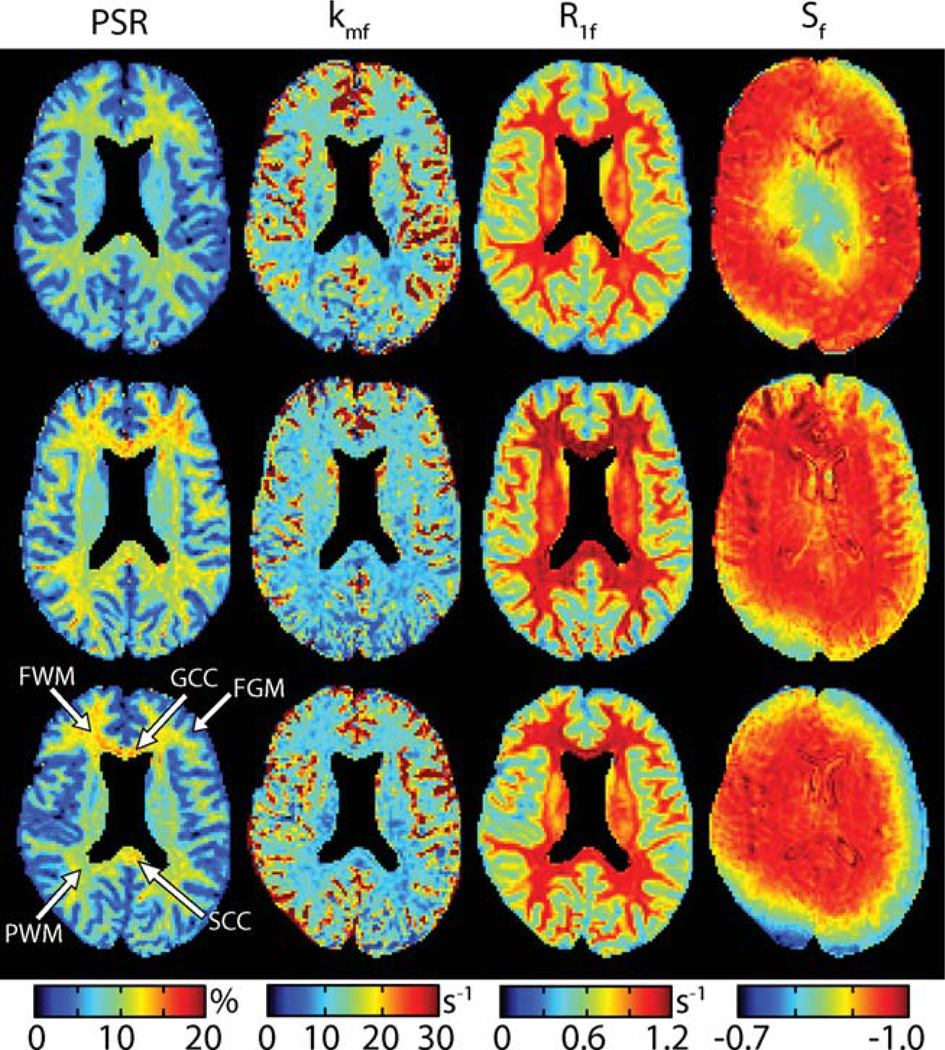
Based on these fits, maps of fit SIR-FSE parameters were generated (Fig. 3). Consistent results were found for all three qMT parameters (PSR, kmf, and R1f) across subjects, although it should be noted that the qMT parameters (especially kmf) were noisy in and around areas with cerebrospinal fluid. This consistency in qMT parameters was found regardless of the observed ΔB0 and/or B1 inhomogeneities as indicated by the intrasubject and intersubject variability in Sf. This suggests that SIR-FSE-derived qMT parameters are relatively insensitive to errors associated with DB0 and/or B1 inhomogeneities.
FIG. 3.
Parameter maps (PSR, kmf, R1f, and Sf from left to right) for three of the nine healthy controls (top to bottom). Note that the ventricles were masked in each of these images for display purposes. Consistent results were found for all three qMT parameters (PSR, kmf, and R1f) across subjects. This consistency was found in the presence ΔB0 and/or B1 inhomogeneities as indicated by the variability in Sf. For subsequent analysis (Fig. 4), ROIs were defined within several structures as shown in the lower left panel: genu of the corpus callosum (GCC), the splenium of the corpus callosum (SCC), parietal WM (PWM), frontal WM (FWM), and frontal GM (FGM).
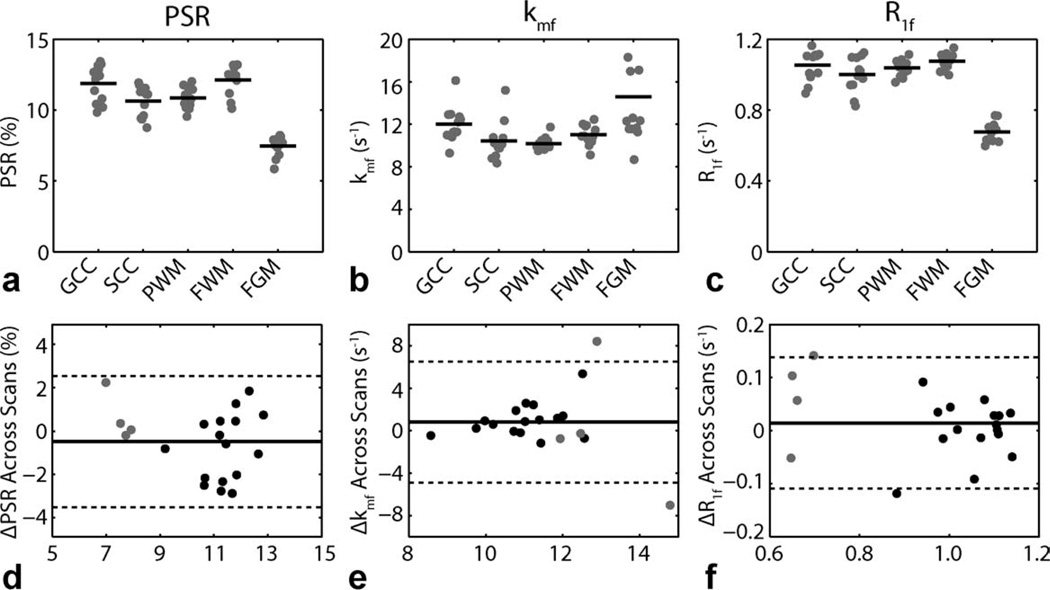
Regions-of-interest (ROIs) were defined as shown in the lower left panel of Fig. 3. Mean ROI qMT parameters tabulated for each of these regions in each of the nine healthy volunteers are given in the top row of Fig. 4—four subjects were scanned twice, yielding 13 total points. For PSR, note the contrast between WM (mean ± SD = 11.4 ± 1.2%) and gray matter (GM; 7.5 ± 0.7%) as well as the heterogeneity within WM. Wilcoxon rank-sum (Mann–Whitney) tests indicated significant differences (p < 0.05) between (i) WM and GM (p < 0.001), (ii) the genu and splenium of the corpus callosum (p = 0.026), (iii) the splenium of the corpus callosum and frontal WM (p = 0.029), and (iv) parietal and frontal WM (p = 0.004). These regional differences are postulated to reflect differences in myelin content. For kmf, note the slightly elevated exchange rate in GM (15 ± 6 s−1) relative to WM (11 ± 2 s−1), which is consistent with previous SIR studies in animal models (22). Furthermore, note the consistency in the kmf values across subjects, especially in WM. For R1f, contrast between WM (1.04 ± 0.08 s−1) and GM (0.68 ± 0.06 s−1) values were also observed; and these values were similar to previously reported (28) R1 values in human brain at 3 T.
FIG. 4.
ROI-based qMT parameters for the ROIs defined in Fig. 3. (top row) Mean ROI qMT parameters [PSR (a), kmf (b), R1f (c)] for each healthy volunteer (gray dot) as well as the mean across volunteers (black bar). Results from all 13 scans are shown (nine subjects, four scanned twice). Legend: genu of the corpus callosum (GCC), the splenium of the corpus callosum (SCC), parietal WM (PWM), frontal WM (FWM), and frontal GM (FGM). (bottom row) Bland–Altman plots of difference in qMT parameters [ΔPSR (d), Δkmf (e), ΔR1f (f)] for WM (black dots) and GM (gray dots) ROIs across scans. The solid lines represent the mean difference across scans for all ROIs, and the dashed lines represent the limits of agreement (mean difference ± 1.96 SD).
Four healthy subjects were scanned at two time points to study whether or not any bias in the reproducibility of the data existed. Bland–Altman plots of the difference in mean ROI qMT parameters between scans are shown in the bottom row of Fig. 4. No significant differences (p > 0.05, paired Student’s t-test) were found for the mean qMT parameters between scans (mean difference ± SD for PSR = −0.5 ± 1.6%, p = 0.41; kmf = 1 ± 3 s−1, p = 0.20; and R1f = 0.01 ± 0.06 s−1, p = 0.80), indicating that the mean values for the qMT parameters are reproducible. Additionally, the 95% confidence interval for the test–retest difference for each of the derived metrics overlaps zero [for PSR = (−1.2,0.2); kmf = (−1,2); and R1f = (−0.01,0.04)]; therefore, at the p = 0.05 level, no significance can be observed. Finally, the limits of agreement (mean difference ± 1.96 SD) for each of the derived metrics appear to be symmetric about zero; thus, no observable bias in the scans are observed.
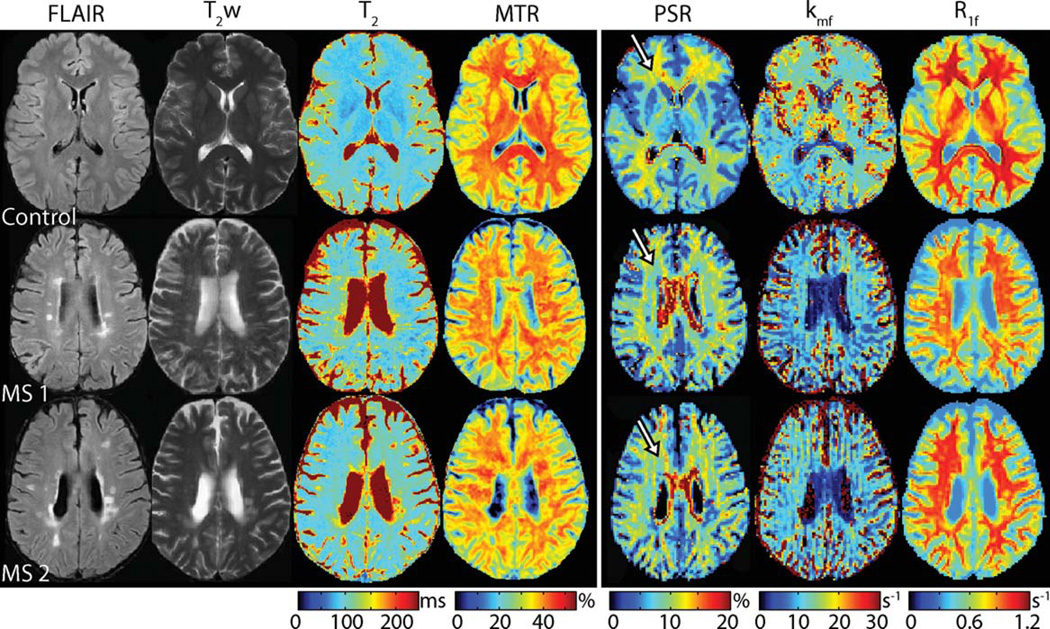
To demonstrate the clinical applicability of this technique, we studied two patients with RRMS. Figure 5 shows multiparametric images obtained from a healthy control and the two patients. Note the focal changes in all three qMT parameters within lesions identified via T2/FLAIR hyperintensities—PSR and R1f were lower, while kmf was lower within some lesions and higher within others. Comparing results to healthy controls, diffuse pallor in PSR, kmf, and R1f values were also observed throughout normal appearing WM.
FIG. 5.
Multiparametric clinical imaging data (FLAIR, T2w, T2, and MTR) and colocalized qMT parameter maps (PSR, kmf, and R1f) from a healthy control and two RRMS patients (top to bottom). Note the focal changes in all three qMT parameters within lesions identified in the conventional images. Furthermore, note the decrease in PSR, kmf, and R1f in RRMS patients relative to healthy controls in normal appearing WM. For example, a decrease in PSR is observed within periventricular FWM regions (see arrows) in MS patients (blue hues in PSR map) relative to the healthy control (yellow hues in PSR map).
DISCUSSION
This study demonstrates the feasibility of performing qMT measurements in the human brain in vivo using the SIR technique. Results in healthy controls (Figs. 3 and 4) demonstrate that SIR-derived qMT parameters can be extracted with a high level of intrasubject and intersubject reproducibility. Corresponding results in RRMS patients (Fig. 5) demonstrate that qMT parameters are sensitive to pathological changes in lesions as well as normal appearing WM, indicating that these parameters may contain quantitative information about tissue status not readily available via conventional imaging.
Previous pulsed saturation (14,17,28,29) and balanced steady-state free precession (30,31) qMT imaging studies have reported PSR values in the range of 11–16% and 5–9% for WM and GM structures, respectively. Our results (WM: 10–12%, GM: 8%) are consistent with these findings, although perhaps on the low end of this range for WM. For the SIR method, we recognize that the PSR values are sensitive to assumptions about the macromolecular pool lineshape and T2—these are used in the calculation of the saturation fraction Sm, which acts as a scaling factor for PSR. Herein, we modeled the macromolecular pool using a Gaussian lineshape (T2 = 10–20 µs) (22,26) because the Super-Lorentzian, which is thought to better describe tissue (32), exhibits an on-resonance singularity. One alternative is to extrapolate the Super-Lorentzian lineshape to zero from a given cut-off frequency. This approach (see Fig. 8 in Ref. 30 for details) yields an Sm = 0.65 for a 1-ms block inversion pulse and cut-off frequency of 1 kHz, and fitting SIR-FSE data from healthy controls using this Sm yields only slightly higher PSR values (WM: 12–14%, GM: 8%).
Reported MT rates in the literature have been less consistent. Generally speaking, pulsed saturation (14,17,28,29) and steady-state free precession (30,31) studies have reported kmf values (kmf = kf/F using the notation of Sled and Pike; Refs. 14,15) in the range of 20–40 s−1 across the brain. The SIR-derived kmf values reported herein are nearly 2-fold slower (10–15 s−1), which is roughly consistent with previous SIR studies of ferret brain at 9.4T (22). This discrepancy is not surprising, given the reported difficulty of using pulsed saturation to determine the MT rate (18,33). In fact, it could be argued that SIR yields a more direct measure of the MT rate as it can be shown that kmf ≈ (see Eq. 2) when kmf is much larger than any of the other rates (21,22).
The SIR method has several advantages over pulsed saturation. First, SIR qMT imaging does not require collection and coregistration of any additional data (ΔB0, B1, and T1). Second, SIR is relatively insensitive to macromolecular pool lineshape assumptions. As discussed above, large changes in assumptions only have a small effect on the absolute PSR values—the relative values are unaffected—and a negligible effect on the remaining parameters. Third, in contrast to the more complicated models needed to describe pulsed saturation data, SIR data can be analyzed using a straightforward biexponential model, which can potentially be implemented inline (at the time of acquisition) on most scanner software packages. Fourth, the SIR pulse sequence applies low-power radiofrequency pulses, typically resulting in a lower specific absorption rate (SAR) sequence compared to pulsed saturation sequences.
The most significant shortcoming of SIR-FSE is its long acquisition times. Compounding this, SIR-FSE does not allow for multislice imaging (although 3D approaches are feasible) as the refocusing pulses in the FSE train will cause MT effects in neighboring slices. Previous pulsed saturation and steady-state free precession qMT imaging studies have reported whole-brain coverage in ≈30 min. In its current form, only seven to eight slices of SIR-FSE data can be acquired in this time. For this approach to be of clinical utility, this must be improved through optimization. Li et al. (26) recently determined optimal schemes (in terms of precision efficiency) that varied both ti and td. Additionally, the SNR per unit time could be improved by optimizing the FSE readout. Herein, we used a linear (bottom-up) readout trajectory with an effective TE = 74 ms; however, a center-out trajectory could increase the SNR per unit time by approximately 3-fold (assuming an effective TE = 5.9 ms and T2 = 60–70 ms). This improved efficiency could be traded for increased resolution, decreased scan time, and/or increased volumetric coverage. Even with these improvements, pulsed saturation or steady-state free precession qMT imaging may be faster for high-resolution whole-brain qMT imaging; however, in cases where only limited coverage is needed, susceptibility differences are high, B1/ΔB0 inhomogeneities are great, and/or SAR is a limiting factor, SIR-FSE might be a better option. Given that many of these issues are more pronounced at higher magnetic field strengths, the SIR method is likely a better-suited approach for qMT imaging at ultra-high field strengths.
CONCLUSIONS
The results of this study demonstrate the feasibility of performing qMT imaging in human brain in vivo. In healthy subjects, intersubject and intrasubject reproducibilities were demonstrated. In RRMS patients, SIR-derived qMT parameters were sensitive to pathological changes in lesions and in normal appearing WM. Future work includes further refinement and optimization of SIR-FSE qMT imaging to allow for increased volumetric coverage and comparison of results across patient types.
ACKNOWLEDGMENTS
This work was supported in part by NIH/NIBIB (S.A.S., D.F.G.) and NIH (J.C.G.). We thank Subramaniam Sriram, Siddharama Pawate, Harold Moses, Sandy Watkins, and Jennifer Scott for patient referrals. We thank Robin Avison, Debbie Boner, Donna Butler, and Leslie McIntosh for their help with the data acquisition.
REFERENCES
- 1.Wolff SD, Balaban RS. Magnetization transfer contrast (MTC) and tissue water proton relaxation in vivo. Magn Reson Med. 1989;10:135–144. doi: 10.1002/mrm.1910100113. [DOI] [PubMed] [Google Scholar]
- 2.Odrobina EE, Lam TY, Pun T, Midha R, Stanisz GJ. MR properties of excised neural tissue following experimentally induced demyelination. NMR Biomed. 2005;18:277–284. doi: 10.1002/nbm.951. [DOI] [PubMed] [Google Scholar]
- 3.Gass A, Barker GJ, Kidd D, Thorpe JW, MacManus D, Brennan A, Tofts PS, Thompson AJ, McDonald WI, Miller DH. Correlation of magnetization transfer ratio with clinical disability in multiple sclerosis. Ann Neurol. 1994;36:62–67. doi: 10.1002/ana.410360113. [DOI] [PubMed] [Google Scholar]
- 4.Catalaa I, Grossman RI, Kolson DL, Udupa JK, Nyul LG, Wei L, Zhang X, Polansky M, Mannon LJ, McGowan JC. Multiple sclerosis: magnetization transfer histogram analysis of segmented normal-appearing white matter. Radiology. 2000;216:351–355. doi: 10.1148/radiology.216.2.r00au16351. [DOI] [PubMed] [Google Scholar]
- 5.Kalkers NF, Hintzen RQ, van Waesberghe JH, Lazeron RH, van Schijndel RA, Ader HJ, Polman CH, Barkhof F. Magnetization transfer histogram parameters reflect all dimensions of MS pathology, including atrophy. J Neurol Sci. 2001;184:155–162. doi: 10.1016/s0022-510x(01)00431-2. [DOI] [PubMed] [Google Scholar]
- 6.Yarnykh VL. Pulsed Z-spectroscopic imaging of cross-relaxation parameters in tissues for human MRI: theory and clinical applications. Magn Reson Med. 2002;47:929–939. doi: 10.1002/mrm.10120. [DOI] [PubMed] [Google Scholar]
- 7.Schmierer K, Scaravilli F, Altmann DR, Barker GJ, Miller DH. Magnetization transfer ratio and myelin in postmortem multiple sclerosis brain. Ann Neurol. 2004;56:407–415. doi: 10.1002/ana.20202. [DOI] [PubMed] [Google Scholar]
- 8.Filippi M, Rocca MA. Magnetization transfer magnetic resonance imaging in the assessment of neurological diseases. J Neuroimaging. 2004;14:303–313. doi: 10.1177/1051228404265708. [DOI] [PubMed] [Google Scholar]
- 9.Kabani NJ, Sled JG, Chertkow H. Magnetization transfer ratio in mild cognitive impairment and dementia of Alzheimer’s type. Neuroimage. 2002;15:604–610. doi: 10.1006/nimg.2001.0992. [DOI] [PubMed] [Google Scholar]
- 10.Kabani NJ, Sled JG, Shuper A, Chertkow H. Regional magnetization transfer ratio changes in mild cognitive impairment. Magn Reson Med. 2002;47:143–148. doi: 10.1002/mrm.10028. [DOI] [PubMed] [Google Scholar]
- 11.Bruno SD, Barker GJ, Cercignani M, Symms M, Ron MA. A study of bipolar disorder using magnetization transfer imaging and voxel-based morphometry. Brain. 2004;127(Pt 11):2433–2440. doi: 10.1093/brain/awh274. [DOI] [PubMed] [Google Scholar]
- 12.Berry I, Barker GJ, Barkhof F, Campi A, Dousset V, Franconi JM, Gass A, Schreiber W, Miller DH, Tofts PS. A multicenter measurement of magnetization transfer ratio in normal white matter. J Magn Reson Imaging. 1999;9:441–446. doi: 10.1002/(sici)1522-2586(199903)9:3<441::aid-jmri12>3.0.co;2-r. [DOI] [PubMed] [Google Scholar]
- 13.Henkelman RM, Huang X, Xiang QS, Stanisz GJ, Swanson SD, Bronskill MJ. Quantitative interpretation of magnetization transfer. Magn Reson Med. 1993;29:759–766. doi: 10.1002/mrm.1910290607. [DOI] [PubMed] [Google Scholar]
- 14.Sled JG, Pike GB. Quantitative imaging of magnetization transfer exchange and relaxation properties in vivo using MRI. Magn Reson Med. 2001;46:923–931. doi: 10.1002/mrm.1278. [DOI] [PubMed] [Google Scholar]
- 15.Sled JG, Pike GB. Quantitative interpretation of magnetization transfer in spoiled gradient echo MRI sequences. J Magn Reson. 2000;145:24–36. doi: 10.1006/jmre.2000.2059. [DOI] [PubMed] [Google Scholar]
- 16.Ramani A, Dalton C, Miller DH, Tofts PS, Barker GJ. Precise estimate of fundamental in-vivo MT parameters in human brain in clinically feasible times. Magn Reson Imaging. 2002;20:721–731. doi: 10.1016/s0730-725x(02)00598-2. [DOI] [PubMed] [Google Scholar]
- 17.Yarnykh VL, Yuan C. Cross-relaxation imaging reveals detailed anatomy of white matter fiber tracts in the human brain. Neuroimage. 2004;23:409–424. doi: 10.1016/j.neuroimage.2004.04.029. [DOI] [PubMed] [Google Scholar]
- 18.Portnoy S, Stanisz GJ. Modeling pulsed magnetization transfer. Magn Reson Med. 2007;58:144–155. doi: 10.1002/mrm.21244. [DOI] [PubMed] [Google Scholar]
- 19.Edzes HT, Samulski ET. Cross relaxation and spin diffusion in the proton NMR or hydrated collagen. Nature. 1977;265:521–523. doi: 10.1038/265521a0. [DOI] [PubMed] [Google Scholar]
- 20.Gochberg DF, Kennan RP, Gore JC. Quantitative studies of magnetization transfer by selective excitation and T1 recovery. Magn Reson Med. 1997;38:224–231. doi: 10.1002/mrm.1910380210. [DOI] [PubMed] [Google Scholar]
- 21.Gochberg DF, Gore JC. Quantitative imaging of magnetization transfer using an inversion recovery sequence. Magn Reson Med. 2003;49:501–505. doi: 10.1002/mrm.10386. [DOI] [PubMed] [Google Scholar]
- 22.Gochberg DF, Gore JC. Quantitative magnetization transfer imaging via selective inversion recovery with short repetition times. Magn Reson Med. 2007;57:437–441. doi: 10.1002/mrm.21143. [DOI] [PMC free article] [PubMed] [Google Scholar]
- 23.Ropele S, Seifert T, Enzinger C, Fazekas F. Method for quantitative imaging of the macromolecular 1H fraction in tissues. Magn Reson Med. 2003;49:864–871. doi: 10.1002/mrm.10427. [DOI] [PubMed] [Google Scholar]
- 24.Ou X, Sun SW, Liang HF, Song SK, Gochberg DF. Quantitative magnetization transfer measured pool-size ratio reflects optic nerve myelin content in ex vivo mice. Magn Reson Med. 2009;61:364–371. doi: 10.1002/mrm.21850. [DOI] [PMC free article] [PubMed] [Google Scholar]
- 25.Ou X, Sun SW, Liang HF, Song SK, Gochberg DF. The MT pool size ratio and the DTI radial diffusivity may reflect the myelination in shiverer and control mice. NMR Biomed. 2009;22:480–487. doi: 10.1002/nbm.1358. [DOI] [PMC free article] [PubMed] [Google Scholar]
- 26.Li K, Zu Z, Xu J, Janve VA, Gore JC, Does MD, Gochberg DF. Optimized inversion recovery sequences for quantitative T1 and magnetization transfer imaging. Magn Reson Med. 2010;64:491–500. doi: 10.1002/mrm.22440. [DOI] [PMC free article] [PubMed] [Google Scholar]
- 27.Coleman TF, Li YY. An interior trust region approach for nonlinear minimization subject to bounds. SIAM J Optim. 1996;6:418–445. [Google Scholar]
- 28.Underhill HR, Yuan C, Yarnykh VL. Direct quantitative comparison between cross-relaxation imaging and diffusion tensor imaging of the human brain at 3.0 T. Neuroimage. 2009;47:1568–1578. doi: 10.1016/j.neuroimage.2009.05.075. [DOI] [PubMed] [Google Scholar]
- 29.Sled JG, Levesque I, Santos AC, Francis SJ, Narayanan S, Brass SD, Arnold DL, Pike GB. Regional variations in normal brain shown by quantitative magnetization transfer imaging. Magn Reson Med. 2004;51:299–303. doi: 10.1002/mrm.10701. [DOI] [PubMed] [Google Scholar]
- 30.Gloor M, Scheffler K, Bieri O. Quantitative magnetization transfer imaging using balanced SSFP. Magn Reson Med. 2008;60:691–700. doi: 10.1002/mrm.21705. [DOI] [PubMed] [Google Scholar]
- 31.Garcia M, Gloor M, Wetzel SG, Radue EW, Scheffler K, Bieri O. Characterization of normal appearing brain structures using high-resolution quantitative magnetization transfer steady-state free precession imaging. Neuroimage. 52:532–537. doi: 10.1016/j.neuroimage.2010.04.242. [DOI] [PubMed] [Google Scholar]
- 32.Morrison C, Henkelman RM. A model for magnetization transfer in tissues. Magn Reson Med. 1995;33:475–482. doi: 10.1002/mrm.1910330404. [DOI] [PubMed] [Google Scholar]
- 33.Cercignani M, Barker GJ. A comparison between equations describing in vivo MT: the effects of noise and sequence parameters. J Magn Reson. 2008;191:171–183. doi: 10.1016/j.jmr.2007.12.012. [DOI] [PMC free article] [PubMed] [Google Scholar]


