

Abstract
High resolution functional magnetic resonance imaging at high field (9.4 Tesla) has been used to measure functional connectivity between sub-regions within primary somatosensory cortex of the squirrel monkey brain. The Hand-Face region within SI cortex of the squirrel monkey has been previously well mapped with functional imaging, electrophysiological and anatomical methods, and the orderly topographic map of the hand region is characterized by a lateral to medial representation of individual digits in four subregions of areas 3a, 3b, 1 and 2. With sub-millimeter resolution we are able to detect not only the separate islands of activation corresponding to vibrotactile stimulations of single digits but also, in subsequent acquisitions, the degree of correlation between voxels within SI in the resting state. The results suggest that connectivity patterns are very similar to stimulus-driven distributions of activity and that connectivity varies on the scale of millimeters within the same primary region. Connectivity strength is not a reflection of global larger scale changes in blood flow, and is not directly dependent on distance between regions. Preliminary electrophysiological recordings agree well with the fMRI data. In human studies at 7 Tesla, high resolution fMRI may also be used to identify the same sub-regions and assess responses to sensory as well as painful stimuli, and to measure connectivity dynamically before and after such stimulations.
Introduction
The identification of patterns of highly correlated low frequency MRI signals in the resting state potentially provides a powerful approach to delineate and describe neural circuits, and an unprecedented ability to assess the manner in which distributed brain regions work together to achieve specific functions. Moreover, observations of altered resting state connectivity in several disorders suggest these correlations reflect an important level of brain organization and may play a fundamental role in the execution and maintenance of various brain functions. However, although resting state correlations are already being widely used to assess functional connectivity, their precise interpretation remains unclear, and their biophysical basis as direct indicators of functional connectivity is largely unsubstantiated. This uncertainty is exacerbated by our incomplete understanding of the relationship between changes in neural activity and changes in cerebral blood flow, volume and oxygenation. A more complete understanding of the neuronal basis and characteristics of resting state MRI signals is crucial for the interpretation and validation of MR-based measures of functional connectivity.
Most previous studies of resting state connectivity have examined correlations between blood oxygen level dependent (BOLD) signals across relatively large-scale networks, and there is a shortage of data that describe the local extent of correlated hemodynamic changes. Previous investigators have usually not looked within well-defined functional regions at sub-millimeter scale, which is the dimension of basic processing units within the cortex. Long distance correlations between larger regions likely obscure finer scale structure and within-region functional hetrogeneity. However, it is not practical to address some of the most relevant questions about connectivity non-invasively in human subjects. We therefore have used very high-resolution imaging at high field (9.4T) to study cortical networks in anesthetized non-human primates, extending our previous studies of the somatotopic and functional organization of the primary somatosensory cortex (SI) in monkeys. We have thereby been able to explore functional cortical networks in the primate brain in more detail and at finer-scale than most previous studies. The sub-regions of SI cortex in monkeys are an excellent experimental model for this work because the functional and anatomical structures of this region have previously been well investigated with invasive electrophysiological and histological studies, and our own studies demonstrate that MRI can provide reliable data on functional activity and connectivity at high spatial resolution.
Resting State Functional Connectivity Signals
Correlations in low frequency BOLD signals from different parts of the brain were first reported by Biswal [1] and have subsequently become widely adopted as potentially indicating functional connectivity even in a resting state [2,3]. These inter-regional correlations are measureable in the absence of any specific stimulus or task manipulation, though they also may change in the performance of a steady-state task or exercise [4-6] in a manner that can be related to behavioral or other measures. Correlations in BOLD signals between specific regions of the brain have been proposed to be a key signature of consciously driven mental activity e.g. [7-9]). Numerous applications of such measurements in various normal and disease conditions [10-16] have led to observations of altered resting state networks, mainly in the so-called large scale ‘default mode network’, in conditions such as schizophrenia and chronic pain [14, 17-23]. These observations have challenged our view of brain function in a resting state, and have emphasized the importance of the view that resting state or baseline brain activities are crucial for the execution and maintenance of normal brain functions. More importantly, the detection of similar phenomena in different cortical networks (e.g. oculomotor, somatomotor, and visual cortex) in anesthetized monkeys [24] has extended this view, suggesting that spontaneous BOLD fluctuations reflect activities within intrinsic anatomical connections of functionally engaged brain regions [25,26], so that task-driven neuronal responses could be specific reflections of this dynamic, ongoing, functional organization of the brain [27-30]. Although the potential applications of these measurements are well recognized, their validity and the precise interpretation of their functional significance remain vague, and is made more difficult because of our limited understanding of how MRI BOLD signals are related to neuronal activity.
The majority of resting state fMRI studies have examined relatively large-scale networks, involving relatively large volumes of cortex, and much less is known about the characteristics of resting state MRI signals at finer scales. For example, the default mode network has been the focus of numerous studies in which large volumes of cortex (≈ >100 mm3) have been shown to exhibit variations in their average BOLD signals with other regions several centimeters distant. While these larger scale features are important, the basic processing units of the brain are organized on a much finer scale, yet we have little understanding of the spatial extent of BOLD correlations within a functionally heterogeneous region. The point spread function (PSF) of BOLD activation has been reported, but not the point spread function for inter-voxel correlations. We have previously shown that it is possible to map some brain functions at sub-millimeter resolutions in both humans and animals [31-34], and that functional connectivity appears inhomogeneous when comparing voxels that all respond to a stimulus within a region. Increased sensitivity and spatial specificity at higher MRI field allows us to examine connectivity in greater detail and at a spatial level that is close to what can be achieved by other standard, invasive methods in non-human primates.
High resolution fMRI studies in non-human primates: linkage between human and animal data
Distinct from cats and rodents, the functional regions of the non-human primate brain share considerable homology with humans [24, 35-38]. Studies of monkeys provide a crucial linkage between a large existing literature of animal data obtained with invasive methods and human fMRI data involving higher mental functions. Nearly all previous sub-millimeter fMRI studies have investigated the visual system, and it is unclear how well those findings can be generalized. The SI cortex of squirrel monkey is an alternative, unique experimental model for studies of brain activation and connectivity, with several advantages. The Hand-Face region within SI cortex of the squirrel monkey has been well mapped with functional imaging, electrophysiological and anatomical methods. The orderly topographic map of the primary somatosensory cortex is especially reflected in the hand region which is characterized by a lateral to medial representation of individual digits in four subregions of areas 3a, 3b, 1 and 2 (see Figure 1). This has been well established by studies of neuronal receptive field properties and of the effects of preferred stimuli and histological characterizations. Each area has distinct stimulus preferences, suggesting their different roles in specific somatosensory functions. In contrast to the visual system, stimulus evoked activations in the hand region can easily be detected and quantified in ‘single condition’ maps. This type of quantification eliminates unnecessary ambiguities in designing orthogonal stimuli that are commonly used to reveal modular structures in the visual system. The known, distinct, functional roles of individual areas 3a, 3b, and 1 allow us to test whether each resting state correlation pattern and inter-regional correlation strength is linked to their functional preferences. For example, areas 3b and 1 are known to be preferentially engaged in fine touch processing while area 3a is preferentially involved in proprioception and pain. The orderly somatotopic organization of individual digits within the hand region also provides a fine-scale topography to examine the point-spread function of correlations. Furthermore, because the Hand-Face region is characterized by a lack of intrinsic lateral anatomical connections and there are no overlaps of neuronal receptive fields between the Hand and Face areas, it allows us to examine the spatial correspondence between neuronal activity maps and local resting state correlation maps accurately and without other confounds. We have previously mapped the functional organization of this region at sub-millimeter scale [32-33, 39] for touch processing (Fig 1 B&C). Our data have demonstrated that single digit fMRI activations can be reliably mapped, their responses scale with the magnitude of the vibrotactile stimuli, and confirm that digit activations are organized in a somatotopic manner (Fig 1B-C). The immediately neighboring face area serves as a useful control region that allows us to isolate the extent of spatial correlations because we know from the anatomy that at the ‘Hand-Face’ border there are very limited cross border lateral intrinsic connections [40, 41-43]. This border's unique cytoarchitectonic feature makes it an obvious landmark for identifying and separating hand seed voxels from control face seed voxels in resting state analyses. Finally, the subregions (areas 3a, 3b and 1) of SI cortex have been intensively mapped with electrophysiological and histological methods in this species. One example is shown in Figure 1 C & D, where dense electrode penetrations (dots) were used to determine the preferences of neuronal responses and inter-areal borders (dotted black lines).
Figure 1.
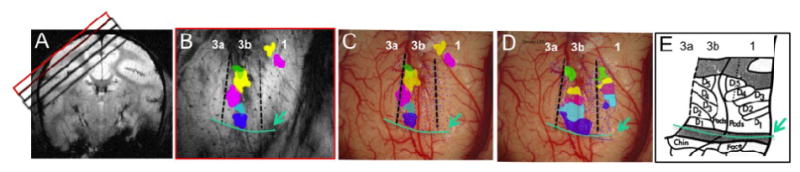
FMRI and electrophysiology of SI cortex of squirrel monkeys. A: Four oblique imaging slices (red and black boxes) are obtained from SI (top slice, red box) and deeper brain regions. B: Composite map of individual digit activations to tactile stimulus shows order representation of D1 (blue patch), D2 (light blue patch), D3 (violet patch), D4 (yellow patch) and D5 (green patch) in a lateral to medial order in area 3b. Dotted black lines indicate the estimated inter-areal borders. Green line and arrow indicate the hand-face border. C: Overlay of fMRI activation map of digits (same color scheme) and dense electrophysiology maps (blue dots indicate the electrode penetration sites). D: Digit representation territories in areas 3b and 1 as determined by receptive field properties and preferred stimuli. E. Digit representation map and organization in areas 3b and 1 as established by using electrophysiological and histologic evidence. Adapted from [46]. a: anterior; m: middle; I: lateral; p: posterior.
Methods
Animal preparation and monitoring
Details of the animal preparation and imaging protocols have been described in our previous papers [32, 33]. Squirrel monkeys were pre-anesthetized with ketamine and atropine sulfate and then 0.5-2% of isoflurane was administered to maintain a stable physiological condition for both MRI scans and later electrophysiology experiments. Throughout the procedures, the animal's vital signs were monitored, including heart rate, temperature (maintained at 38.5 deg), expired CO2 (maintained at 4%), and EEG (for electrophysiology only).
fMRI data acquisitions
All MRI scans were performed on a 9.4T Varian Inova spectrometer (Varian Medical Systems, Palo Alto, CA), using a 3 cm surface coil. T2* weighted structural images at 78 × 78 × 1000 μm3 resolution were acquired to identify venous structures on the cortical surface for locating the central sulcus and SI areas, for coregistration of fMRI maps across imaging sessions within and across animals, and with blood vessel maps for the later placement of recording electrodes. FMRI data acquired from the same slices using a Gradient Echo Planar (GE-EPI) sequence at voxel sizes of 575 × 575 × 1000 μm3 or 275 × 275 × 1000 μm3 were reconstructed and imported into Matlab (Mathworks, Natick, MA) for analysis. Within each imaging session, both tactile stimulus driven and resting state BOLD images were acquired.
Results
Resting state BOLD signals reveal distinct functional connectivity patterns within SI cortex
We identified regions in SI that responded to vibrotactile stimulation of individual digits as well as nearby face regions that serve as “control” areas in all animals. From these ROIs we selected single seed voxels and then examined their resting state connectivity to nearby voxels. The BOLD time course of a single voxel was used as the regressor for a GLM (general linear model) based connectivity analysis. All data processing and connectivity analyses were performed using in-house software. The connectivity coefficients (β – values) were normalized and after thresholding the index at 0.7 we overlaid the interpolated connectivity maps on a high resolution T2* weighted (0.078×0.078×2mm3) anatomic image, acquired with same imaging geometry (Fig. 2A-C). As an example, seeds in hand regions of areas 3b (Fig 2A) and area 3a (Fig 2B) and in one control location (face region in Fig 2C) revealed very different correlation patterns in the resting state (resolution = 0.58×0.58×2 = 0.67 mm3). Here, the seed voxel in the hand regions of areas 3b and 3a were found using activation maps during tactile stimulation of digit 2 (not shown) that were later confirmed by electrophysiological mapping (color dots in Fig 2B&D). The seed in 3a shows strong correlation with area 1/2, but not 3b, and the separation between the islands of correlation in Figure 2B strongly suggest that this cannot be explained by a global change in blood flow, and that correlations vary on the scale of millimeters. As validated by subsequent electrophysiological maps of single digit neurons, area 3b is highly correlated with area 1/2 (yellow to orange voxels in Fig 2A) whereas area 3a is highly correlated with 1/2 but not area 3b (Fig. 2B). In contrast, a seed voxel in the face region of area 3b correlated only to its neighboring local voxels with narrower PSF (Fig. 2C). We observed the connectivity index to be high at area 1 and in the neighborhood of each location. With close examination of the electrophysiology map (Fig. 2D), we found pair-wise highly correlated voxels were all located in topographically appropriate locations (e.g. digit 4 in area 3b to digit 4 in area1/2).
Figure 2.
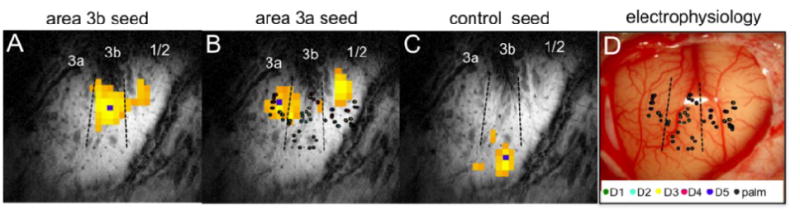
Differential functional connectivity revealed within areas 3a, 3b, 1/2 of SI cortex in anesthetized monkey. A: highly correlated area at area 1 considering single most activated voxel in area 3b as the seed (small blue square), but low correlation with area 3a. B: connectivity map from seed location in 3a. C: connectivity profile for a control face region. D: exposed slice showing blood vessels and location of electrodes used to map digit fields.
Similar differential correlation patterns were observed at a group level, based on pooling the data acquired on six squirrel monkeys over 18 runs. Six animal brains were coregistered manually with respect to the seed ROIs (unlike for humans and other animals there is no new world monkey brain template for coregistration). Figure 3 confirms our observations of the differential correlation patterns of area 3b (Fig 3A&C) and area 3a (Fig 3B&D). Topographic maps showed a progressive variation of connectivity index in the neighborhood of seed voxels (Fig 3C&D). The group analysis also suggests that the profile of functional connectivity in the neighborhood of each region is asymmetric in nature. To quantify the shape of the local correlation profiles, we modeled the PSF for each ROI. The full widths at 0.7 times the peak value, estimated as the major and minor axis of a fitted ellipse, are presented in Table 1 and clearly describe the asymmetric nature of the profiles at areas 3b, 3a and 1, whereas control regions are found to be more symmetric and near circular in shape. The wider correlation pattern along the digit representation axis (the major axis) than the pattern across hand to palm and other cortical areas (the minor axis) indicates that high correlations exist among cortical regions such as digit regions that share functional attributes.
Figure 3.
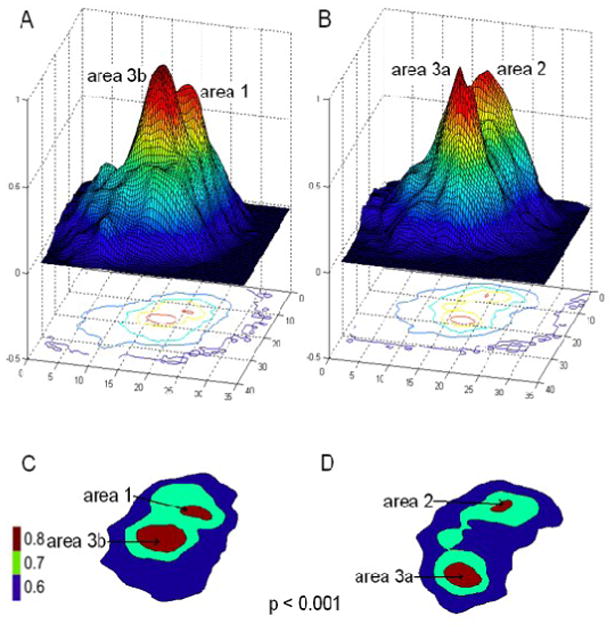
Differential functional connectivity patterns in SI cortex. A & B: 3D Correlation patterns of area 3b seed and area 3a seed, respectively. C&D: 2D plot of thresholded correlation map at r=0.7 (gray) for both area 3b and 3a. Color scale bar: r-values.
Table 1. Dimensions of point spread function of connectivity in SI (measured as full width at 0.7 times the peak value).
| Area | Major axis (mm) | Minor axis (mm) |
|---|---|---|
| 3b | 4.9 | 3.4 |
| 1 | 5.4 | 3.3 |
| 3a | 5.4 | 3.7 |
| Control | 3.8 | 3.4 |
To quantify how strongly different sub-regions within SI cortex are functionally connected to each other, and whether the connectivity of these ROIs with control regions are different, we derived a group ROI-based correlation matrix, which measures the correlation coefficient (r-values) between all possible combinations of ROIs. The analyzed ROIs were areas 3b, 3a, 1/2 and one control region. Figure 4 displays the pair wise r-values (each symbol represents measures from one imaging run) for 6 pairs of combinations indicating the group correlations and their p values. Among the ROIs, correlation between area 3b and area 1 was significantly higher than correlations between area 3a and area 3b (p<0.01). Additionally, correlations between digit areas were significantly stronger than their correlations with control ROIs (p<0.001). In order to prove that the spatial separation of voxels does not confound the results in this study, we plotted the correlation coefficients for each possible combination of ROIs in each run for each animal vs. the Euclidean distance between them. The scatter plot was essentially a random pattern (r = -0.043, p > 0.77, data not shown) which supports our conclusion that differential functional connectivity is not a function of distance between ROIs.
Figure 4.
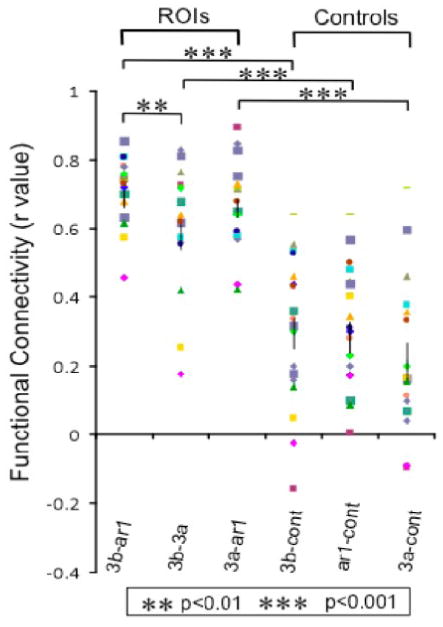
Grouped r-values of correlations between 6 pairs of ROIs. Each symbol represents measures from one imaging run. Correlation between area 3b and area 1 was significantly higher than correlations between area 3a and area 3b (p<0.01). Additionally, correlations between digit areas were significantly stronger than their correlations with control ROIs (p<0.001)
Similarity between resting state connectivity maps and stimulus-driven activation patterns
To explore whether resting state correlation maps predict the functional preferences of individual areas, we compared the group average resting state connectivity map for the voxel in area 3b with the tactile stimulus evoked activations (n = 8) in the same region. The tactile stimulation elicited activation pattern for a single digit (Fig 5B&D) is very similar to the resting state connectivity map of the digit region in area 3b (Fig. 5A&C). Tactile stimulation evoked stronger and larger activation in area 3b than in area 1. The Euclidean distance between peak activations in area 3b and area 1 is approximately 2.9 mm while the inter-areal distance of the resting state peak correlations was found to be 2.8 mm. The similarity between resting state connectivity maps and tactile stimulus driven activations suggests that cortical regions that have the same stimulus preference also have strong resting state connectivity.
Figure 5.
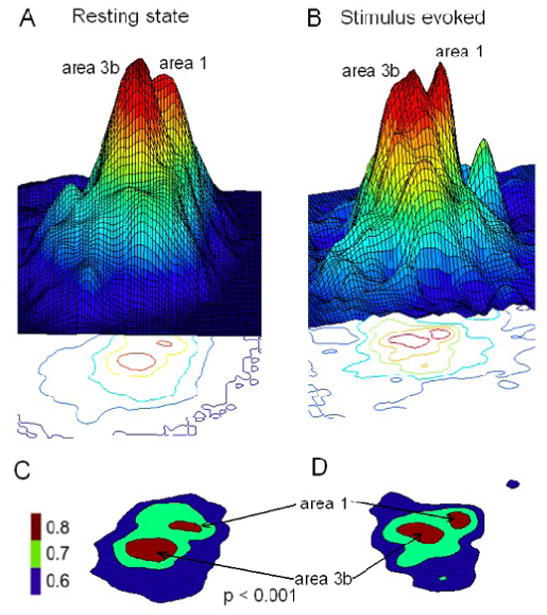
A & B: 3D Correlation pattern from resting state and stimulus driven activation map for seed voxel in area 3b. C & D 2D plots thresholded at r = 0.6. Color scale bar: r-values.
Discussion
These studies demonstrate that fine scale connectivity within well defined regions of primary somatosensory cortex in the non-human primate brain can be measured using high-field MRI. In the hand region of the squirrel monkey brain, sub-regions of SI (areas 3a, 3b, 1) show differential correlation patterns to other sub-regions e.g. 3b-1 stronger than 3b-3a. These correlations are arranged topographically, connect only to other hand regions, and in general resemble evoked activation maps. These correlations exist at fine scale - on the order of millimeters - with separations between regions. Further studies in this animal model will permit more complete investigations of the nature of interregional correlations and their relationship to connectivity assessed by other modalities.
The high signal to noise ratio and high spatial resolution of these studies were made possible by the use of high fields and several technical refinements. Even though the non-human primate brain shares similar features to the human, clearly it would be of major interest if similar studies could be performed in human subjects. To this end, we have attempted similar studies in human subjects at 7 Tesla. For example, mapping of somatosensory areas corresponding to SI using simple air puffs on the finger tips as stimuli were reported by Stringer et al. [34], who recorded fMRI activations from block design paradigms with spatial resolution of 1×1×2 mm. Single digit representations in area 3b along the posterior bank of the central sulcus and area 1 on the crest of the postcentral gyrus were readily identified in individual subjects. In addition, thermal stimuli have been used to identify the areas that respond to temperature or painful heating by varying the temperature of a stimulating thermode [44]. By applying blocks of thermal stimuli and recording the subjective ratings of thermal pain, and then using the latter as regressors in a GLM analysis of the BOLD signal time course, discrete areas corresponding to regions 3a, 3b, 1 and 2 activated by the stimuli were resolved [44]. Those same voxels were also examined in the resting state before and after painful thermal stimuli and pair-wise correlations calculated between them. Again the correlations between regions was significantly greater than between them and control areas, and each sub-region revealed a different pattern of connectivity. Moreover, the inter-regional correlations changed after the stimuli had been applied illustrating that steady state correlations themselves may be dynamically varying and change with state.
The ability to use smaller voxels at high fields has also allowed the exploration of partial volume effects and the spatial scale of functional connectivity in human motor cortex. Studies of connectivity have been performed in the motor system at different spatial resolutions and have been recently reported by us [45]. A simple finger tapping task was first used to identify regions activated by finger movements. This was performed 4 times, and images were acquired at 4 different spatial resolutions (1×1×2, 1.5×1.5×2, 2×2×2, 3×3×2 mm). Activation maps for each condition showed broad agreement in identifying the regions previously identified as being part of the motor system. These maps were used to identify a single seed voxel, the most active voxel in the contralateral motor cortex. Resting state data were acquired also at the same spatial resolutions, and in each data set the resting state correlation map to the single voxel were calculated. Within each of these 4 maps there were structures that correspond to the normal regions of connectivity, along with numerous spurious false positive or negative correlations. From previous experience and the block design study we were able to construct histograms of the distribution of correlation values to the seed voxel for those voxels within the motor system and those not involved. We examined the manner in which the histograms of correlation values for the seed voxel varied as a function of voxel size. As reported by Newton et al. [45], as the voxel size decreases, the histogram of correlation values for voxels not in the motor system does not change and remains symmetric about the value 0; whereas the histogram of values for those voxels within the motor network systematically shifts to larger positive values as the voxel decreases in volume. This occurs even as the signal to noise ratio (SNR) of the data also decreases dramatically. Thus, even though SNR decreases, connectivity values increase as partial volume effects are reduced and the seed voxel volume decreases. This suggests strongly that connectivity varies on the scale of the voxel dimension and that it is heterogeneous on the scale of millimeters. We aim to continue to explore resting state connectivity in human SI at high resolution, as well as to report more comprehensive investigations of the fine-scale connectivity in non-human primates.
Footnotes
Publisher's Disclaimer: This is a PDF file of an unedited manuscript that has been accepted for publication. As a service to our customers we are providing this early version of the manuscript. The manuscript will undergo copyediting, typesetting, and review of the resulting proof before it is published in its final citable form. Please note that during the production process errors may be discovered which could affect the content, and all legal disclaimers that apply to the journal pertain.
References
- 1.Biswal B, Yetkin FZ, Haughton VM, Hyde JS. Functional connectivity in the motor cortex of resting human brain using echo-planar MRI. Magn Reson Med. 1995;34(4):537–541. doi: 10.1002/mrm.1910340409. [DOI] [PubMed] [Google Scholar]
- 2.Greicius MD, Krasnow B, Reiss AL, Menon V. Functional connectivity in the resting brain: a network analysis of the default mode hypothesis. Proc Natl Acad Sci U S A. 2003;100:253–258. doi: 10.1073/pnas.0135058100. [DOI] [PMC free article] [PubMed] [Google Scholar]
- 3.Guye M, Bartolomei F, Ranjeva JP. Imaging structural and functional connectivity: towards a unified definition of human brain organization. Curr Opin Neurol. 2008;21:393–403. doi: 10.1097/WCO.0b013e3283065cfb. [DOI] [PubMed] [Google Scholar]
- 4.Newton AT, Morgan VL, Gore JC. Task demand modulation of steady-state functional connectivity to primary motor cortex. Hum Brain Mapp. 2007 Jul;28(7):663–72. doi: 10.1002/hbm.20294. [DOI] [PMC free article] [PubMed] [Google Scholar]
- 5.Hampson M, Driesen NR, Skudlarki P, Gore JC, Constable RT. Brain connectivity related to working memory performance. J Neurosci. 2006 Dec 20;26(51):13338–43. doi: 10.1523/JNEUROSCI.3408-06.2006. [DOI] [PMC free article] [PubMed] [Google Scholar]
- 6.Newton AT, Morgan VL, Rogers BP, Gore JC. Modulation of steady state functional connectivity in the default mode and working memory networks by cognitive load. Hum Brain Mapp. 2010 Nov 12; doi: 10.1002/hbm.21138. [DOI] [PMC free article] [PubMed] [Google Scholar]
- 7.Rogers BP, Morgan VL, Newton AT, Gore JC. Assessing functional connectivity in the human brain by fMRI. Magn Reson Imaging. 2007;25:1347–1357. doi: 10.1016/j.mri.2007.03.007. [DOI] [PMC free article] [PubMed] [Google Scholar]
- 8.Fingelkurts AA, Fingelkurts AA, Kahkonen S. Functional connectivity in the brain--is it an elusive concept? Neurosci Biobehav Rev. 2005;28:827–836. doi: 10.1016/j.neubiorev.2004.10.009. [DOI] [PubMed] [Google Scholar]
- 9.Fox MD, Raichle ME. Spontaneous fluctuations in brain activity observed with functional magnetic resonance imaging. Nat Rev Neurosci. 2007;8:700–711. doi: 10.1038/nrn2201. [DOI] [PubMed] [Google Scholar]
- 10.Assaf M, et al. Abnormal functional connectivity of default mode sub-networks in autism spectrum disorder patients. Neuroimage. 2010;53:247–256. doi: 10.1016/j.neuroimage.2010.05.067. [DOI] [PMC free article] [PubMed] [Google Scholar]
- 11.Cao X, et al. Abnormal resting-state functional connectivity patterns of the putamen in medication-naive children with attention deficit hyperactivity disorder. Brain Res. 2009;1303:195–206. doi: 10.1016/j.brainres.2009.08.029. [DOI] [PubMed] [Google Scholar]
- 12.Cubillo A, et al. Reduced activation and inter-regional functional connectivity of frontostriatal networks in adults with childhood Attention-Deficit Hyperactivity Disorder (ADHD) and persisting symptoms during tasks of motor inhibition and cognitive switching. J Psychiatr Res. 2010;44:629–639. doi: 10.1016/j.jpsychires.2009.11.016. [DOI] [PubMed] [Google Scholar]
- 13.Garrity AG, et al. Aberrant “default mode” functional connectivity in schizophrenia. Am J Psychiatry. 2007;164:450–457. doi: 10.1176/ajp.2007.164.3.450. [DOI] [PubMed] [Google Scholar]
- 14.Liao W, et al. Selective aberrant functional connectivity of resting state networks in social anxiety disorder. Neuroimage. 2010;52:1549–1558. doi: 10.1016/j.neuroimage.2010.05.010. [DOI] [PubMed] [Google Scholar]
- 15.Henseler I, Falkai P, Gruber O. Disturbed functional connectivity within brain networks subserving domain-specific subcomponents of working memory in schizophrenia: relation to performance and clinical symptoms. J Psychiatr Res. 2010;44:364–372. doi: 10.1016/j.jpsychires.2009.09.003. [DOI] [PubMed] [Google Scholar]
- 16.Honey GD, et al. Dopaminergic drug effects on physiological connectivity in a human cortico-striato-thalamic system. Brain. 2003;126:1767–1781. doi: 10.1093/brain/awg184. [DOI] [PMC free article] [PubMed] [Google Scholar]
- 17.Baliki MN, et al. Chronic pain and the emotional brain: specific brain activity associated with spontaneous fluctuations of intensity of chronic back pain. J Neurosci. 2006;26:12165–12173. doi: 10.1523/JNEUROSCI.3576-06.2006. [DOI] [PMC free article] [PubMed] [Google Scholar]
- 18.Monk CS, et al. Abnormalities of intrinsic functional connectivity in autism spectrum disorders. Neuroimage. 2009;47:764–772. doi: 10.1016/j.neuroimage.2009.04.069. [DOI] [PMC free article] [PubMed] [Google Scholar]
- 19.Liao W, et al. Altered functional connectivity and small-world in mesial temporal lobe epilepsy. PLoS One. 5:e8525. doi: 10.1371/journal.pone.0008525. [DOI] [PMC free article] [PubMed] [Google Scholar]
- 20.Camchong J, Macdonald AW, 3rd, Bell C, Mueller BA, Lim KO. Altered Functional and Anatomical Connectivity in Schizophrenia. Schizophr Bull. 2009 doi: 10.1093/schbul/sbp131. [DOI] [PMC free article] [PubMed] [Google Scholar]
- 21.Baliki MN, Geha PY, Apkarian AV, Chialvo DR. Beyond feeling: chronic pain hurts the brain, disrupting the default-mode network dynamics. J Neurosci. 2008;28:1398–1403. doi: 10.1523/JNEUROSCI.4123-07.2008. [DOI] [PMC free article] [PubMed] [Google Scholar]
- 22.Vincent JL, et al. Intrinsic functional architecture in the anaesthetized monkey brain. Nature. 2007;447:83–86. doi: 10.1038/nature05758. [DOI] [PubMed] [Google Scholar]
- 23.Shmuel A, Leopold DA. Neuronal correlates of spontaneous fluctuations in fMRI signals in monkey visual cortex: Implications for functional connectivity at rest. Hum Brain Mapp. 2008;29:751–761. doi: 10.1002/hbm.20580. [DOI] [PMC free article] [PubMed] [Google Scholar]
- 24.Scholvinck ML, Maier A, Ye FQ, Duyn JH, Leopold DA. Neural basis of global resting-state fMRI activity. Proc Natl Acad Sci U S A. 2010;107(22):10238–10243. doi: 10.1073/pnas.0913110107. [DOI] [PMC free article] [PubMed] [Google Scholar]
- 25.Guye M, Parker GJ, Symms M, Boulby P, Wheeler-Kingshott CA, Salek-Haddadi A, Barker GJ, Duncan JS. Combined functional MRI and tractography to demonstrate the connectivity of the human primary motor cortex in vivo. Neuroimage. 2003;19(4):1349–1360. doi: 10.1016/s1053-8119(03)00165-4. [DOI] [PubMed] [Google Scholar]
- 26.Honey CJ, Sporns O, Cammoun L, Gigandet X, Thiran JP, Meuli R, Hagmann P. Predicting human resting-state functional connectivity from structural connectivity. Proc Natl Acad Sci U S A. 2009;106(6):2035–2040. doi: 10.1073/pnas.0811168106. [DOI] [PMC free article] [PubMed] [Google Scholar]
- 27.Fox MD, Snyder AZ, Vincent JL, Corbetta M, Van Essen DC, Raichle ME. The human brain is intrinsically organized into dynamic, anticorrelated functional networks. Proc Natl Acad Sci U S A. 2005;102(27):9673–9678. doi: 10.1073/pnas.0504136102. [DOI] [PMC free article] [PubMed] [Google Scholar]
- 28.Raichle ME. Two views of brain function. Trends Cogn Sci. 2010;14:180–190. doi: 10.1016/j.tics.2010.01.008. [DOI] [PubMed] [Google Scholar]
- 29.Raichle ME, Mintun MA. Brain work and brain imaging. Annu Rev Neurosci. 2006;29:449–476. doi: 10.1146/annurev.neuro.29.051605.112819. [DOI] [PubMed] [Google Scholar]
- 30.Fox MD, Raichle ME. Spontaneous fluctuations in brain activity observed with functional magnetic resonance imaging. Nat Rev Neurosci. 2007;8(9):700–711. doi: 10.1038/nrn2201. [DOI] [PubMed] [Google Scholar]
- 31.Chen LM, Dillenburger BC, Wang F, Friedman RM, Avison MJ. High-resolution functional magnetic resonance imaging mapping of noxious heat and tactile activations along the central sulcus in New World monkeys. Pain. 2011;152(3):522–532. doi: 10.1016/j.pain.2010.10.048. [DOI] [PMC free article] [PubMed] [Google Scholar]
- 32.Chen LM, Turner GH, Friedman RM, Zhang N, Gore JC, Roe AW, Avison MJ. High-resolution maps of real and illusory tactile activation in primary somatosensory cortex in individual monkeys with functional magnetic resonance imaging and optical imaging. J Neurosci. 2007;27(34):9181–9191. doi: 10.1523/JNEUROSCI.1588-07.2007. [DOI] [PMC free article] [PubMed] [Google Scholar]
- 33.Zhang N, Gore JC, Chen LM, Avison MJ. Dependence of BOLD signal change on tactile stimulus intensity in SI of primates. Magn Reson Imaging. 2007;25(6):784–794. doi: 10.1016/j.mri.2007.05.002. [DOI] [PubMed] [Google Scholar]
- 34.Stringer EA, Chen LM, Friedman RM, Gatenby C, Gore JC. Differentiation of somatosensory cortices by high-resolution fMRI at 7 T. Neuroimage. 2011;54(2):1012–1020. doi: 10.1016/j.neuroimage.2010.09.058. [DOI] [PMC free article] [PubMed] [Google Scholar]
- 35.Logothetis NK. The underpinnings of the BOLD functional magnetic resonance imaging signal. J Neurosci. 2003;23(10):3963–3971. doi: 10.1523/JNEUROSCI.23-10-03963.2003. [DOI] [PMC free article] [PubMed] [Google Scholar]
- 36.Logothetis NK, Pauls J, Augath M, Trinath T, Oeltermann A. Neurophysiological investigation of the basis of the fMRI signal. Nature. 2001;412(6843):150–157. doi: 10.1038/35084005. [DOI] [PubMed] [Google Scholar]
- 37.Logothetis NK, Wandell BA. Interpreting the BOLD signal. Annu Rev Physiol. 2004;66:735–769. doi: 10.1146/annurev.physiol.66.082602.092845. [DOI] [PubMed] [Google Scholar]
- 38.Maier A, Wilke M, Aura C, Zhu C, Ye FQ, Leopold DA. Divergence of fMRI and neural signals in V1 during perceptual suppression in the awake monkey. Nat Neurosci. 2008;11(10):1193–1200. doi: 10.1038/nn.2173. [DOI] [PMC free article] [PubMed] [Google Scholar]
- 39.Zhang N, Wang F, Turner GH, Gore JC, Avison MJ, Chen LM. Intra- and inter-subject variability of high field fMRI digit maps in somatosensory area 3b of new world monkeys. Neuroscience. 2010;165(1):252–264. doi: 10.1016/j.neuroscience.2009.09.066. [DOI] [PMC free article] [PubMed] [Google Scholar]
- 40.Jones EG. Cortical and subcortical contributions to activity-dependent plasticity in primate somatosensory cortex. Annu Rev Neurosci. 2000;23:1–37. doi: 10.1146/annurev.neuro.23.1.1. [DOI] [PubMed] [Google Scholar]
- 41.Fang PC, Jain N, Kaas JH. Few intrinsic connections cross the hand-face border of area 3b of New World monkeys. J Comp Neurol. 2002;454:310–319. doi: 10.1002/cne.10433. [DOI] [PubMed] [Google Scholar]
- 42.Fame A, Roy AC, Giraux P, Dubernard JM, Sirigu A. Face or hand, not both: perceptual correlates of reafferentation in a former amputee. Curr Biol. 2002;12:1342–1346. doi: 10.1016/s0960-9822(02)01018-7. [DOI] [PubMed] [Google Scholar]
- 43.Manger PR, Woods TM, Munoz A, Jones EG. Hand/face border as a limiting boundary in the body representation in monkey somatosensory cortex. J Neurosci. 1997;17:6338–6351. doi: 10.1523/JNEUROSCI.17-16-06338.1997. [DOI] [PMC free article] [PubMed] [Google Scholar]
- 44.Stringer EA, Chen LM, Friedman RM, Gore JC. Abstracts, International Association for the Study of Pain. Montreal: 2010. Representation of Pain Perception within Human SI and Sll Revealed by High Resolution fMRI at 7T. [Google Scholar]
- 45.Newton AT, Rogers BP, Gore JC, Morgan VL. Improving measurement of functional connectivity through decreasing partial volume effects at 7T. Neuroimage. 2011 doi: 10.1016/j.neuroimage.2011.08.096. in press. [DOI] [PMC free article] [PubMed] [Google Scholar]
- 46.Sur M, Nelson RJ, Kaas JH. Representations of the body surface in cortical areas 3b and 1 of squirrel monkeys: comparisons with other primates. J Comp Neurol. 1982;211(2):177–192. doi: 10.1002/cne.902110207. [DOI] [PubMed] [Google Scholar]