

Abstract
The representation of value is a critical component of decision making. Rational choice theory assumes that options are assigned absolute values, independent of the value or existence of other alternatives. However, context-dependent choice behavior in both animals and humans violates this assumption, suggesting that biological decision processes rely on comparative evaluation. Here we show that neurons in the monkey lateral intraparietal cortex encode a relative form of saccadic value, explicitly dependent on the values of the other available alternatives. Analogous to extra-classical receptive field effects in visual cortex, this relative representation incorporates target values outside the response field and is observed in both stimulus-driven activity and baseline firing rates. This context-dependent modulation is precisely described by divisive normalization, indicating that this standard form of sensory gain control may be a general mechanism of cortical computation. Such normalization in decision circuits effectively implements an adaptive gain control for value coding and provides a possible mechanistic basis for behavioral context-dependent violations of rationality.
Introduction
Efficient decision-making systems must represent the values of possible actions in some form. Many normative models of choice, such as expected utility theory and foraging theory, assume that each option is evaluated in an absolute manner, without regard to the other alternatives (Von Neumann and Morgenstern, 1944; Luce, 1959; Stephens and Krebs, 1986). However, increasing behavioral evidence suggests that valuation depends on the composition of the choice set. Under larger choice sets, human decision makers report greater difficulty choosing and lower outcome satisfaction, and they often choose the default option or opt not to choose at all (Iyengar and Lepper, 2000). Examined directly, both animals and humans display context-dependent preferences that vary as additional alternatives are added to the choice set (Tversky and Simonson, 1993; Shafir et al., 2002; Bateson et al., 2003). However, the neural basis of such context-dependent valuation is unknown.
Neurophysiological experiments have demonstrated reward-related activity that appears to encode action value in a number of brain areas linked to decision making. In monkey area lateral intraparietal cortex (LIP), a parietal region responsive to both visual stimuli and saccadic eye movements, neurons are strongly modulated by the value associated with a saccade. This value modulation appears to be a general aspect of LIP activity, consistently observed whether value is determined by explicit manipulation of reward magnitude and probability of reinforcement (Platt and Glimcher, 1999), recent reward history in a foraging paradigm (Sugrue et al., 2004), or strategic valuation in a behavioral game (Dorris and Glimcher, 2004; Seo et al., 2009); furthermore, dynamic encoding of expected action value may underlie the representation of evolving likelihood information in sensory discrimination tasks (Roitman and Shadlen, 2002; Huk and Shadlen, 2005).
How is value encoded in LIP? Current evidence suggests that parietal neurons are modulated by the value of their associated saccade, but the specific form of value representation and how it arises out of cortical circuit interactions remains primarily unexplored. We hypothesize here that value coding in parietal cortex is shaped by the same cortical gain control mechanisms that operate in sensory cortices, resulting in a relative rather than absolute representation of value that reflects the context defined by the choice set.
LIP neurons, like those in visual cortex, respond to stimulus presentation in a circumscribed region of visual space termed the response field (RF); many of these neurons also possess a similarly tuned response to upcoming saccade amplitude and direction. Saccadic value is represented via a modulation of this spatially tuned activity. In sensory cortices, stimuli outside the classical receptive field can nonetheless significantly modulate neuronal activity. Many of these extra-classical effects are well described by models in which response is specified by the sensory properties of the stimulus inside the receptive field, divided by the weighted sum of the sensory properties of stimuli both outside and inside the receptive field (Heeger, 1992; Carandini et al., 1997; Cavanaugh et al., 2002). If parietal cortex uses an analogous functional architecture, then a similar form of divisive normalization may underlie the relative representation of saccadic value in LIP.
Materials and Methods
Subjects and task.
Three male rhesus monkeys (Macaca mulatta) were used as subjects. Two animals (monkey D, ∼8.6 kg; monkey W, ∼6.0 kg) participated in the two-target task, and two animals (monkey W; monkey B, ∼12.0 kg) participated in the three-target task. All experimental procedures were performed in accordance with the United States Public Health Service's Guide for the Care and Use of Laboratory Animals and approved by the New York University Institutional Use and Care Committee.
Experiments were conducted in a dimly lit, sound-attenuated room using standard techniques (Platt and Glimcher, 1997). Briefly, the monkeys were head restrained and seated in a Plexiglas enclosure that permitted arm and leg movements. Visual stimuli were generated using an array of tri-state light-emitting diodes (LEDs) situated on a tangent screen 145 cm from the eyes of the monkey. The LEDs formed a grid with points spaced at 2° intervals, spanning 40° horizontally and 40° vertically. Eye movements were monitored using the scleral search coil technique, with horizontal and vertical eye position sampled at 500 Hz using a quadrature phase detector (Riverbend Electronics). Presentation of visual stimuli and water reinforcement delivery were controlled with an integrated software and hardware system (Gramalkn; Ryklin Software).
In the two-target task (see Fig. 1A), each trial began with the monkey fixating a central fixation target. Two peripheral targets were then presented (1000 ms): one target (green) was placed in the previously identified RF, and one target (red) was placed in the contralateral hemifield, typically an equal distance from fixation. The central fixation cue then changed color to indicate which peripheral saccade target would be rewarded (500 ms). Finally, the fixation target was extinguished, and the monkey was rewarded for a saccade to the correct peripheral target. Each session was conducted in blocks of 40 trials with the instructed target location determined randomly and with equal probability (instructed trials were followed by 20 free choice trials; these data are not presented here). To examine the effect of extra-RF target value on LIP activity, RF reward magnitude was fixed (Vin = 260 μl) and extra-RF reward magnitude was varied across blocks in randomized order (Vout = 130, 163, 195, 228, or 260 μl). RF target value modulation was examined in blocks with extra-RF magnitude fixed (Vout = 130 μl) and RF magnitude varied in randomized order (Vin = 65, 195, 260, or 390 μl).
Figure 1.

Relative representation of value in area LIP. A, Two-target task sequence. Monkeys were presented a target in the individual neuron RF and an extra-RF target in the contralateral hemifield. A change in the central cue color indicated the saccade target on a given trial, and monkeys were rewarded for a saccade to the instructed target. Reward magnitudes were manipulated in a block design, with either RF (Vin) or extra-RF (Vout) target value varied across blocks. B, RF target value positively modulates LIP firing rates. Example single-neuron (left) and population average (right) activity, shown for trials with saccades to the RF, are shown. Data are segregated by RF target value; extra-RF target value was identical across conditions (Vout = 130 μl). The shaded region indicates the data window used for analysis (0–1000 ms after target presentation). C, Average population activity as a function of RF target value. D, Extra-RF target value negatively modulates LIP activity. Example single-neuron (left) and population average (right) activity, segregated by extra-RF target value, are shown; RF target value was identical across conditions (Vin = 260 μl). E, Average population activity as a function of extra-RF target value.
After fixation in the three-target task (see Fig. 2A), monkeys were presented with a target array consisting of one, two, or three peripheral saccade targets (1000 ms). After target presentation, all target stimuli except one were extinguished (500 ms); the fixation target was then extinguished, and the monkey received the associated reward for a saccade to the remaining target. On a given trial, the monkey was presented with one of the seven possible target configurations (three single-target, three dual-target, one triple-target) selected in a randomized fashion; the final saccade target was selected from the presented targets with equal probability. One target associated with a fixed reward magnitude was located within the identified RF of the individual neuron (RF target). Two additional targets associated with different reward magnitudes were located at sites where no visually evoked activity was observed (extra-RF targets). For LIP neurons with lateralized RFs (peak firing >6° away from the vertical meridian), the two extra-RF targets were placed in the opposite horizontal hemifield, symmetrically oriented above and below the horizontal meridian and a minimum of 8° from the vertical meridian. For the few neurons with RF centers near the vertical meridian, the two extra-RF targets were positioned in the opposite vertical hemifield, symmetrically oriented across the vertical meridian.
Figure 2.
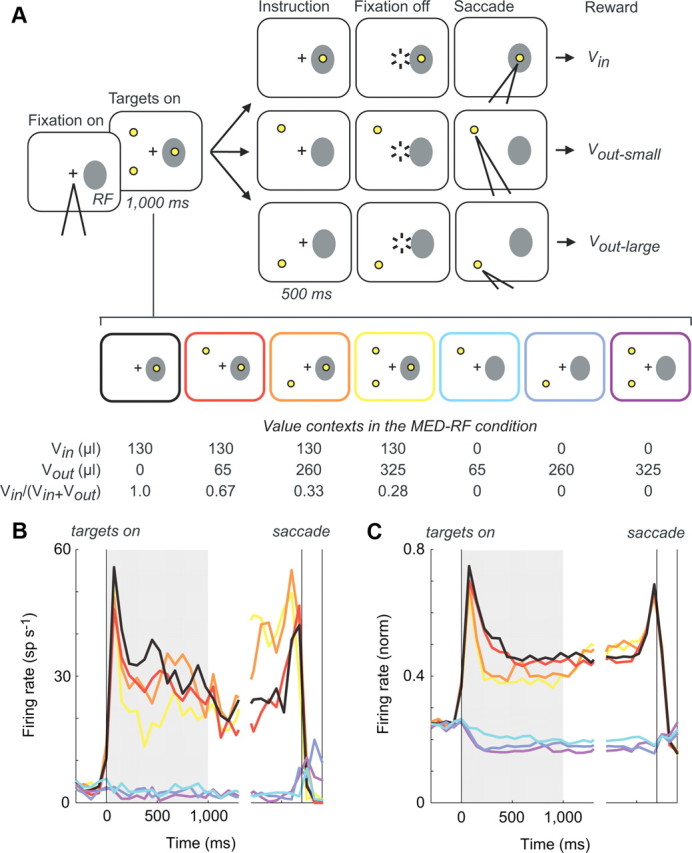
Choice context modulates both target-driven and baseline LIP activity. A, Three-target task sequence. Monkeys were presented with a target array of one, two, or three peripheral targets associated with different reward magnitudes. The target array on any given trial was randomly selected from the seven possible target configurations (bottom). All but one of the targets were then extinguished, and monkeys were rewarded the designated amount for a saccade to the remaining target. Target locations and reward assignments were fixed for the duration of an individual session. B, Example single-neuron activity. Firing rate histograms are aligned to target onset and segregated by target array condition, shown for trials to the RF. Colors correspond to conditions shown in A. C, Population average activity. Both target-driven (black-yellow) and baseline (cyan-purple) activity exhibit suppression by the presence of extra-RF targets.
Target locations and rewards assigned to those targets were fixed across an individual session. In the MED-RF condition, the RF target was always associated with a 130 μl reward, and the two extra-RF targets were associated with rewards of 65 and 260 μl. The identical behavioral procedure was conducted with different reward magnitudes for the HIGH-RF condition (RF target, 260 μl; extra-RF targets, 65, 130 μl) and two LOW-RF conditions (RF target, 65 μl; extra-RF targets, 130 and 260 μl; RF target, 65 μl; extra-RF targets, 325 and 325 μl). The reward magnitudes and number of neurons recorded under the different value conditions are summarized in Table 1.
Table 1.
Three-target task value conditions
| Condition | Tar 1 (RF) value (μl) | Tar 2 value (μl) | Tar 3 value (μl) | Number of neurons |
|---|---|---|---|---|
| MED-RF | 130 | 260 | 65 | 62 |
| LOW-RF | 65 | 130 | 260 | 20 |
| 65 | 325 | 325 | 21 | |
| HIGH-RF | 260 | 65 | 130 | 17 |
Data are reward magnitudes assigned to RF (Tar 1) and extra-RF (Tar 2, Tar 3) targets in the MED-RF, LOW-RF, and HIGH-RF three-target task conditions and the total number of neurons recorded under each condition.
Electrophysiological recording.
Monkeys were implanted with a Cilux recording chamber (Crist Instrument) targeting the lateral bank of the intraparietal sulcus, centered 3 mm caudal and 12 mm lateral to the intersection of the midsagittal and interaural planes in either the left hemisphere (monkey D) or the right hemisphere (monkeys W and B). Chamber location was verified using anatomical magnetic resonance imaging (3T Allegra; Siemens). At the start of each recording session, a 23 gauge guide tube was positioned in a support grid (1 mm spacing; Crist Instrument) and inserted through intact dura. A tungsten steel electrode (8–10 MΩ; FHC) was lowered through the guide tube using a computer-controlled micropositioner (EPS; Alpha-Omega). Electrophysiological signals were amplified, bandpass filtered, and digitized, and individual neurons were isolated based on waveform characteristics (MAP; Plexon).
Within a given session, recording was initiated once stable electrophysiological signals were obtained from a depth corresponding to LIP according to the magnetic resonance images. Single intraparietal neurons were identified and selected only for visual response to target presentation, and response fields were characterized with single-target saccade trials for a standard reward. Once a stable response field was estimated, the monkey was run in either the two-target or three-target task. We recorded 27 neurons from two monkeys in the two-target task (monkey D, n = 17; monkey W, n = 10); all 27 neurons were recorded while the extra-RF value was varied, and a subset of neurons (n = 16) was recorded with the RF value varied as well. Neural activity was recorded while monkeys performed five to eight blocks of the two-target task, with extra-RF value modulation blocks completed before RF value modulation blocks were presented.
We recorded an additional 62 neurons from two monkeys in the three-target task (monkey W, n = 31; monkey B, n = 31) under the primary MED-RF condition. Finally, we recorded from 45 neurons (9 neurons also run under the medium condition and an additional 36 neurons) under either the LOW-RF or HIGH-RF condition versions of the three-target task. Some of these neurons (n = 18) were run in more than one value condition: 14 neurons in two conditions (seven both LOW-RF conditions, three LOW-RF and MED-RF, one LOW-RF and HIGH-RF, and three MED-RF and HIGH-RF) and 4 neurons in three conditions (three LOW-RF, MED-RF, and HIGH-RF; one both LOW-RF conditions and HIGH-RF). Given the relatively small number of neurons recorded in multiple Vin conditions, we restricted analyses across all value conditions to the population responses. In the three-target task, neural data was recorded during a single session of interleaved choice-context trials as described above (minimum of 140 trials).
Data analysis.
The primary analyses presented here examine the influence of the reward associated with extra-RF saccade targets on neuronal firing rates. For both tasks, the initial 10 trials in a block were discarded to avoid learning effects. Activity was primarily examined in the 1000 ms epoch immediately following peripheral target presentation in both the two-target and three-target tasks. This epoch represents the entire period of target array presentation before the signal identifying the saccade target; the general results presented here are not sensitive to the exact definition of this epoch. Because this period precedes the presentation of the saccade instruction signal in both the two- and three-target tasks, analysis of neural data included all trials regardless of the ultimate direction of the saccade. For population analyses, individual neuron firing rates were normalized by the peak neural firing rate observed in the single-target RF mapping trials. Because neurons are normalized to activity in identical trial types, this method of normalization allows comparison of relative levels of activity across neurons recorded under different value conditions; note that activity normalized in this manner is not constrained to be between 0 and 1.
In the three-target task, the influence of extra-RF target value and relative position (distance from RF target) on LIP activity was examined using analysis of covariance (ANCOVA). For every neuron, we calculated a suppression index (SI) for each extra-RF target:
where Rin is the average firing rate (0–1000 ms after stimulus onset) when the RF target is presented alone, and Rin+out is the average firing rate in dual target trials when the RF target is presented in conjunction with a single extra-RF target. Thus, two SI values were quantified for each neuron, corresponding to the influence of either the small or large extra-RF target. To examine the influence of both visuospatial distance and value on LIP activity, we used ANCOVA with SI as the dependent variable, relative target position (distance between RF and extra-RF targets) as a continuous independent variable, and value (small, large) as a categorical independent variable.
In the three-target task, we examined how well LIP activity was characterized by two previously proposed models of LIP value representation (fractional and difference) and two novel models (simple and full divisive normalization). The fractional model predicts that LIP activity (R) is a simple linear function of the RF target value normalized by the total sum of target values available:
where Vin is the RF target value, Vout is the sum of extra-RF target values, and a and b are fit parameters. The difference model predicts that LIP activity is a simple linear function of the difference between RF target value and summed extra-RF target values:
The simple divisive normalization model, analogous to the cortical normalization algorithm proposed for sensory cortex, predicts that activity is a two-parameter, nonlinear function of RF and extra-RF target values:
The full divisive normalization model replicates the simple normalization model but includes an additional baseline parameter:
Each of the models was fit to individual LIP neuron firing data in the 1000 ms target array epoch by either simple linear regression or nonlinear regression. In addition, the four different models of LIP value representation were also fit to the mean normalized population activity. To compare the goodness of fit of the various models, we used Akaike's information criterion (AIC):
where k is the number of parameters and L is the likelihood, estimated from the residual sum of squares.
Leave-one-out cross-validation was used to examine the performance of the different value representation models in out-of-sample prediction for the three-target task data. For cross-validation of the MED-RF condition data set, the mean responses of a single neuron in the seven different value context conditions were used as test data, whereas the mean responses of the remaining neurons were used as training data; this analysis was repeated so that each neuron was used as test data exactly once. For cross-validation of the entire data set (LOW-RF, MED-RF, and HIGH-RF conditions together), the mean responses of a single neuron under all value conditions in which it was recorded were used as test data, with the responses of the remaining neurons comprising the training data. The accuracy of the different models was quantified as the mean squared error across all test analyses.
Results
Two-alternative neural data
We first examined the response of LIP neurons during a two-target saccade task, in which monkeys were instructed to make a saccade to one of two targets with equal probability. One target was always placed inside the RF of the isolated LIP neuron, and the other target was placed in the opposite hemifield. In a given block of trials, reward magnitudes were fixed; across blocks, reward magnitudes associated with targets within the response field (Vin) and outside the response field (Vout) were independently varied (Fig. 1A). The value of a given target was equated with the associated reward magnitude. Here we use the term “context” to refer to the values associated with any available extra-RF targets in a given trial.
To confirm that LIP neurons are modulated by the value of the target located in the RF, we examined LIP activity as a function of Vin while Vout was held constant. Consistent with previous reports, we found that LIP activity was strongly modulated by RF target value, as shown for an example neuron and the population response (Fig. 1B). Activity in the majority of studied neurons was significantly positively correlated to Vin (p < 0.05, Pearson's correlation; n = 12 of 16; 75.0%), an effect that was significant across the population (mean correlation, 0.33; p = 1.6 × 10⁻⁵, t test) and evident in the mean firing rates (Fig. 1C).
How do intraparietal neurons respond to the value of targets that lie outside the classical RF? Previous studies have framed LIP activity in terms of gain ratio (Platt and Glimcher, 1999) or fractional income (Sugrue et al., 2004; Corrado et al., 2005), both of which assume a fractional reward representation based on Vin/(Vin + Vout), but no study has isolated the effect of manipulating extra-RF target value alone. We found that when the value of the target outside the RF was explicitly varied (with RF target value fixed), LIP activity was negatively modulated by Vout, shown for both an example neuron and the population activity (Fig. 1D). Correlation analysis showed that this suppressive modulation was significantly negative for the majority of LIP neurons (p < 0.05, Pearson's correlation; n = 18 of 27; 66.7%) and significant across the population (mean correlation, −0.21; p = 1.2 × 10⁻⁵, t test). Additionally, we performed multiple regression analysis for each individual neuron using both Vout and latency to saccade as regressors. Of the recorded neurons, firing rate was significantly dependent on only value in 16 neurons and on only latency in 1 neuron, suggesting that the observed modulation of LIP activity was primarily driven by the value context and not motivational or motor factors. This negative relationship between activity and extra-RF target value is evident in the mean population firing rates, plotted for the initial 1000 ms after target presentation (Fig. 1E). Thus, activity was both an increasing function of Vin and a decreasing function of Vout, suggesting that LIP value representation is relative rather than absolute; we explore the specific algorithm underlying this relative representation below.
We also examined whether behavior varied in some general way as a function of extra-RF target value, as such differences in behavior could explain context-dependent neural modulation. However, examination of fixation break frequencies, saccade error rates, and saccadic reaction times revealed no consistent dependence of behavior on Vout. Fixation break frequencies were low in both monkeys (monkey D, 9.2%; monkey W, 1.6%); in monkey W, these frequencies did not differ across Vout conditions [χ2(4) = 5.6; p = 0.23], whereas in monkey D, these frequencies differed across conditions [χ2(4) = 20.6; p = 0.0004] but were not significantly correlated with Vout magnitudes (r = −0.87; p = 0.06). Similarly, the rate of incorrect saccadic choices did not vary consistently with Vout; both monkeys exhibited high success rates (>90%), with error rates independent of Vout condition in monkey W [χ2(4) = 4.5; p = 0.34] and dependent but not significantly related to Vout in monkey D [χ2(4) = 14.4, p = 0.006; r = −0.40, p = 0.51]. Finally, reaction times for saccades toward the RF target across the different value contexts did not differ across different Vout conditions in either monkey (monkey D, p = 0.97; monkey W, p = 0.20; one-way ANOVA). Notably, saccade latencies toward the RF target did depend on the value of the RF target (p < 0.005 in both monkeys, one-way ANOVA) and became smaller as Vin increased (monkey D: r = −0.11, p = 0.026; monkey W: r = −0.30, p = 2.11 × 10⁻¹⁵), indicating that the animals were sensitive to the reward volumes used in the task.
Three-alternative neural data
These data identify a relative rather than absolute representation of value in area LIP, combining value information about a saccade into the RF with information about an alternative, extra-RF eye movement. To more fully characterize parietal value coding, we studied 62 additional LIP neurons from two monkeys while they performed a three-target saccade task. Monkeys fixated a central cue and were presented with one, two, or three targets, each of which was associated with a different magnitude of water reward (Fig. 2A). After target presentation (1000 ms), monkeys were subsequently instructed to select one of the presented targets. During recording sessions in the MED-RF condition, the medium reward (130 μl) target was placed in the RF, and the small (65 μl) and large (260 μl) reward targets were placed outside the RF, typically in the opposite hemifield; target locations and reward associations were fixed during an individual session, but identical reward values were used across sessions. Each trial in a session thus consisted of one of seven possible target arrays, presented randomly and with equal probability (three single-target, three double-target, and one triple-target trials). Note that each target array entails a unique combination of value, or value context, associated with the target in the RF (Vin) and values available outside the RF (Vout).
As in the two-target task, analysis of fixation break frequencies, saccade error rates, and saccadic reaction times revealed no consistent dependence of behavior on the configuration of targets. Both monkeys had low fixation break frequencies during cue presentation (monkey W, 2.8%; monkey B, 4.0%) that were uncorrelated with total value in both monkeys individually (monkey W: r = −0.36, p = 0.42; monkey B: r = 0.28, p = 0.54) and combined across animals (r = 0.04; p = 0.90). Because only the target cue remained visible after saccade instruction, both monkeys made very few errors (average error rates: monkey W, 2.1%; monkey B, 0.2%). For both animals, saccade errors rates to the medium and large targets were independent of target configuration (p > 0.1, χ2 test). For saccades to the small target, error rates varied by target configuration [monkey B: χ2(3) = 13.4, p = 0.004; monkey W: χ2(3) = 17.2, p = 0.0006] but were correlated with total value in only one monkey (monkey B: r = 0.83, p = 0.167; monkey W: r = 0.95, p = 0.047) and uncorrelated across the combined data (r = 0.35; p = 0.401). Unlike in the two-target task, reaction times varied by value context (each saccade target value condition in each monkey; p < 0.05, one-way ANOVA); however, mean reaction times were significantly correlated with the value of the target configuration earlier in the trial for only one target value in one monkey (monkey B: low: r = −0.363, p = 0.637; medium: r = −0.934, p = 0.066; high: r = −0.301, p = 0.699; monkey W: low: −0.907, p = 0.093; medium: r = −0.990, p = 0.010; high: r = −0.573, p = 0.428). Together, these measures indicate that behavioral factors such as motivation or vigilance remained relatively constant across different value context conditions.
How does the composition of target values outside the RF affect LIP firing rates? We observed that stimulus-driven activity, elicited by the appearance of the target in the RF, was a consistent function of the total amount of reward available, despite the fact that RF target value remained constant. Figure 2B (left) shows representative data from a single neuron recorded during the three-target task, segregated by target configuration condition. Consistent with the results described above, increasing the value of the target outside the RF in the two-target conditions decreased LIP firing rates (red, orange). Furthermore, activity was also a function of target number, decreasing from single-target (black) to double-target (red, orange) to triple-target (yellow) conditions. These effects can be quantified together by examining the correlation between trial-by-trial spike rates (0–1000 ms after target onset) and the summed values of extra-RF targets presented (r = −0.142; p = 0.026). The majority of LIP neurons were modulated by value context, with almost all neurons showing suppression (modulation: n = 33 of 62, 53.2%; suppression: n = 30 of 33, 90.9%); furthermore, suppression was significant across the population of neurons (mean correlation, −0.155; p = 2.6 × 10⁻⁶, t test) and evident in the mean population activity (Fig. 2C). To examine whether this modulation of stimulus-driven activity might reflect motivational or motor factors, we performed multiple regression analysis for each individual neuron using both Vout and latency to saccade as regressors. Of the recorded neurons, firing rate was significantly dependent on only value in 29 neurons, on both value and latency in 3 neurons, and on only latency in 1 neuron, suggesting that the observed modulation of LIP activity was primarily driven by the value context.
Existing research on value coding in LIP has focused on the modulation of RF stimulus-driven activity. However, we also observed a novel effect of total reward on firing rates in the absence of RF-driven activity, relative to the non-zero baseline firing rates (where baseline refers to the level of activity during fixation). As shown for the example neuron in Figure 2B, activity in trials without a target in the RF also varied as a function of Vout (r = −0.161; p = 0.037). This value modulation in the absence of RF stimulation was significant for a large fraction of LIP neurons (modulation: n = 27 of 62, 43.6%; suppression: n = 21 of 27, 77.8%) and significant across the population (mean correlation, −0.087; p = 0.0019, t test). Examination of the population-averaged firing rates shows that suppression below baseline levels follows a similar time course to value modulation of stimulus-driven activity, emerging soon after target onset and persisting until the saccadic instruction signal (Fig. 2C). As in the trials in which a target appeared in the RF, multiple regression analyses showed that activity in the absence of an RF target was primarily dependent on value and not latency to saccade (significant for value in 23 neurons, for value and latency in 3 neurons, and for latency in 6 neurons).
To further analyze the time course and extent of activity suppression both in the presence and in the absence of an RF target, we examined neural activity in 100 ms bins aligned to either peripheral target onset or saccade initiation. For each neuron, spiking activity was correlated with Vout; separate correlation analyses were conducted for trials with and without an RF target. For time points from peripheral target onset to saccade instruction cue, spiking data were aligned to time of target onset and included all trials. Our primary interest lay in this interval, in which we could examine how the number and value of alternatives modulated LIP activity before explicit saccade cueing and motor preparatory activity. As shown in Figure 3, the population of LIP neurons displayed Vout-dependent suppression in both RF target-present and RF target-absent conditions across much of the trial, with peak modulation occurring ∼200–300 ms after peripheral target onset. Across the population of neurons, the average correlation coefficient was significantly negative for most of the cue presentation interval in both RF target-present and RF target-absent conditions (p < 0.05, t test). Furthermore, of the neurons significantly modulated by total value, the large majority was suppressed by increasing extra-RF value in both conditions across the cue interval (Fig. 3) (at 300 ms; target present: 95.7%, 22 of 23 neurons; target absent: 78.3%, 18 of 23 neurons). For clarity (Fig. 3B), we plot histograms of correlation coefficients for two distinct windows (early visual, 100–400 ms; late visual, 700–1000 ms); the mean correlation coefficient in both these windows is significant and negative for both RF target-present (early visual: mean, r = −0.157; p = 6.0 × 10⁻¹¹; late visual: mean, r = −0.092; p = 1.4 × 10⁻⁴) and RF target-absent (early visual: mean, r = −0.090; p = 0.001; late visual: mean, r = −0.045; p = 0.047) conditions.
Figure 3.

Time course of value context modulation. A, Temporal analysis of value modulation in the three-target task, conducted in nonoverlapping adjacent 100 ms windows. For each neuron, spiking activity in each interval was correlated against extra-RF value; analysis was done separately for RF target-present (red) and RF target-absent (blue) trials. Top, Mean correlation coefficient (±SEM, shaded) across the population of LIP neurons; asterisks denote significance at p < 0.05 (t test). Bottom, Number of positively (dashed) and negatively (solid) significantly modulated neurons. B, Value modulation in three separate intervals: early visual (100–400 ms after cue onset), late visual (700–1000 ms after cue onset), and saccade (300–0 ms before saccade). Histograms show individual neuron correlation coefficients in RF target-present (red) and RF target-absent (blue) trials, with solid bars indicating significant neurons (p < 0.05).
Consistent with previous reports, many LIP neurons in this task possessed motor-related activity: a presaccadic increase in firing rate selective for saccades into the RF. To examine the extent of value-based modulation independent of this motor-related activity in this interval after saccade instruction, we restricted analyses to RF target-present trials requiring a saccade to the RF target; all RF target-absent trials were included. For time points after saccade instruction (disappearance of other targets), data were aligned to the time of saccade initiation. Initial examination of the population firing rate data (Fig. 2C) suggested a possible inversion in value modulation in trials with a saccade to the RF target, with higher activity in larger total value conditions; consistent with this finding, the number of neurons positively correlated with Vout increased slightly after the saccade cue is given (Fig. 3A, red dashed line). However, this increase was small and coexists with neurons suppressed by Vout; as a result, the average correlation coefficient across the population was not significant for any time point in the presaccadic interval (Fig. 3A) (p > 0.05, t test). In contrast, the average correlation coefficient in RF target-absent trials remained significantly negative. Figure 3B plots histograms for correlation coefficients in the 300 ms window preceding saccade initiation; consistent with the time-point analysis, average LIP activity is suppressed by Vout in RF target-absent conditions (mean, r = − 0.071; p = 3.7 × 10⁻⁴) and unmodulated in RF target-present conditions (mean, r = 0.024; p = 0.302). Notably, activity positively related to Vout was absent in the two-target task (Fig. 1C), suggesting that such activity may be a salience effect related to the instructional offset of the peripheral targets that only occurred in the three-target task.
Together, these results suggest that LIP encodes a context-dependent value representation, where the value configuration of the entire choice set controls both stimulus-driven and target-absent activity early in the valuation process. To ensure that these effects were driven by reward value rather than stimulus configuration, we examined the influence of visuospatial target location on LIP firing rates. One concern is that the differential modulation associated with small- and large-value extra-RF targets could have been driven by asymmetric target location relative to the location of the RF rather than by context-dependent value coding. However, examination of the relative target positions (distance from RF target) of small- and large-value alternative targets showed no discernible difference in the average relative position (distancesmall = 35.43°; distancelarge = 35.10°; p = 0.77, t test) or the relative position distributions (p = 0.98, two-sample Kolmogorov–Smirnov test) (Fig. 4, inset). To quantify the influence of both target value and location on firing rate, we examined the suppression of RF activity in dual target trials as a function of Vout (small or large) and relative target position (distance between RF and extra-RF targets). We found that suppression of RF-driven activity depended on extra-RF target value but on neither relative target distance nor the interaction of distance and value (value, p = 0.004; distance, p = 0.058; interaction, p = 0.793, ANCOVA). In other words, suppression was a function of Vout even when relative target positions were equivalent (Fig. 4). These results suggest that, as in the two-target data, the suppressive modulation observed in the three-target task was primarily controlled by the value of the alternative, extra-RF targets.
Figure 4.

Value modulation independent of relative spatial location. The effect of extra-RF target value and distance to the RF target on LIP activity during dual-target trials in the MED-RF condition three-target task. SI is defined as (Rin+out − Rin)/(Rin+out + Rin), where more negative SI values indicate greater suppression of RF activity. Data points represent the mean SI ± SEM as a function of distance, plotted separately for high-value (filled) and low-value (unfilled) alternative targets. Regression slopes were fit independently for the high- and low-value targets (solid and dashed lines, respectively). Inset, Distribution of distances from the RF for high- and low-value extra-RF targets; there was no significant difference in either the mean distance or distribution of distances. ANCOVA shows that suppression is significantly dependent on value (distance between lines) but not on relative distance (slope of lines) or the interaction between value and distance.
This effect of value context is clear when population activity is examined as a function of the combined Vin and Vout magnitude (Vtot), as shown in Figure 5. Despite constant Vin levels, activity in trials with a target in the RF (Fig. 5, solid red symbols) was suppressed as Vout increased. Similarly, in trials without a target in the RF (Fig. 5, solid blue symbols), activity decreased as a function of alternative target values. Because an essential feature of a relative value code is that it combines information about both the RF value (Vin) and the value context (Vout), we also recorded under different Vin conditions in 45 LIP neurons: one condition with a high-value target in the RF (HIGH-RF, n = 17 neurons; RF target, 260 μl; extra-RF targets, 65 and 130 μl) and two conditions with a low-value target in the RF (LOW-RF 1, n = 20 neurons; RF target, 65 μl; extra-RF targets, 130 and 260 μl; LOW-RF 2, n = 21 neurons; RF target, 65 μl; both extra-RF targets, 325 μl). Some neurons in this additional data set were run in more than one condition; see Table 1 for a summary of the different value conditions. As shown in Figure 5, population activity in the three-target task also depended on the value of the RF target, with progressively higher firing rates at larger levels of Vin. Below, we explore the specific computational algorithm underlying the coding of both Vin and Vout in this context-dependent, relative value representation.
Figure 5.
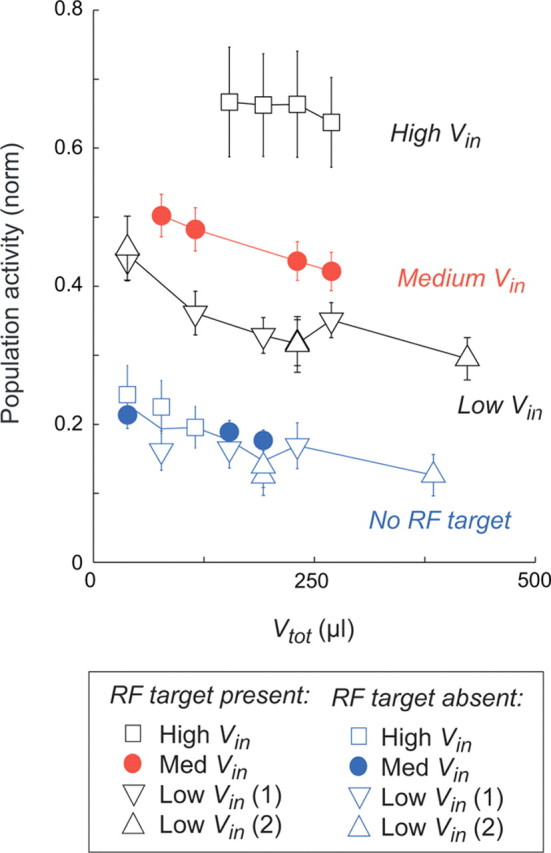
Population activity depends on the value of the entire choice set. Normalized population LIP responses decrease as a function of total value (Vtot). Filled circles represent mean ± SEM LIP activity in the 0–1000 ms after peripheral target onset in the MED-RF condition (Vin = 130 μl) three-target task, for conditions with (red) and without (blue) a target present in the RF. Open symbols represent data from the HIGH-RF condition (Vin = 260 μl; squares) and LOW-RF condition (Vin = 65 μl; inverted triangles, condition 1; triangles, condition 2) experiments; blue symbols indicate RF target-absent conditions.
Divisive normalization and value coding
What computational representation mediates this integration of all relevant value information? Initial studies of value coding in LIP (Platt and Glimcher, 1999; Sugrue et al., 2004) focused on a fractional representation of value because of its association with classic matching law behavior (Herrnstein, 1961). More recently, motivated by computational models of two-alternative choice behavior, some researchers have suggested that the difference in option values may better describe LIP activity (Corrado et al., 2005). However, whereas both the fractional and difference models are consistent with LIP value modulation, neither theoretical proposal is directly based on the structure and function of cortical circuits. To examine whether context-dependent value representation could arise from known characteristics of cortical function, we evaluated LIP activity in terms of value-based divisive normalization.
Early models of striate cortex described visual neuron function as a linear operation, producing responses that are weighted sums of relevant inputs (Hubel and Wiesel, 1962, 1968; Movshon et al., 1978). Although such linear models accurately characterized basic visual neuron responses such as orientation and direction selectivity, they could not explain more complicated, nonlinear phenomena such as contrast saturation and nonspecific suppression. To address these issues, Heeger (1992) proposed that visual cortical function involves a normalization stage, where a given cell's response is divided by a quantity representing the pooled activity of a large number of other similar neurons. This divisive normalization model explains a number of nonlinear phenomena in striate and extrastriate cortex (Carandini et al., 1997; Britten and Heuer, 1999; Cavanaugh et al., 2002; Heuer and Britten, 2002) as well as responses in the ventral visual stream (Zoccolan et al., 2005). Furthermore, normalization-style models yield efficient coding of natural signal statistics in both visual and auditory modalities (Schwartz and Simoncelli, 2001; Valerio and Navarro, 2003) and may play a role in attentional processing (Reynolds et al., 1999; Reynolds and Heeger, 2009), suggesting that divisive normalization may serve as a canonical computational algorithm in cortical circuits.
To examine whether divisive normalization can explain LIP value modulation, we compared how well the fractional, difference, and divisive normalization value representations predicted LIP activity in the three-target task. We focused on activity during peripheral target presentation (0–1000 ms after target onset), before the delivery of the instruction cue. For each neuron and RF value condition, the individual models were fit to the observed firing rates across the seven value context conditions. In trials with less than three presented targets, absent targets were assigned a value of zero. For the fractional representation, firing rates (R) were modeled as a linear function of the fractional value:
For the difference representation, firing rates were modeled as a linear function of the difference between RF value and the sum of extra-RF target values:
The essential component of the normalization model is a divisive stage, wherein a single neuron's response is divided by a quantity dependent on pooled responses. For the simple normalization representation, firing rates were modeled as a nonlinear function of Vin and Vout:
where Vin is the RF target value, Vout is the sum of extra-RF target values, and Rmax and σ are gain and semisaturation terms, respectively. In addition, we examined a full normalization model:
where β is a constant representing a non-zero baseline firing rate (Reynolds and Heeger, 2009). The term β controls the theoretical level of activity when no peripheral targets are presented and the animals fixate through the duration of the trial (a quantity predicted to be Rmax *β /σ). Both these models are analogous to established sensory coding models, modified to represent target value rather than visual stimulus characteristics.
We first examined how well the different value coding models predicted individual neural responses. Figure 6(left column) plots the predicted versus observed activity for each of the different value representation models, with each point denoting a single neuron in a particular value condition; these data represent all neural data in the MED-RF, HIGH-RF, and LOW-RF conditions. Compared with the fractional (Fig. 6A) and difference (Fig. 6B) models, the divisive normalization models (Fig. 6C,D) more accurately predicted activity when a target appeared inside the RF. However, the simple normalization model failed to predict the suppression below baseline levels observed in the absence of RF stimulation; only the full normalization model fully predicted the modulation of both RF-driven and baseline activity. To quantify the relative performance of the different models, we calculated the AIC for each neuron under every model; the AIC provides an information theoretic basis for model comparison that considers both goodness of fit and parsimony (Akaike, 1974). Examination of the AIC values confirmed that the full divisive normalization model was the most likely of these underlying value representations in the vast majority of LIP neurons (MED-RF condition: n = 53 of 62, 85.5%; HIGH-RF condition: n = 16 of 17, 94.1%; LOW-RF conditions: n = 26 of 41, 61.9%).
Figure 6.

Divisive normalization predicts value modulation. Shown is predicted versus observed firing rate data under different proposed value coding algorithms: A, fractional; B, difference; C, simple divisive normalization; D, full divisive normalization. Left column, Predictions when model parameters were fit separately for each individual neuron, for all neurons across the LOW-RF, MED-RF, and HIGH-RF conditions. Middle column, Predictions when model parameters were fit to the population data in the MED-RF condition. Right column, Predictions when model parameters were fit to the population data across all conditions. Each point represents predicted and observed data under a specific choice set condition.
To examine the population responses, we fit each value model to the firing rate data; Figure 6 (middle column) shows the predicted mean population response from each model as a function of observed firing rates in the MED-RF condition data set (Vin = 130 μl). The fractional and simple normalization models failed to account for suppression in the absence of an RF target; because both models incorporate only the quantity Vin in the numerator, they predicted constant levels of activity in all RF target absent conditions (simple normalization, r = 0; fractional, r = a). In contrast, the difference model predicted suppression even in RF target-absent conditions; however, it could not adequately model both the RF target-driven and RF target-absent effects simultaneously. As seen in Figure 7, the full normalization equation (Rmax = 3.86; σ = 1541 μl; β = 87.6 μl) characterized LIP responses in both conditions, which is evident when the best-fit normalization model (black lines) is compared with the population responses (red and blue points). Examination of AIC values confirmed that the full normalization model best explained the MED-RF condition data (AICfract = −31.8; AICdiff = −26.5; AICnorm_simp = −21.9; AICnorm_full = −70.9). Thus, like the individual neuron data, the population LIP response was best characterized by the full divisive normalization model. To examine the predictive power of the models, we performed leave-one-out cross-validation (see Materials and Methods); of the four different models, full divisive normalization produced the lowest mean squared error in out-of-sample prediction (MSEdiff = 0.0483; MSEfract = 0.0439; MSEnorm_simp = 0.0559; MSEnorm_full = 0.0401), with the next best model (fractional) generating ∼10% higher mean squared error. Together, these results indicate that full divisive normalization outperformed the alternative models in terms of both response characterization and predictive power.
Figure 7.

Population activity characterized by the divisive normalization model. Normalized population LIP responses as a function of 1/(Vin + Vout) are shown. Filled circles represent mean ± SEM LIP activity in the 0–1000 ms after peripheral target onset; open symbols represent the different conditions as described in the legend and used in Figure 5. Black lines, The best-fit full divisive normalization model to the MED-RF condition population data; gray lines, the best-fit full divisive normalization model to neuronal data across all conditions. Fit parameters for the MED-RF condition data alone are as follows: Rmax = 3.86, σ = 1541 μl, β = 87.6 μl; fit parameters for all Vin value conditions together are as follows: Rmax = 2.96, σ = 1161 μl, β = 92.6 μl.
If normalization provides a general framework for relative value coding, it should also describe how LIP activity responds to the value of targets within the RF. To explore the robustness of the divisive normalization model directly, we next fit the different value models to neural data combined across the different value conditions (MED-RF, HIGH-RF, and two LOW-RF conditions). The predictions of the best-fit models are shown in Figure 7 (full divisive normalization model) and Figure 8(fractional, difference, and simple normalization models). Note that activity is plotted against the quantity 1/(Vin + Vout) to emphasize the behavior of the fractional model: at constant Vin, the fractional model predicts a linear response, whereas the normalization models predict a saturating response where the degree of curvature is controlled by the parameter σ. When examined across all data conditions, the full divisive normalization model explained the full data set (R2 = 0.961) far better than the fractional (R2 = 0.730), difference (R2 = 0.601), or simple normalization (R2 = 0.219) models (Fig. 6, right column). As shown in Figure 7, the full divisive normalization model (gray lines; Rmax = 2.96; σ = 1161 μl; β = 92.6 μl) accurately predicted population activity changes induced by both changing context outside the RF (changes along the curves) and changing value within the RF (changes between the curves). The failure of the alternative models is evident in Figure 8, which plots the observed data and the best-fit fractional, difference, and simple normalization models examined across all conditions, in the same coordinates used in Figure 7. As noted previously, the fractional model failed to account for background suppression in the absence of an RF target, evident as a horizontal line in predicted activity (Fig. 6A); furthermore, the predicted linear responses correspond poorly to the observed nonlinear activity. The difference model predicted some RF target-absent suppression but performed particularly poorly in characterizing the range of responses to different Vin conditions. In the simple normalization model, the constraint requiring zero activity in RF target-absent conditions prevented the model from accurately predicting responses at other Vin magnitudes. Examination of AIC values confirmed that, of the examined models, the full normalization model best characterized the population data, even when accounting for the additional parameter (AICfract = −131.3; AICdiff = −120.4; AICnorm_simp = −101.5; AICnorm_full = −183.0). Finally, in cross-validation analysis of the combined neural data, the full divisive normalization model performed with the highest accuracy in out-of-sample prediction (MSEdiff = 0.0482; MSEfract = 0.0440; MSEnorm_simp = 0.0593; MSEnorm_full = 0.0393).
Figure 8.
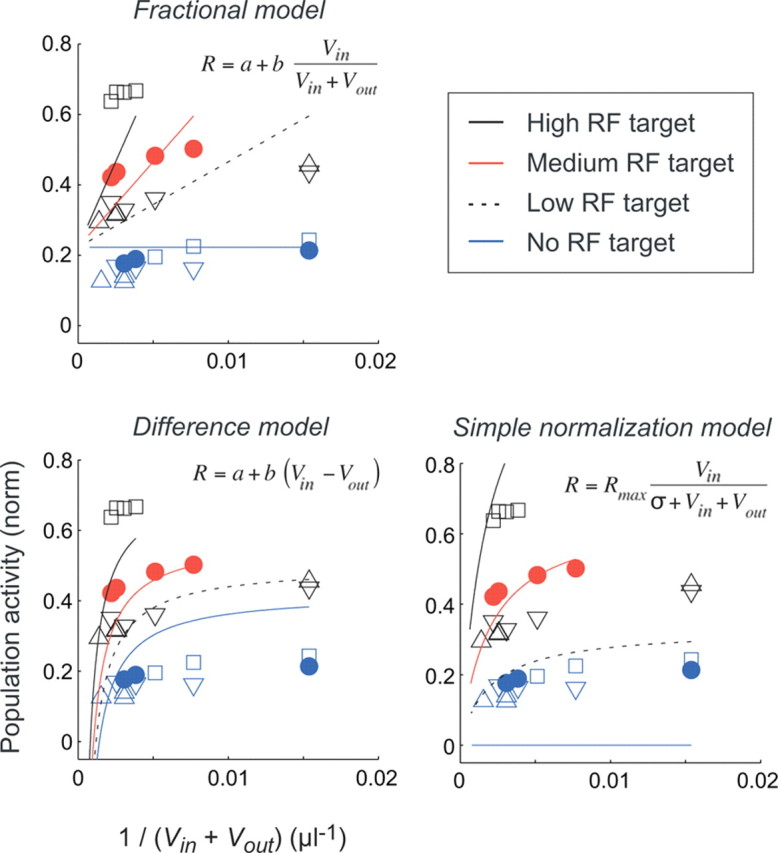
Model comparison of alternative value representations. Symbols plot average LIP population activity as a function of the quantity 1/(Vin + Vout); each point represents a specific value condition defined by the Vin and Vout values, and symbols correspond to conditions as described in the main text and Figure 7. Error bars are omitted for clarity but are identical to those in Figure 7. Lines plot predicted activity using the fractional (top), difference (bottom left), and simple normalization (bottom right) models; each model was fit to all value condition data simultaneously. For visualization, the model predictions for different RF target values are plotted as separate lines, as shown in the legend; colors are matched to the corresponding observed data points.
To examine the implications of different value representations, we plot in Figure 9 the predicted activity of the fractional and full divisive normalization models as a function of both Vin and Vout; for comparison, we also show an absolute value representation (FR ∝ Vin). Although both the fractional and normalization models predict saturating responses as RF value increases, under normalization the system shifts between representing absolute and relative value due to the presence of the semisaturation term σ in the denominator. Specifically, the normalization model predicts that activity will primarily reflect RF reward when total value (Vin + Vout) is small (V ≪ σ), and the term σ dominates the denominator. This coding approximates an absolute value code, where the value of extra-RF targets exerts little control over activity (Fig. 9, vertical shading and vertical contour lines). However, at intermediate total values (V ∼ σ), the denominator in the normalization model depends on both total value and σ, and activity grows increasingly sensitive to choice context, similar to a fractional model (Fig. 9, angled shading and angled contour lines). At much larger values (V ≫ σ), the divisive normalization model approaches pure fractional value coding as σ becomes negligible. Thus, divisive normalization implements an adaptive form of gain control, adjusting the input–output function from absolute to relative value as total value increases.
Figure 9.

Functional implications of divisive normalization on value coding. Predicted LIP population activity as a function of Vin and Vout in absolute value (left), full divisive normalization (middle), and fractional value (right) models. Model parameters were obtained from the best-fit to the three-target neural data, in all conditions (divisive normalization parameters: Rmax = 2.96, σ = 1161 μl, β = 92.6 μl). Note that the absolute value model (FR = a + b × Vin) was excluded from the primary analyses because it cannot explain contextual value effects but is included here for comparison with the normalization representation. The scale bar represents normalized population activity. When values are low relative to σ, activity approximates an absolute value code, evident as near-vertical lines in the contour plots (bottom left). When values are higher, value coding becomes more relative similar to the fractional representation, evident as angled shading in the contour plots (bottom right).
Discussion
We show here that LIP encodes value in a context-dependent manner, incorporating the values of both a saccade to the RF and other alternative saccades. In a two-target task explicitly manipulating Vin or Vout, LIP activity encoded a relative rather than absolute function of saccade value; in a three-target task spanning a more complete sample of value space, model comparison revealed an underlying divisive normalization computation. Thus, individual parietal neurons integrate information from RF-driven activity with that involving surrounding regions of visual space, a contextual effect analogous to phenomena in early visual cortex associated with extra-classical receptive field effects. Across the network of neurons in LIP, suppression of RF target activity by extra-RF targets implements a value-based scaling of the most active neurons, a form of adaptive gain control. Whereas the functional implications of background activity suppression in the absence of an RF target are less clear, given the low firing rates, such suppression suggests that the inhibitory mechanism underlying normalization is not limited to stimulus-driven neurons but functions throughout the entire parietal network.
These results show that the value of targets situated far from the RF can modulate both stimulus-driven activity and activity in the absence of direct feed-forward RF drive. In the three-target task, extra-RF targets were far from the RF center (average, 35°) and located primarily in the opposite visual hemifield. Targets at these locations did not activate the recorded neuron when presented alone, consistent with a contralateral visual bias in LIP (Ben Hamed et al., 2001; Patel et al., 2010). Across the population, suppression was independent of the relative spatial location of the extra-RF target, supporting a modulation driven primarily by target value rather than spatial location. This is consistent with the two-target task results, where different values in the same extra-RF location differentially modulated LIP activity. However, visuospatial parameters may influence suppressive interactions when alternative targets are situated very close to the RF (analogous to stimulus presentation in the suppressive surround of visual cortical neurons). In our spatial analysis, alternative targets closer to the RF yielded slightly higher suppression effects that did not reach significance (p = 0.058), leaving open the possibility that such interactions may become important at nearer distances than those examined here. Such an effect would be expected if divisive inhibition is mediated by lateral connections as suggested for other cortical regions, but further study is required to determine the source of this normalization.
By applying a specific algorithmic model to value coding, our results extend previous findings about the influence of both relative value and number of choice options on parietal activity. Initial results demonstrating LIP modulation by RF target value were consistent with a relative reward code; suggested representations included fractional (Platt and Glimcher, 1999; Sugrue et al., 2004) or differential (Corrado et al., 2005) value, but previous studies did not examine this issue directly by explicitly manipulating the value of alternative saccadic options. A separate line of evidence suggests that the number of alternatives (choice set size) scales parietal activity. In a covert visual search task, LIP neurons show graded activity that declines with the number of presented distractors (Balan et al., 2008). Similarly, in a motion-discrimination task with varying numbers of alternatives, LIP activity is lower when four choices are presented rather than two choices (Churchland et al., 2008). The strongest effect of choice set size in the latter task occurs at the beginning of the decision process, both before and during motion stimulus viewing, but eventually activity reaches a similar threshold level before choice. These temporal dynamics are consistent with the timing of value representation in LIP, which predominates early in the decision process but is eventually outweighed by the representation of choice (Platt and Glimcher, 1999; Louie and Glimcher, 2010). One important prediction of the normalization model is that modulation by the number of alternatives should reflect not simple set size but the underlying effect of target uncertainty on value; such a relationship exists in the superior colliculus, where target uncertainty mediates the inverse relationship between the number of alternatives and activity (Basso and Wurtz, 1998). A normalized value representation provides a single integrated mechanism for the dependence of decision-related neural activity on both relative value and set size.
The implementation of relative value coding via divisive normalization rather than strict fractional value has implications in several domains. First, a divisive normalization representation produces a value coding that is functionally distinct from fractional value (Fig. 9). As a result of nonlinearity introduced by the semisaturation term (σ), the divisive normalization representation can produce responses on a continuum between absolute and relative value coding; this form of adaptive gain control depends on the relative balance between total value and σ. This behavior parallels the dependence of response amplitude on stimulus contrast in normalization models of V1, where the overall level of contrast determines between a monotonic or saturating response (Carandini et al., 1997). The value of σ derived from the present study is ∼1000 μl, a quantity large enough at normal volumes of reward to significantly shift value coding away from a strict fractional representation and toward a richer function of value context. Note that the biophysical implementation of σ remains unknown and it is possible that the circuits underlying value representation may also modulate σ to tune adaptive gain control. Second, these results link value coding in parietal cortex to a well characterized phenomenon in visual cortex. Divisive normalization was initially proposed to explain a number of nonlinear responses in striate cortex, including cross-orientation suppression, surround suppression, and contrast saturation. However, it has been suggested that normalization might be fundamental in other sensory as well as nonsensory brain areas (Heeger, 1992). Normalization characterizes stimulus interaction within the V1 RF (Carandini and Heeger, 1994; Carandini et al., 1997), as well as interactions between the RF center and nonclassical suppressive surround (Cavanaugh et al., 2002), and governs both single neuron and population responses (Busse et al., 2009; MacEvoy et al., 2009). Furthermore, stimulus interactions in visual areas beyond V1 are also governed by normalization, such as the responses to multiple motion stimuli in area MT (Britten and Heuer, 1999; Heuer and Britten, 2002) and multiple object stimuli in inferotemporal cortex (Zoccolan et al., 2005). Our results provide the first example of normalization outside a strictly sensory area and the most anterior extension of divisive normalization coding in the dorsal stream. Unlike previous electrophysiological studies, these findings support a normalization based not on stimulus characteristics, such as contrast or orientation, but on value. From a computational perspective, divisive inhibition has been shown to increase the independence of neural responses and allow for efficient encoding of sensory signals (Schwartz and Simoncelli, 2001) and to enhance the stability of recurrent neural networks (Chance and Abbott, 2000), leading to the idea that divisive normalization may be a canonical computation of cortical circuits. Whereas our findings are consistent with an algorithmic implementation of divisive normalization in value coding, the circuit mechanisms generating this representation remain unknown; such computations may emerge from fundamental properties of the neural circuit architecture (Kouh and Poggio, 2008), and identifying the underlying mechanism remains a critical direction for future work.
One important issue is the relationship between the observed value-guided normalization effects and attentional allocation. In addition to responses related to target selection and action value, LIP neurons also show activity associated with the allocation of covert attention, driven by intrinsic visual salience or task relevance (Bisley and Goldberg, 2003, 2010; Oristaglio et al., 2006). One intriguing possibility is that relative reward representation may be related to attentional processing through a common underlying divisive circuit mechanism. In addition to sensory processing, the divisive normalization model has been used to characterize attentional effects in visual cortex (Reynolds and Heeger, 2009). In their model, Reynolds and Heeger (2009) showed that a normalization computation combining stimulus and attentional activity with a divisive suppression explains a diverse array of experimental results and reconciles alternative models of attention. A critical feature of their model is the implementation of divisive suppression after the combined effect of stimulus and attentional drive, suggesting that attention may operate by tuning inputs to existing divisive normalization circuitry. This idea is supported by recent recordings in V4, in which attention modulates the gain of existing center-surround interactions, with increased suppression of RF activity when attention is directed toward stimuli in the RF surround (Sundberg et al., 2009). An attractive unifying hypothesis is that both reward and attention modulate neuronal activity by modulating the inputs to the normalization circuit, before divisive suppression. Although value and attention may function in a similar manner by tuning normalization inputs, this does not necessarily imply that they always function simultaneously and identically. For example, action value modulation may be important primarily in decision-related areas like LIP, whereas attentional modulation may need to function along the entire range of sensory areas (V1, MT, V4). Nevertheless, divisive normalization appears to serve as a common computational algorithm that implements the effects of both processes on neuronal activity.
Reward- and attention-based effects on neural activity are difficult to dissociate (Maunsell, 2004), raising the possibility that value-guided normalization may be itself mediated by attentional processes, with less attention allocated to the RF location as alternative values increase. However, several aspects of the current results are not easily reconcilable with a simple attentional effect. First, we find a monotonic relationship between the value of the target in the RF and LIP activity, as well as a parametric suppression related to the value of extra-RF targets. Most studies of attentional modulation in visual cortices instead show a binary change in modulation when spatial attention is cued either to the RF or outside the RF (Motter, 1993; McAdams and Maunsell, 1999; Bisley and Goldberg, 2003), consistent with a stepwise effect of attentional allocation on neuronal responses. Although there exists some evidence from tasks varying task difficulty that attentional modulation may be graded (Spitzer et al., 1988; Chen et al., 2008), no previous evidence exists for such a continuous, parametric effect of attention on neuronal responses. Second, we find that LIP activity in the absence of an RF target is differentially suppressed according to the value of a single extra-RF target, despite the fact that spatial attention is presumably localized to the extra-RF target in both cases. Whereas we cannot exclude a more complicated model of attention generating these results, such a model would require both a divided attentional allocation across at least three locations and an additional motivational or vigilance component to account for single extra-RF target results. Finally, when attention and parietal activity are examined together, LIP appears to specify the locus of attention rather than vary parametrically with the behavioral attentional advantage (Bisley and Goldberg, 2003, 2006). These results suggest that LIP activity, rather than mirroring the level of spatial attention, serves as a priority map to guide the attentional allocation process itself (Bisley and Goldberg, 2010).
The causal role of normalized value coding in generating context-dependent choice behavior remains to be explored, but these results suggest a possible explanation based on the inherent noise in cortical population codes. Cortical neurons exhibit considerable variability in their spiking activity, and information is likely represented by distributions of neurons and spiking rates (Tolhurst et al., 1983; Shadlen and Newsome, 1998; Pouget et al., 2003). In a normalized value system, the mean firing rates representing option values decrease as the number of alternatives (or the value of an irrelevant option) increases. Although the rank ordering of option desirability would not change, uncompensated variability (e.g., additive noise or correlated activity) could decrease the discriminability between the options as the distributions are normalized, leading to stochastic choice behavior that is dependent on the composition of the choice set (Tversky and Simonson, 1993; Shafir et al., 2002; Bateson et al., 2003). These results suggest that a fuller understanding of the neural mechanism of normalized value representation may provide new insights into decision making in complicated choice situations.
Footnotes
We are grateful to D. Burghart, E. Dewitt, and B. Lau for helpful discussions. We also thank M. Grantner, E. Ryklin, and S. Shaw for technical support.
References
- Akaike H. A new look at statistical-model identification. IEEE Trans Automat Control. 1974;19:716–723. [Google Scholar]
- Balan PF, Oristaglio J, Schneider DM, Gottlieb J. Neuronal correlates of the set-size effect in monkey lateral intraparietal area. PLoS Biol. 2008;6:e158. doi: 10.1371/journal.pbio.0060158. [DOI] [PMC free article] [PubMed] [Google Scholar]
- Basso MA, Wurtz RH. Modulation of neuronal activity in superior colliculus by changes in target probability. J Neurosci. 1998;18:7519–7534. doi: 10.1523/JNEUROSCI.18-18-07519.1998. [DOI] [PMC free article] [PubMed] [Google Scholar]
- Bateson M, Healy SD, Hurly TA. Context-dependent foraging decisions in rufous hummingbirds. Proc R Soc Lond B Biol Sci. 2003;270:1271–1276. doi: 10.1098/rspb.2003.2365. [DOI] [PMC free article] [PubMed] [Google Scholar]
- Ben Hamed S, Duhamel JR, Bremmer F, Graf W. Representation of the visual field in the lateral intraparietal area of macaque monkeys: a quantitative receptive field analysis. Exp Brain Res. 2001;140:127–144. doi: 10.1007/s002210100785. [DOI] [PubMed] [Google Scholar]
- Bisley JW, Goldberg ME. Neuronal activity in the lateral intraparietal area and spatial attention. Science. 2003;299:81–86. doi: 10.1126/science.1077395. [DOI] [PubMed] [Google Scholar]
- Bisley JW, Goldberg ME. Neural correlates of attention and distractibility in the lateral intraparietal area. J Neurophysiol. 2006;95:1696–1717. doi: 10.1152/jn.00848.2005. [DOI] [PMC free article] [PubMed] [Google Scholar]
- Bisley JW, Goldberg ME. Attention, intention, and priority in the parietal lobe. Annu Rev Neurosci. 2010;33:1–21. doi: 10.1146/annurev-neuro-060909-152823. [DOI] [PMC free article] [PubMed] [Google Scholar]
- Britten KH, Heuer HW. Spatial summation in the receptive fields of MT neurons. J Neurosci. 1999;19:5074–5084. doi: 10.1523/JNEUROSCI.19-12-05074.1999. [DOI] [PMC free article] [PubMed] [Google Scholar]
- Busse L, Wade AR, Carandini M. Representation of concurrent stimuli by population activity in visual cortex. Neuron. 2009;64:931–942. doi: 10.1016/j.neuron.2009.11.004. [DOI] [PMC free article] [PubMed] [Google Scholar]
- Carandini M, Heeger DJ. Summation and division by neurons in primate visual cortex. Science. 1994;264:1333–1336. doi: 10.1126/science.8191289. [DOI] [PubMed] [Google Scholar]
- Carandini M, Heeger DJ, Movshon JA. Linearity and normalization in simple cells of the macaque primary visual cortex. J Neurosci. 1997;17:8621–8644. doi: 10.1523/JNEUROSCI.17-21-08621.1997. [DOI] [PMC free article] [PubMed] [Google Scholar]
- Cavanaugh JR, Bair W, Movshon JA. Nature and interaction of signals from the receptive field center and surround in macaque V1 neurons. J Neurophysiol. 2002;88:2530–2546. doi: 10.1152/jn.00692.2001. [DOI] [PubMed] [Google Scholar]
- Chance FS, Abbott LF. Divisive inhibition in recurrent networks. Network. 2000;11:119–129. [PubMed] [Google Scholar]
- Chen Y, Martinez-Conde S, Macknik SL, Bereshpolova Y, Swadlow HA, Alonso JM. Task difficulty modulates the activity of specific neuronal populations in primary visual cortex. Nat Neurosci. 2008;11:974–982. doi: 10.1038/nn.2147. [DOI] [PMC free article] [PubMed] [Google Scholar]
- Churchland AK, Kiani R, Shadlen MN. Decision-making with multiple alternatives. Nat Neurosci. 2008;11:693–702. doi: 10.1038/nn.2123. [DOI] [PMC free article] [PubMed] [Google Scholar]
- Corrado GS, Sugrue LP, Seung HS, Newsome WT. Linear-nonlinear-Poisson models of primate choice dynamics. J Exp Anal Behav. 2005;84:581–617. doi: 10.1901/jeab.2005.23-05. [DOI] [PMC free article] [PubMed] [Google Scholar]
- Dorris MC, Glimcher PW. Activity in posterior parietal cortex is correlated with the relative subjective desirability of action. Neuron. 2004;44:365–378. doi: 10.1016/j.neuron.2004.09.009. [DOI] [PubMed] [Google Scholar]
- Heeger DJ. Normalization of cell responses in cat striate cortex. Vis Neurosci. 1992;9:181–197. doi: 10.1017/s0952523800009640. [DOI] [PubMed] [Google Scholar]
- Herrnstein RJ. Relative and absolute strength of response as a function of frequency of reinforcement. J Exp Anal Behav. 1961;4:267–272. doi: 10.1901/jeab.1961.4-267. [DOI] [PMC free article] [PubMed] [Google Scholar]
- Heuer HW, Britten KH. Contrast dependence of response normalization in area MT of the rhesus macaque. J Neurophysiol. 2002;88:3398–3408. doi: 10.1152/jn.00255.2002. [DOI] [PubMed] [Google Scholar]
- Hubel DH, Wiesel TN. Receptive fields, binocular interaction and functional architecture in the cat's visual cortex. J Physiol. 1962;160:106–154. doi: 10.1113/jphysiol.1962.sp006837. [DOI] [PMC free article] [PubMed] [Google Scholar]
- Hubel DH, Wiesel TN. Receptive fields and functional architecture of monkey striate cortex. J Physiol. 1968;195:215–243. doi: 10.1113/jphysiol.1968.sp008455. [DOI] [PMC free article] [PubMed] [Google Scholar]
- Huk AC, Shadlen MN. Neural activity in macaque parietal cortex reflects temporal integration of visual motion signals during perceptual decision making. J Neurosci. 2005;25:10420–10436. doi: 10.1523/JNEUROSCI.4684-04.2005. [DOI] [PMC free article] [PubMed] [Google Scholar]
- Iyengar SS, Lepper MR. When choice is demotivating: can one desire too much of a good thing? J Pers Soc Psychol. 2000;79:995–1006. doi: 10.1037//0022-3514.79.6.995. [DOI] [PubMed] [Google Scholar]
- Kouh M, Poggio T. A canonical neural circuit for cortical nonlinear operations. Neural Comput. 2008;20:1427–1451. doi: 10.1162/neco.2008.02-07-466. [DOI] [PubMed] [Google Scholar]
- Louie K, Glimcher PW. Separating value from choice: delay discounting activity in the lateral intraparietal area. J Neurosci. 2010;30:5498–5507. doi: 10.1523/JNEUROSCI.5742-09.2010. [DOI] [PMC free article] [PubMed] [Google Scholar]
- Luce RD. Individual choice behavior. New York: Wiley; 1959. [Google Scholar]
- MacEvoy SP, Tucker TR, Fitzpatrick D. A precise form of divisive suppression supports population coding in the primary visual cortex. Nat Neurosci. 2009;12:637–645. doi: 10.1038/nn.2310. [DOI] [PMC free article] [PubMed] [Google Scholar]
- Maunsell JH. Neuronal representations of cognitive state: reward or attention? Trends Cogn Sci. 2004;8:261–265. doi: 10.1016/j.tics.2004.04.003. [DOI] [PubMed] [Google Scholar]
- McAdams CJ, Maunsell JH. Effects of attention on orientation-tuning functions of single neurons in macaque cortical area V4. J Neurosci. 1999;19:431–441. doi: 10.1523/JNEUROSCI.19-01-00431.1999. [DOI] [PMC free article] [PubMed] [Google Scholar]
- Motter BC. Focal attention produces spatially selective processing in visual cortical areas V1, V2, and V4 in the presence of competing stimuli. J Neurophysiol. 1993;70:909–919. doi: 10.1152/jn.1993.70.3.909. [DOI] [PubMed] [Google Scholar]
- Movshon JA, Thompson ID, Tolhurst DJ. Spatial summation in the receptive fields of simple cells in the cat's striate cortex. J Physiol. 1978;283:53–77. doi: 10.1113/jphysiol.1978.sp012488. [DOI] [PMC free article] [PubMed] [Google Scholar]
- Oristaglio J, Schneider DM, Balan PF, Gottlieb J. Integration of visuospatial and effector information during symbolically cued limb movements in monkey lateral intraparietal area. J Neurosci. 2006;26:8310–8319. doi: 10.1523/JNEUROSCI.1779-06.2006. [DOI] [PMC free article] [PubMed] [Google Scholar]
- Patel GH, Shulman GL, Baker JT, Akbudak E, Snyder AZ, Snyder LH, Corbetta M. Topographic organization of macaque area LIP. Proc Natl Acad Sci U S A. 2010;107:4728–4733. doi: 10.1073/pnas.0908092107. [DOI] [PMC free article] [PubMed] [Google Scholar]
- Platt ML, Glimcher PW. Responses of intraparietal neurons to saccadic targets and visual distractors. J Neurophysiol. 1997;78:1574–1589. doi: 10.1152/jn.1997.78.3.1574. [DOI] [PubMed] [Google Scholar]
- Platt ML, Glimcher PW. Neural correlates of decision variables in parietal cortex. Nature. 1999;400:233–238. doi: 10.1038/22268. [DOI] [PubMed] [Google Scholar]
- Pouget A, Dayan P, Zemel RS. Inference and computation with population codes. Annu Rev Neurosci. 2003;26:381–410. doi: 10.1146/annurev.neuro.26.041002.131112. [DOI] [PubMed] [Google Scholar]
- Reynolds JH, Heeger DJ. The normalization model of attention. Neuron. 2009;61:168–185. doi: 10.1016/j.neuron.2009.01.002. [DOI] [PMC free article] [PubMed] [Google Scholar]
- Reynolds JH, Chelazzi L, Desimone R. Competitive mechanisms subserve attention in macaque areas V2 and V4. J Neurosci. 1999;19:1736–1753. doi: 10.1523/JNEUROSCI.19-05-01736.1999. [DOI] [PMC free article] [PubMed] [Google Scholar]
- Roitman JD, Shadlen MN. Response of neurons in the lateral intraparietal area during a combined visual discrimination reaction time task. J Neurosci. 2002;22:9475–9489. doi: 10.1523/JNEUROSCI.22-21-09475.2002. [DOI] [PMC free article] [PubMed] [Google Scholar]
- Schwartz O, Simoncelli EP. Natural signal statistics and sensory gain control. Nat Neurosci. 2001;4:819–825. doi: 10.1038/90526. [DOI] [PubMed] [Google Scholar]
- Seo H, Barraclough DJ, Lee D. Lateral intraparietal cortex and reinforcement learning during a mixed-strategy game. J Neurosci. 2009;29:7278–7289. doi: 10.1523/JNEUROSCI.1479-09.2009. [DOI] [PMC free article] [PubMed] [Google Scholar]
- Shadlen MN, Newsome WT. The variable discharge of cortical neurons: implications for connectivity, computation, and information coding. J Neurosci. 1998;18:3870–3896. doi: 10.1523/JNEUROSCI.18-10-03870.1998. [DOI] [PMC free article] [PubMed] [Google Scholar]
- Shafir S, Waite TA, Smith BH. Context-dependent violations of rational choice in honeybees (Apis mellifera) and gray jays (Perisoreus canadensis) Behav Ecol Sociobiol. 2002;51:180–187. [Google Scholar]
- Spitzer H, Desimone R, Moran J. Increased attention enhances both behavioral and neuronal performance. Science. 1988;240:338–340. doi: 10.1126/science.3353728. [DOI] [PubMed] [Google Scholar]
- Stephens DW, Krebs JR. Foraging theory. Princeton, NJ: Princeton UP; 1986. [Google Scholar]
- Sugrue LP, Corrado GS, Newsome WT. Matching behavior and the representation of value in the parietal cortex. Science. 2004;304:1782–1787. doi: 10.1126/science.1094765. [DOI] [PubMed] [Google Scholar]
- Sundberg KA, Mitchell JF, Reynolds JH. Spatial attention modulates center-surround interactions in macaque visual area V4. Neuron. 2009;61:952–963. doi: 10.1016/j.neuron.2009.02.023. [DOI] [PMC free article] [PubMed] [Google Scholar]
- Tolhurst DJ, Movshon JA, Dean AF. The statistical reliability of signals in single neurons in cat and monkey visual cortex. Vision Res. 1983;23:775–785. doi: 10.1016/0042-6989(83)90200-6. [DOI] [PubMed] [Google Scholar]
- Tversky A, Simonson I. Context-dependent preferences. Manage Sci. 1993;39:1179–1189. [Google Scholar]
- Valerio R, Navarro R. Optimal coding through divisive normalization models of V1 neurons. Network. 2003;14:579–593. [PubMed] [Google Scholar]
- Von Neumann J, Morgenstern O. Theory of games and economic behavior. Princeton, NJ: Princeton UP; 1944. [Google Scholar]
- Zoccolan D, Cox DD, DiCarlo JJ. Multiple object response normalization in monkey inferotemporal cortex. J Neurosci. 2005;25:8150–8164. doi: 10.1523/JNEUROSCI.2058-05.2005. [DOI] [PMC free article] [PubMed] [Google Scholar]