

Abstract
Single-minded 1 (SIM1) mutations are one of the few known causes of nonsyndromic monogenic obesity in both humans and mice. Although the role of Sim1 in the formation of the hypothalamus has been described, its postdevelopmental, physiological functions have not been well established. Here we demonstrate that postnatal CNS deficiency of Sim1 is sufficient to cause hyperphagic obesity. We conditionally deleted Sim1 after birth using CaMKII-Cre (α-calcium/calmodulin-dependent protein kinase II-Cre) lines to recombine a floxed Sim1 allele. Conditional Sim1 heterozygotes phenocopied germ line Sim1 heterozygotes, displaying hyperphagic obesity and increased length. We also generated viable conditional Sim1 homozygotes, demonstrating that adult Sim1 expression is not essential for mouse or neuron survival and revealing a dosage-dependent effect of Sim1 on obesity. Using stereological cell counting, we showed that the phenotype of both germ line heterozygotes and conditional Sim1 homozygotes was not attributable to global hypocellularity of the paraventricular nucleus (PVN) of the hypothalamus. We also used retrograde tract tracing to demonstrate that the PVN of germ line heterozygous mice projects normally to the dorsal vagal complex and the median eminence. Finally, we showed that conditional Sim1 homozygotes and germ line Sim1 heterozygotes exhibit a remarkable decrease in hypothalamic oxytocin (Oxt) and PVN melanocortin 4 receptor (Mc4r) mRNA. These results demonstrate that the role of Sim1 in feeding regulation is not limited to formation of the PVN or its projections and that the hyperphagic obesity in Sim1-deficient mice may be attributable to changes in the leptin–melanocortin–oxytocin pathway.
Introduction
Single-minded 1 (SIM1) encodes a hypothalamic transcription factor in the bHLH-PAS (basic helix-loop-helix–Per Arnt Sim) family (Ward et al., 1998) and is one of only a handful of genes associated with human monogenic obesity (Holder et al., 2000; Farooqi and O'Rahilly, 2005). Sim1 homozygous mice (Sim1−/−) die perinatally and lack anterior periventricular, paraventricular (PVN), and supraoptic (SON) hypothalamic nuclei (Michaud et al., 1998) because of failure of terminal migration and differentiation of the Sim1 neurons (Xu and Fan, 2007). These nuclei, responsible for the production of multiple neuropeptides including oxytocin (Oxt), vasopressin, corticotropin-releasing hormone, thyrotropin-releasing hormone, and somatostatin, have long been implicated in energy balance from studies in multiple animal models (Heinbecker et al., 1944; Leibowitz et al., 1981). Sim1 heterozygotes (Sim1+/−) show hyperphagic obesity: they have increased lean and fat mass with increased body fat percentage (Michaud et al., 2001; Holder et al., 2004) as well as increased food intake and normal energy expenditure as evaluated by metabolic cage (Michaud et al., 2001; Kublaoui et al., 2006a) and pair-feeding studies (K. P. Tolson, T. Gemelli, and A. R. Zinn, unpublished data). Additionally, they have increased linear growth and enhanced susceptibility to diet-induced obesity (DIO) (Holder et al., 2004), associated with defective melanocortin 4 receptor (Mc4r) signaling (Kublaoui et al., 2006a). They also exhibit reduced hypothalamic Oxt expression (Kublaoui et al., 2008) and their phenotype is partially rescued by intracerebroventricular Oxt administration (Kublaoui et al., 2008).
Whether the obesity phenotype of Sim1+/− mice is the result of a developmental or postdevelopmental hypothalamic defect is uncertain. Michaud et al. (2001) reported a mean reduction of 24% in the PVN cellularity of Sim1+/− mice and attributed their hyperphagic obesity to this congenital lesion of the hypothalamus. Using a Sim1-GFP reporter transgene, we found no difference in the number of Sim1-expressing cells in Sim1+/+ versus Sim1+/− mice (Kublaoui et al., 2006a). Furthermore, we showed that Sim1 transgenic overexpression did not affect hypothalamic morphology but partially rescued C57BL/6 DIO as well as the hyperphagia and obesity of Agouti yellow mice, which have defective melanocortin signaling (Kublaoui et al., 2006b). Yang et al. (2006) reported that viral-mediated changes in Sim1 hypothalamic expression in adult mice were inversely correlated with food intake, also supporting a physiological role for Sim1 in regulating food intake.
To dissociate the neuroanatomical and physiological functions of Sim1 in feeding regulation, we used two α-calcium/calmodulin-dependent protein kinase II-Cre (CaMKII-Cre) lines, Cre93 and Cre159, to conditionally delete Sim1 in the postnatal brain (Minichiello et al., 1999; Rios et al., 2001). We bred viable conditional postnatal CNS homozygous Sim1 knock-out mice and measured their growth and feeding behavior. We examined the cellularity of germ line Sim1 heterozygotes and conditional postnatal Sim1 homozygotes using unbiased stereology, as well as PVN projections to the hindbrain and median eminence (ME) in germ line Sim1 heterozygotes using retrograde tract tracing. We also assessed the hypothalamic expression of Sim1, Oxt, and Mc4r mRNAs in mice with conditional postnatal Sim1 deletion.
Materials and Methods
Animals and genotyping.
Studies were performed in mice of mixed genetic background; therefore, littermates were used as controls for all experiments. Mice were group housed and maintained in a temperature-controlled room under a standard 12 h light/dark cycle with ad libitum access to water and low-fat (LF), low-phytoestrogen diet (Teklad Global Diet 2016) unless specifically indicated otherwise. All experimental protocols were approved by the University of Texas Southwestern Institutional Animal Care and Use Committee and are in accordance with accepted standards of humane animal care. Male and female C57BL/6 mice were obtained from the National Cancer Institute at 4–5 weeks of age for breeding. Floxed Sim1 mice [The Jackson Laboratory (JAX) stock number 007570, Sim1fl/fl] were obtained as previously described (Holder et al., 2004). EIIa-Cre mice were obtained from The Jackson Laboratory (stock number 003314) and exhibit early widespread Cre recombinase expression (Lakso et al., 1996). α-Calcium/calmodulin-dependent protein kinase II-Cre (CaMKII-Cre) 93 and 159 lines were obtained from Rudolf Jaenisch (Whitehead Institute, Cambridge, MA) and have been previously described (Minichiello et al., 1999; Rios et al., 2001). Rosa-eYFP (Srinivas et al., 2001) mice were obtained from The Jackson Laboratory (JAX stock number 006148).
Genomic DNAs were isolated from tail biopsies using HotSHOT as previously described (Truett et al., 2000) and postmortem liver biopsies using Wizard Genomic DNA Purification kit (Promega) and genotyped using PCR. The floxed Sim1 allele was detected using primers L2R, 5′-GAC TTT TCT TTC ATC GTG TCT CGG-3′, and Z1F, 5′-CAT TCG TGT CTT CCC GGA GCA AAC TTC-3′. The Rosa-eYFP transgene was detected using primers 2163 Rosa, 5′-GCG AAG AGT TTG TCC TCA ACC-3′; 2164 Rosa, 5′-GGA GCG GGA GAA ATG GAT ATG-3′; and 2165 Rosa, 5′-AAA GTC GCT CTG AGT TGT TAT-3′ (http://jaxmice.jax.org/). Primers Cre800, 5′-GCT GCC ACG ACC AAG TGA CAG CAA TG-3′, and Cre1200, 5′-GTA GTT ATT CGG ATC ATC AGC TAC AC-3′ (Holtwick et al., 2002), were used to detect Cre transgenes with OL260, 5′-CAT ACT GCA TGT GTC TTG GTG GGC TGA GCC-3′, and OL261, 5′-GAA TCC TGT GCA ATA CTC ACC ACT CCA GGC-3′, as internal controls.
Growth and feeding studies.
Mice were genotyped and weaned onto their respective diets at 3 weeks of age and fed ad libitum with either a LF, low-phytoestrogen diet (Global Diet 2016; Teklad; 3.2 kcal/g, with 56.0% available carbohydrate, 4.2% crude fat, and 16.7% crude protein) or a high-fat (HF) diet (D12492; Research Diets; 5.24 kcal/g, with 26.3g% available carbohydrate, 34.9g% available fat, and 26.2g% available protein). Mice of both sexes were group housed, except cohorts used to measure food intake, which were individually housed. To help reduce the stress of isolation, individually housed mice were provided with bedding and a nestlet. Large food pellets were selected weekly and small pellets removed to minimize spillage, and bedding was also checked for spillage. Within experiments, there were no differences in housing conditions of experimental versus control animals. Food consumption and body weight were measured weekly.
Tissue collection for immunostaining and stereology.
For immunostaining and stereology, mice were deeply anesthetized with pentobarbital (7.5 mg/0.15 ml, i.p.) and transcardially perfused with 10 ml of heparinized saline (10 U/ml, 2 ml/min) followed by 10 ml of phosphate-buffered 4% paraformaldehyde (PFA). Brains were removed, postfixed for 24 h in 4% PFA, and then equilibrated in 30% sucrose in PBS for 72 h. Brains were coronally sectioned (35 μm for immunostaining, 50 μm for stereology) on a sliding microtome (Leica SM 2000R).
Immunohistochemistry.
Immunohistochemistry was performed as described previously (Beuckmann et al., 2004; Kublaoui et al., 2006a, 2008). For enhanced yellow fluorescent protein (eYFP) labeling, 35 μm coronal brain sections that had been stored in PBS at 4°C were permeabilized and blocked in 3% normal goat serum/0.3% Triton X-100 for 1 h and incubated at 4°C overnight in green fluorescent protein (GFP) antibody (FITC) (1:5000; ab6662; Abcam). Sections were placed in 4′,6-diamidino-2-phenylindole (DAPI) (0.2 μg /ml; 236276; Roche) for 10 min and then mounted on plus coated slides and coverslipped using Vectashield (H-1000; Vector Laboratories). Images of sections containing PVN and SON were captured on an Olympus BX61 microscope using Cytovision software (Applied Imaging).
For diaminobenzidine tetrahydrochloride (DAB) staining of YFP-positive cells, brain sections were pretreated with 0.3% hydrogen peroxide in PBS for 30 min at room temperature and then blocked with 3% normal goat serum/0.3% Triton X-100/PBS for 2 h at room temperature. Sections were incubated overnight at 4°C with GFP rabbit primary antiserum (1:80,000; A6455; Invitrogen) in 0.3% Triton X-100/PBS. After washing in PBS, sections were incubated in biotinylated goat anti-rabbit secondary antibody diluted in 0.3% Triton X-100/PBS (1:600; BA-1000; Vector Laboratories) for 30 min and then washed in PBS, followed by horseradish peroxidase streptavidin diluted in 0.5% Triton X-100/PBS for 30 min (1:500; SA-5004; Vector Laboratories), both at room temperature. After washing in PBS, the sections were incubated in a solution of hydrogen peroxide charged DAB (DAB chromogen; Dako North America) in 0.05% Tris, pH 7.6, with nickel enhancement. Sections were mounted on plus coated slides, air-dried, dehydrated in graded ethanols, cleared in xylenes, and coverslipped with Permount (Thermo Fisher Scientific). Images of sections containing PVN and SON were captured on a Leica DM2000 with Microfire camera and PictureFrame 2.0 software (Optronics).
Stereological analyses.
Nissl staining was performed as previously described (Gerfen, 2003). Briefly, coronal sections (50 μm) were mounted on plus coated slides and allowed to dry, and then incubated for 1 min in thionin solution, washed in water, dehydrated in graded ethanols, cleared in xylenes, and coverslipped with Permount (Thermo Fisher Scientific).
For stereological analyses, the PVN of Nissl-stained serial sections were outlined at low magnification (4×; 0.16 numerical aperture; UPlanApo) on the live computer image as described previously (Chakraborty et al., 2008) and with the help of The Mouse Brain in Stereotaxic Coordinates (Paxinos and Franklin, 2001). The optical fractionator (West et al., 1991) was used to estimate the total number of cells in the regions of interest. A 100× immersion oil, 1.3 numerical aperture objective (UPlanFI; Olympus) was used to achieve optimal optical sectioning during stereological analysis. All counts were done by the same investigator, who was blinded to the genotype of the mice. The Stereo Investigator, version 8, software (MicroBrightField) placed disector frames using a systematic-random design within each contour outlining a 70 × 77 μm grid to give ∼10 counting frames per section, and the Nissl-stained cells were counted within 20 × 20 μm optical disectors in the x–y-axis. The final postprocessing thickness of the sections, as measured by the microcator, was on average 12 μm, so the counting frame height was kept at 10 μm for all sections studied to keep a 1 μm guard zone. Bilateral PVN cell counts were estimated using the optical fractionator to count sections with periodicity n = 2, and five to six serial sections from each brain were counted. The cell number estimates did not depend on a direct measurement of the volume of reference of the region considered because of the use of the optical fractionator, and therefore the shrinkage of the tissue during histological processing does not influence the precision of these estimates (Chakraborty et al., 2003). On an average, 300–500 cells were sampled in the PVN in each mouse. The coefficient of error (Gundersen, m = 1) was 0.05 or less for all samples.
Quantitative analyses were performed using a computer assisted morphometry system consisting of an Olympus BX61 microscope equipped with an LEP XY computer/joystick controlled motorized stage (LUDL Electronic Products), a Microfire digital camera (Optronics), a Dell computer, and StereoInvestigator8 software.
Retrograde labeling of PVN neurons.
To label PVN neurons that send monosynaptic projections to the dorsal vagal complex (DVC) (Saper et al., 1976), mice were stereotactically injected with the retrograde tracer cholera toxin b subunit (CTb) (1% in 0.9% saline; List Biological Laboratories; product no. 104; lot no. 10427B1). Briefly, mice were anesthetized with ketamine HCl/xylazine HCl (80/12 mg/kg, i.p.) and restrained in a Kopf stereotaxic apparatus. A glass micropipette connected to an air pressure injector system was positioned via the stereotaxic manipulator. CTb was unilaterally injected into the DVC (+0.16 from the obex, ±0.23 mm lateral, −0.36 mm from the surface of the brainstem). After injection, the micropipette was removed and the incision was closed with surgical staples. Injection volume was 10–50 nl, and there was no morbidity or mortality. Injection site was confirmed by immunostaining hindbrain sections, and there was no evidence of lesion.
To simultaneously label PVN neurons that send projections to the median eminence (Horvath, 1998), the same mice received a single intraperitoneal injection of Fluoro-Gold (FG) (100 μg/mouse in 0.9% saline; Fluorochrome).
Perfusion and histology for retrograde tract tracing.
Seven days after surgery, mice were deeply anesthetized with chloral hydrate (500 mg/kg, i.p.), and then were perfused transcardially with 0.9% saline followed by 10% formalin (Sigma-Aldrich). The brain was removed, postfixed 2 h, and submerged in 20% sucrose overnight at 4°C. Coronal sections were cut at 25 μm using a freezing microtome (1:5 series). Sections were collected in 0.1 m PBS, pH 7.4, transferred in a cryoprotectant solution, and stored at −20°C. After washing in PBS, brain sections were pretreated with 0.3% hydrogen peroxide in PBS for 15 min at room temperature. Sections were incubated overnight in a goat polyclonal antibody raised against CTb (1:50,000; List Biological Laboratories; product no. 703; lot no. 7032A3) in 3% normal donkey serum (Jackson ImmunoResearch Laboratories) with 0.25% Triton X-100 in PBS (PBT). This antibody has been validated to detect CTb-labeled neurons in the rat CNS (Füzesi et al., 2008). Another series of sections were incubated in a rabbit polyclonal antibody raised against FG (1:20,000; Millipore Bioscience Research Reagents; catalog #AB153; lot no. LV1446350) in 3% normal donkey serum PBT. This antibody has been validated to detect FG-labeled neurons in the rat CNS (Kaufling et al., 2009).
After washing in PBS, sections were incubated in biotinylated donkey anti-rabbit IgG (Jackson ImmunoResearch Laboratories; catalog #711065152; lot no. 77648; 1:1000) or biotinylated donkey anti-goat IgG (Jackson ImmunoResearch Laboratories; catalog #705065147; lot no. 72100; 1:1000) for 1 h at room temperature, followed by a solution of ABC (Vectastain Elite ABC kit; Vector Laboratories; 1:1000) dissolved in PBS for 1 h. After washing in PBS, the sections were incubated in a solution of 0.04% diaminobenzidine tetrahydrochloride and 0.01% hydrogen peroxide (Sigma-Aldrich). It resulted in the accumulation of punctate brown precipitate in the cytoplasm of retrogradely labeled neurons. DAB-labeled sections were mounted on gelatin-coated slides, air-dried, dehydrated in graded ethanols, cleared in xylenes, and coverslipped with Permaslip (Alban Scientific). DAB staining was viewed using an Axioskop2 microscope (Zeiss) using brightfield optics. Digital images were captured using an Axiocam digital camera and Axiovision 3.1 software (Zeiss).
Quantitative real-time PCR.
Hypothalamic tissue for quantitative real-time PCR (qPCR) was collected as previously described (Kublaoui et al., 2006b). Hypothalami were dissected from fresh brains with a mouse brain block (model PA 002; David Kopf Instruments), using the following landmarks: posteriorly, posterior aspect of median eminence; anteriorly, 5 mm anterior to the median eminence; dorsally, the thalamus; laterally, medial to the dentate gyrus. Total RNA was extracted using Tripure reagent (Roche Applied Science). cDNA was generated using an iScript cDNA Synthesis kit (Bio-Rad Laboratories).
Alternatively, tissue was isolated from the PVN using laser capture microdissection (LCM). Briefly, mice were killed and brains dissected manually and frozen immediately. The frozen brains were mounted in Tissue-Tek OCT 4583 compound (Sakura) and then were sectioned on a cryostat (Leica) to a thickness of 30 μm. Sections were adhered to silane (2%)-treated glass membrane slides (Molecular Devices). Sections were prepared for 1 min in 70% EtOH and then dipped in water. Sections were stained with a filtered thionin solution for 2 min. Next, sections were rinsed and dehydrated with EtOH, and finally cleared with xylene for 5 min. All solutions were made with autoclaved 0.1% DEPC water. The PVN region was microdissected out of a series of 20 evenly spaced thionin-stained sections using a Veritas LCM system (Molecular Devices; Arcturus Bioscience). The collected tissue, adherent to the underside of the LCM cap, was then dissolved in digestion buffer (Stratagene) and frozen at −80°C. Later, RNA was extracted from these samples using the Picopure RNA isolation kit (Arcturus Bioscience). Approximately 20 evenly spaced sections were pooled to eliminate any potential rostrocaudal gene expression bias. Typical pools contained ∼600 ng of RNA. Microdissected RNA was reverse transcribed using iScript (Bio-Rad) and then preamplified with TaqMan PreAmp Master Mix kit (Applied Biosystems).
Quantitative real-time PCR was performed using TaqMan Universal PCR Master Mix with an ABI 3700 instrument (Applied Biosystems). TaqMan assays were used to measure Sim1, Oxt, and Mc4r mRNA levels (Mm00441390_m1, Mm00726655_s1, and Mm00457483_s1; Applied Biosystems). For Mc4r, which does not contain an intron, a parallel experiment using mock reverse-transcribed samples from LCM tissue was used as a control for genomic DNA contamination and showed negligible PCR product. Mouse Gapdh (4352339E; Applied Biosystems) was the endogenous control used for normalization. Standard curves were generated using reference cDNA prepared from control mouse hypothalamus or PVN. All measurements were made in the exponential phase of the real-time PCR. Reactions were performed in triplicate and the results averaged. Results were analyzed using SDS 2.3 software (Applied Biosystems) and Microsoft Excel.
Statistical analysis.
Data were analyzed using Microsoft Excel, Prism5 software (GraphPad Software), and SAS, version 9.2 (SAS Institute), and are presented as mean ± SEM. Single comparisons at single points were made using unpaired, two-tailed Student's t test. Multiple comparisons at single points were performed using one-way ANOVA with Tukey's post hoc test. For body weight and food consumption, comparisons were made by mixed ANOVAs using the between-subjects factor of group and the within-subjects factor of week. In the presence of a significant interaction effect across time, comparison of differences between groups were made at individual times by using a Bonferroni post hoc test for multiple comparisons and Student's t test for single comparisons. Differences were considered statistically significant if p < 0.05.
Results
Validation of Cre-loxP Sim1 inactivation
Previously, germ line Sim1 heterozygous mice were generated using a floxed Sim1 allele that contained three loxP sites and a pGK-Neo cassette crossed with an EIIa-Cre transgene (Holder et al., 2004). From the same floxed Sim1 line, a two loxP allele was created by excising the pGK-Neo cassette. These two loxP sites flank the first exon of Sim1, which contains the start codon and the first 17 amino acids of Sim1.
To confirm that recombination of this floxed Sim1 allele would recapitulate a Sim1-null allele, we used an ubiquitously expressed EIIa-Cre to achieve germ line deletion and studied the progeny. Three-week-old mice were weaned onto a high-fat diet containing ∼35g% dietary fat (HF), allowed to feed ad libitum, and weighed weekly (Fig. 1A,B) (males: F(1,26) = 85.71, p < 0.0001; females: F(1,19) = 41.68, p < 0.0001). After 1 week on the HF diet, both male and female Sim1 heterozygotes weighed significantly more than their controls (males: p = 0.02; females: p = 0.02). At 8 weeks of age, Sim1 heterozygous males weighed 44% more (Fig. 1A) and Sim1 heterozygous females weighed 73% more (Fig. 1B) than control littermates on the HF diet. Similar sex differences have been observed previously (Holder et al., 2004). Heterozygotes of either sex continued to gain weight until the experiment was terminated at 12 weeks of age. PCR showed that the recombined floxed Sim1 allele was the expected size (Fig. 1C); the 371 bp band shows the wild-type allele and the 160 bp band shows the recombined allele. These results recapitulated the previously reported phenotype of Sim1 heterozygotes (Holder et al., 2004), confirming the utility of the floxed Sim1 allele.
Figure 1.
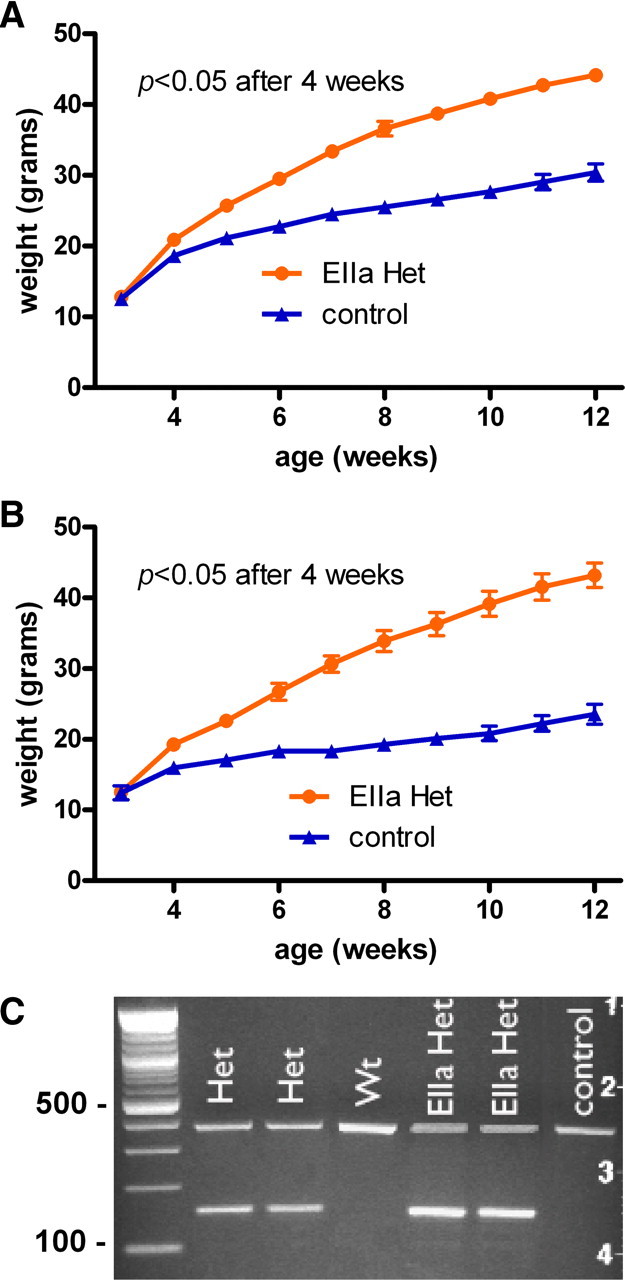
Recombination of floxed Sim1 allele with EIIa-Cre. A, B, Sim1 heterozygous mice generated with EIIa-Cre on a high-fat diet. A, Males (EIIa Het, n = 13; control, n = 14). B, Females (EIIa Het, n = 14; control, n = 7). C, The genotypes of germ line and EIIa heterozygotes and wild types shown by PCR. The 371 bp band shows the wild-type allele, and the 160 bp band shows the recombined allele. Error bars indicate SEM. WT, Wild type.
Expression of CaMKII-Cre in the PVN and SON
To conditionally delete Sim1 postnatally, we obtained two CaMKII-Cre lines that have been previously described, CaMKII-Cre93 and CaMKII-Cre159, hereafter referred to as Cre93 and Cre159 (Minichiello et al., 1999; Rios et al., 2001). In both of these lines, the Cre transgene expression is driven by the CaMKII promoter, which is expressed in postmitotic neurons (Minichiello et al., 1999). Cre93 was reported to begin expression shortly after birth with wide activation at postnatal day 21 (P21) (Rios et al., 2001), and Cre159 expression was not reported until after P15, with full recombination occurring around P28 (Minichiello et al., 1999; Rios et al., 2001). Both lines showed transgene expression in the hypothalamus, but the PVN and SON were not specifically examined at the time.
To confirm expression of the Cre transgene in these hypothalamic nuclei, both lines were crossed to a Rosa26-eYFP line, which contains a STOP cassette flanked by loxP sites inserted between the Rosa26 promoter and enhanced yellow fluorescent protein (eYFP) and therefore expresses eYFP only in cells producing Cre recombinase (Srinivas et al., 2001). We then performed immunohistochemistry on adult progeny to detect eYFP in the PVN and SON. Cre93, Rosa26-eYFP double transgenic mice exhibited strong staining in the PVN as well as the SON in both males and females (Fig. 2A–D). Cre159, Rosa26-eYFP double transgenic mice also showed staining in the PVN (supplemental Fig. 1A,B, available at www.jneurosci.org as supplemental material) in both sexes, although it was not as strong as the Cre93 staining, and staining in the SON was negligible (data not shown). Some eYFP expression at P10 was also noted (data not shown), which is earlier than the previously reported start of expression at P15 (Minichiello et al., 1999; Rios et al., 2001), but still well after the formation of the PVN and SON.
Figure 2.

CaMKII-Cre93 is expressed in the PVN and the SON. Mice conditionally expressing eYFP under the control of the Rosa26 promoter were bred with CaMKII-Cre93 mice. A, B, The PVN (A) and SON (B) of an adult female mouse. eYFP is represented by green, and DAPI is shown in blue. C, D, The PVN (C) and SON (D) of an adult male mouse. Scale bar, 200 μm.
Growth and feeding behavior of conditional postnatal Sim1 heterozygous mice
Some Cre transgenes cause weight phenotypes themselves (Schmidt-Supprian and Rajewsky, 2007). To control for possible effects of the Cre93 and 159 transgenes on weight, 3-week-old transgenic mice were weaned onto a low fat diet (LF). Cre93 mice and wild-type littermates were weighed weekly from age 9–18 weeks (supplemental Fig. 2A,B, available at www.jneurosci.org as supplemental material) (males: F(1,6) = 0.06, p = 0.8162; females: F(1,4) = 0.75, p = 0.4359), with no observable difference in weight. Cre159 mice and wild-type littermates were weighed every 3 weeks from age 9 to 18 weeks (supplemental Fig. 2C,D, available at www.jneurosci.org as supplemental material) (males: F(1,20) = 0.03, p = 0.8560; females: F(1,16) = 1.91, p = 0.1858), also with no observable difference in weight.
To achieve conditional postnatal Sim1 heterozygous deletion, we first crossed the floxed Sim1 mice (Sim1fl/fl) to the Cre93 line. Genotyping of tail and liver biopsies of progeny (data not shown) confirmed the absence of germ line recombination caused by aberrant transgene expression (“delta effect”). Three-week-old progeny were weaned onto a HF diet and weighed weekly (Fig. 3A,B) (males: F(1,25) = 23.54, p < 0.0001; females: F(1,12) = 25.88, p < 0.0005). After 2 weeks on the HF diet, both male and female heterozygotes (cHet93: Cre93, Sim1+/fl) weighed significantly more than their littermate controls (males: p = 0.002; females: p = 0.006). At 8 weeks of age, heterozygous males weighed 23% more (Fig. 3A) and heterozygous females weighed 36% more (Fig. 3B) than control littermates on the HF diet. Heterozygotes of either sex continued to gain weight until the experiment was terminated at 12 weeks of age. To determine whether the obesity of the cHet93 mice was attributable to hyperphagia, male cHet93 mice and littermate controls were weaned at 3 weeks on a LF diet and individually housed, and their body weights and food intakes were measured weekly. cHet93 mice also became significantly obese (Fig. 4A) (F(3,37) = 17.18; p < 0.0001) and hyperphagic by 4 weeks of age (Fig. 4B) (F(3,37) = 20.77; p < 0.0001) on a LF diet. The cumulative excess food intake by cHet93 mice was an average of 80 g per mouse over the 9 week period they were monitored. Additionally, measurements of the Cre93+ and Sim1+/fl littermates confirmed that, in the absence of Sim1 recombination, neither the Cre transgene nor the floxed Sim1 allele caused weight or feeding differences.
Figure 3.
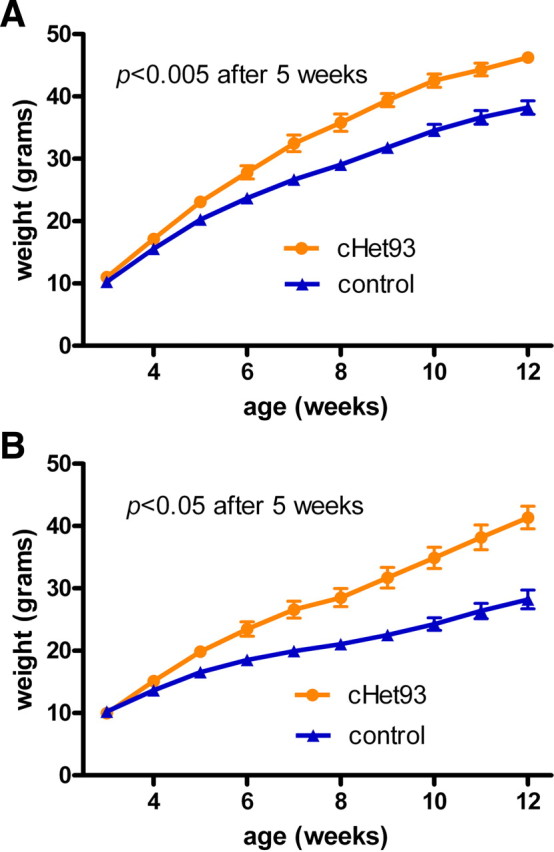
Conditional postnatal Sim1 heterozygotes on a high-fat diet. Growth curves of male (A) and female (B) conditional heterozygotes (cHet93: Cre93, Sim1+/fl) after being weaned onto high fat at 3 weeks of age. Mice were group housed with the same sex and weighed weekly [males (cHet93, n = 12; control, n = 15); females (cHet93, n = 7; control, n = 7)]. Error bars indicate SEM.
Figure 4.
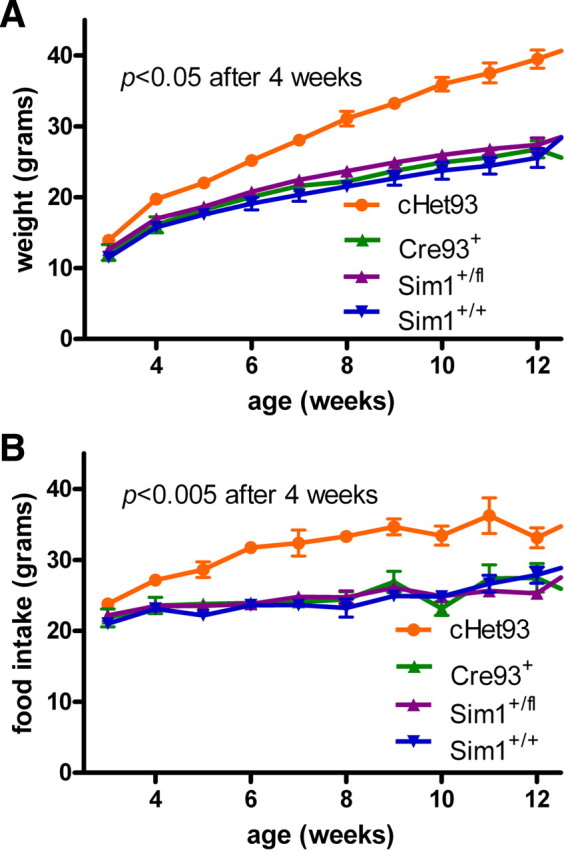
Conditional postnatal heterozygotes on a low-fat diet. A, Growth curves of male conditional heterozygotes on a low-fat diet. B, Weekly food intake of male cHet93 mice on a low-fat diet (cHet93, n = 7; Cre93+, n = 7; Sim1+/fl, n = 17; Sim1+/+, n = 10). Mice were individually housed to monitor food intake and weight weekly. Error bars indicate SEM.
Effects of conditional postnatal homozygous deletion of Sim1 on body weight, length, food intake, and gross appearance
Conventional homozygous inactivation of Sim1 results in death shortly after birth (Michaud et al., 2001; Holder et al., 2004). To determine whether conditional postnatal homozygous Sim1 inactivation also results in lethality, we generated cKO mice (Cre, Sim1fl/fl) by crossing cHet mice with Sim1fl/fl mice. Male cHet mice caused aberrant germ line recombination in their progeny, so only the progeny of female cHet mice were used. Genotyping of tail biopsies or postmortem livers (data not shown) confirmed the absence of germ line recombination in these progeny.
Conditional postnatal Sim1 homozygotes created with the Cre93 transgene (cKO93: Cre93, Sim1fl/fl) were viable and showed no visible signs of illness. Sim1 has been suggested to act in a dose-dependent manner (Kublaoui et al., 2006b), so we weaned cKO93, cHet93, and littermate controls at 3 weeks of age onto a LF diet and measured their body weights weekly. cKO93 mice developed even more severe obesity than cHet93 mice (Fig. 5A) (F(2,15) = 18.97; p < 0.0001) and exhibited increased length (Fig. 5B) (F(2,16) = 7.27; p = 0.0057). A similar, but less dramatic weight phenotype was observed in cKO159 (cKO159: Cre159, Sim1fl/fl) and cHet159 (cHet159: Cre93, Sim1+/fl) mice on a LF diet (supplemental Fig. 3A,B, available at www.jneurosci.org as supplemental material) (males: F(2,18) = 5.87, p = 0.0109; females: F(2,42) = 4.85, p = 0.0128).
Figure 5.
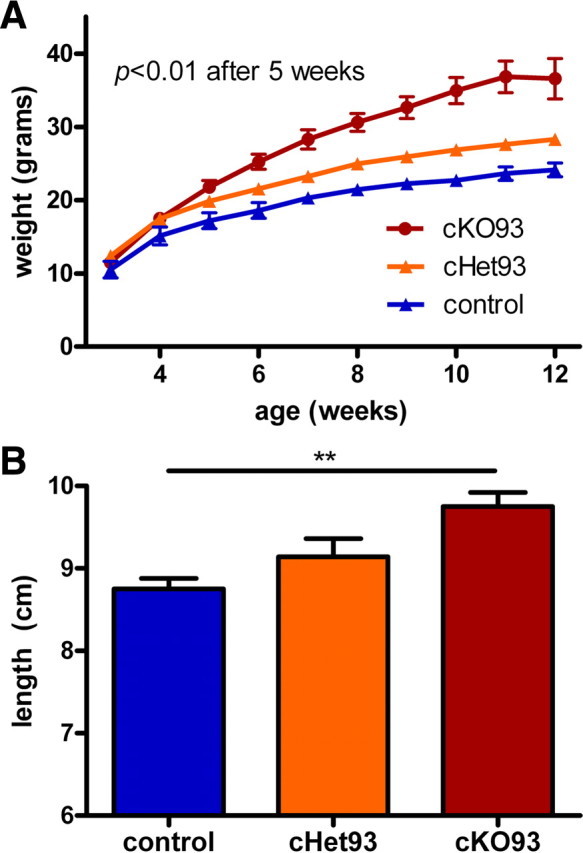
Postnatal conditional Sim1 homozygotes on a low-fat diet. A, Weekly growth curves showing male conditional Sim1 homozygotes (cKO93: Cre93, Sim1fl/fl), heterozygotes (cHet93), and their littermate controls on a low-fat diet. Mice were group housed with the same sex and weighed weekly. B, Nose-to-anus length of male mice at 13 weeks of age. (cKO93, n = 5; cHet93, n = 7; control, n = 6). **p < 0.01. Error bars indicate SEM.
To determine whether the obesity of cKO93 mice was attributable to hyperphagia, mice were weaned at 3 weeks of age onto a LF diet and housed individually, and their food intake and body weights were measured weekly. The mice exhibited hyperphagia before becoming grossly obese (Fig. 6A), with male cKO93 mice consuming ∼25% more calories per week (F(12,12) = 1.402; p < 0.0001) and female cKO93 mice consuming ∼40% more calories per week (F(6,15) = 5.03; p < 0.0001) than littermate controls. The obesity phenotype was clearly observable at age 12 weeks on the LF diet (Fig. 6B).
Figure 6.
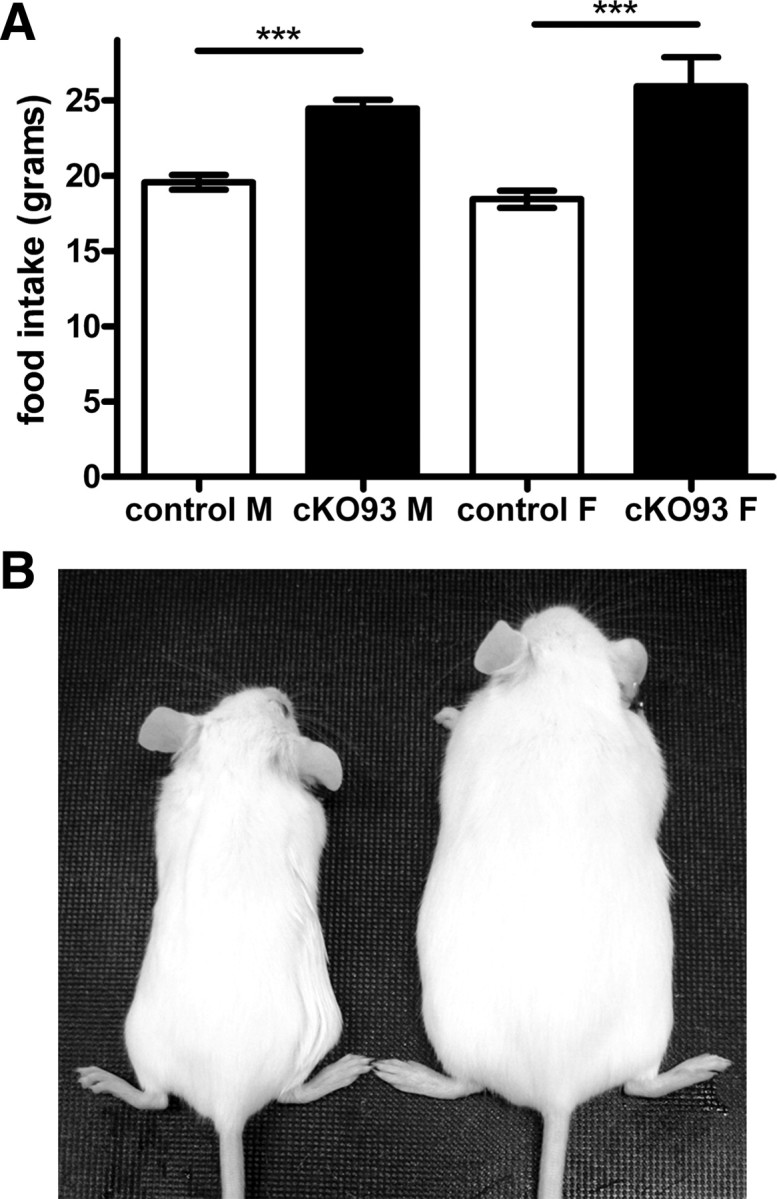
Food intake and gross appearance of postnatal conditional Sim1 homozygotes on a low-fat diet. A, Weekly food intake of cKO93 male and female mice at 6 weeks of age on a low-fat diet compared with control littermates (males: cKO93, n = 13; control, n = 13; females: cKO93, n = 7; control, n = 16). B, Gross appearance of control littermates and cKO93 female mice on a low-fat diet at 12 weeks of age (left, control; right, cKO93). Mice were individually housed to monitor food intake and weight weekly. ***p < 0.001. Error bars indicate SEM.
Stereological counting of PVN cells in germ line Sim1 heterozygotes and conditional postnatal Sim1 homozygotes
We used unbiased stereological analyses to determine whether a reduction in cellularity of the PVN accounts for the hyperphagic obesity of Sim1+/− or cKO93 mice. There was no statistically significant difference in the number of Nissl-stained cells in the PVN of wild-type versus germ line Sim1 heterozygotes (Fig. 7) (F(5,4) = 1.171; p = 0.2433), which is in agreement with our previous results using nonstereological methods (Kublaoui et al., 2006a). Additionally, there was no statistically significant difference in the number of PVN cells between controls versus cKO93 (Fig. 7) (F(4,4) = 1.314; p = 0.0952). Thus, a gross loss of PVN neurons did not explain the hyperphagic obesity observed in these mice.
Figure 7.

Unbiased stereological counting of PVN cells in germ line Sim1 heterozygotes and conditional postnatal Sim1 homozygotes. Unbiased stereological cell counting of the PVN of female WT versus Sim1+/− and control versus cKO93 mice (WT, n = 5; Sim1+/−, n = 6; control, n = 5; cKO93, n = 5). WT versus Sim1+/−, p = 0.2433; control versus cKO93, p = 0.0952. All counting was done by the same investigator, who was blinded to the genotypes of the mice. WT, Wild type.
Retrograde tract tracing in germ line Sim1 heterozygotes
Another possible cause of the hyperphagic obesity of Sim1+/− mice is faulty development of projections of PVN Sim1 neurons to the hindbrain or the ME. To test this possibility, we used retrograde tract tracing to examine these projections in adult mice. Projections to the ME were traced using Fluoro-Gold (Fig. 8A–D) and tracing from the DVC was accomplished by using the cholera toxin b subunit (Fig. 8E–H). The results clearly demonstrated the presence of intact projections from the PVN to the DVC and ME that were qualitatively indistinguishable from those seen in wild-type controls. We did not attempt to quantitate projections because of injection site variability.
Figure 8.

Projections from the PVN to the ME and the DVC in germ line Sim1 heterozygotes. A–D, projections to the ME were traced using FG in wild-type (A, B) and Sim1+/− (C, D) mice. E–H show retrograde tract tracing from the DVC using the CTb subunit in wild-type (E, F) and Sim1+/− (G, H) mice. The estimated distance from bregma of each rostrocaudal level of the PVN is indicated. 3v, Third ventricle. Scale bar, 200 μm.
Expression of Sim1, Oxt, and Mc4r mRNAs in conditional postnatal Sim1 inactivation
As no suitable antibodies are available for Sim1 immunohistochemistry, we assessed the efficiency of Sim1 recombination in the conditional postnatal Sim1 heterozygotes and homozygotes by measuring hypothalamic Sim1 mRNA levels. We found Sim1 to be reduced by ∼60% in cHet93 and >90% in cKO93 (Fig. 9A) (F(2,13) = 22.58; p < 0.0001) compared with control littermates. The Cre159 transgene showed a more moderate reduction of Sim1 mRNA of ∼30% in the cHet159 and ∼40% in the cKO159 (supplemental Fig. 4A, available at www.jneurosci.org as supplemental material) (F(2,5) = 47.77; p = 0.0006) compared with controls, probably accounting for the less severe weight phenotypes observed in these mice.
Figure 9.
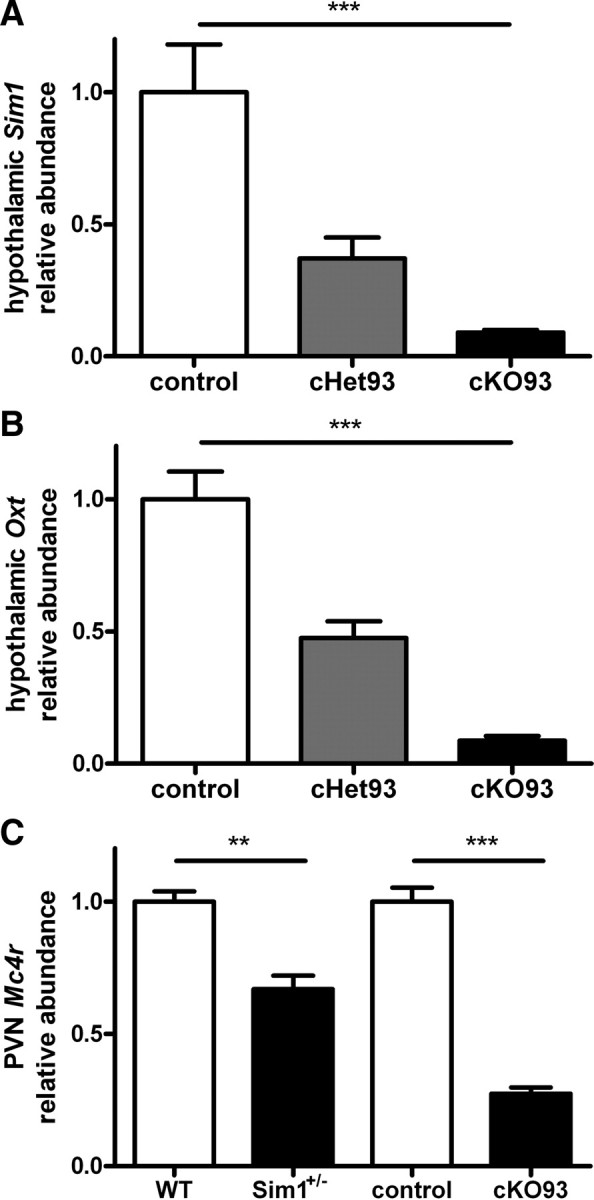
Quantitative real-time PCR analysis of hypothalamic expression of Sim1 and Oxt, and Mc4r expression in the PVN. A, Sim1 expression in the whole hypothalamus of male cHet93 and cKO93 compared with their control littermates. B, Oxt expression in the whole hypothalamus of male cHet93 and cKO93 compared with their control littermates. (cHet93, n = 6; cKO93, n = 6; control, n = 4). C, Mc4r expression in the PVN by laser capture microdissection of Sim1+/− mice and cKO93 compared with their respective control littermates (WT, n = 6; Sim1+/−, n = 5; control, n = 5; cKO93, n = 6). **p < 0.01; ***p < 0.001. Error bars indicate SEM.
As oxytocin has been implicated in the hyperphagic obesity of Sim1+/− mice (Kublaoui et al., 2008), we also used qPCR to measure Oxt levels. The amount of Oxt reduction correlated with Sim1 reduction: Oxt expression was reduced in the cHet93 by ∼50% and the cKO93 by ∼90% (Fig. 9B) (F(2,13) = 49.86; p < 0.0001), and in the cHet159 by ∼30% and the cKO159 by ∼40% (supplemental Fig. 4B, available at www.jneurosci.org as supplemental material) (F(2,5) = 7.17; p = 0.0339), all compared with their respective control littermates.
We previously reported that Mc4r expression in the whole hypothalamus was not decreased in Sim1 heterozygotes (Holder et al., 2004). However, we observed a trend toward decreased Mc4r expression in the whole hypothalamus of the cKO93 compared with controls that was not statistically significant (data not shown). Using laser capture microdissection to isolate the PVN, we saw a significant decrease in Mc4r expression in both germ line Sim1 heterozygotes (30%) as well as cKO93 (70%) (Fig. 9C) (WT vs Sim1+/−: F(4,5) = 1.457, p = 0.0005; control vs cKO93: F(4,5) = 4.078, p < 0.0001).
Discussion
Evidence for both developmental (Michaud et al., 1998, 2001) and postdevelopmental roles (Kublaoui et al., 2006b; Yang et al., 2006) for Sim1 exist; to determine their relative importance for feeding regulation, we took advantage of CaMKII-Cre expression in postmitotic neurons to generate conditional postnatal Sim1-deficient mice. The results of our studies strongly support a postnatal role for Sim1 in feeding regulation.
As some Cre transgenes have been reported to cause weight phenotypes (Schmidt-Supprian and Rajewsky, 2007), it was important for us to confirm that neither of the Cre lines used would confound our results. We collected weight curves of mice carrying the Cre93 and 159 transgenes compared with their wild-type littermates out to 18 weeks, which is older than the ages of the mice used in the conditional Sim1 knock-out experiments. Additionally, we included Cre-positive, loxP-negative controls in our conditional experiments. None of our Cre transgenes had a significant effect on any parameters that we measured.
The sex differences in some of our results are consistent with commonly observed differences between male and female responses; many studies have shown variance in response to high-fat diets, regulation of the neuropeptide Y signaling system in the hypothalamus, and leptin levels (Kennedy et al., 1997; Zammaretti et al., 2007; Huang et al., 2008; Hwang et al., 2009). Although there is not a clear-cut explanation for these differences, sex hormone levels may be involved.
Given the incomplete efficiency of conditional gene inactivation in most Cre-loxP systems, including Cre159 (Minichiello et al., 1999), and the fact that these experiments were conducted on mice of mixed background, the conditional deletion of Sim1 with Cre93 and 159 exhibited a robust phenotype. The development of early-onset obesity even on a low-fat diet suggests that the hyperphagic obesity of Sim1-deficient mice is mostly, if not entirely, attributable to a physiological effect of Sim1 haploinsufficiency rather than a fixed developmental defect. Additionally, we were successful in creating viable conditional Sim1 homozygous mice lacking >90% of Sim1 expression. The severity of hyperphagic obesity correlated with the reduction of Sim1 expression in conditional heterozygotes versus homozygotes and in Cre93 versus Cre159 progeny, corroborating our previous inference from studies of germ line heterozygotes and Sim1-overexpressing transgenics that Sim1 has dose-dependent effects (Holder et al., 2004; Kublaoui et al., 2006b).
Whether or not the PVN of Sim1 heterozygous mice is hypocellular is contested. Conventional Sim1 homozygous knock-out mice lack the PVN and SON and die shortly after birth (Michaud et al., 1998). Although the absence of these nuclei in these mice was originally attributed to cell death or fate switching (Michaud et al., 1998), Xu and Fan (2007) since showed that the Sim1−/− neurons survive until birth but do not properly migrate. As germ line Sim1 homozygous mice do not survive postnatally, they were unable to determine the survival of Sim1 neurons beyond birth. Michaud et al. (2001) reported that germ line Sim1 heterozygous mice showed a 24% decrease in cellularity, but our data did not show a decrease in the number of Sim1-expressing neurons (Kublaoui et al., 2006a). Although the differing findings could represent genetic background effects, neither our previous data nor those of Michaud et al. were corrected for double-counting [e.g., by the method of Abercrombie (Abercrombie and Johnson, 1946) or by using a stereological technique (Coggeshall and Lekan, 1996)]. Our cKO93 mice allowed us to examine whether ongoing Sim1 expression is needed for the survival of PVN neurons into adulthood as well as to further address the relationship between PVN cellularity and hyperphagic obesity in Sim1-deficient mice. Any reduction in PVN cellularity in conventional Sim1 heterozygotes would be expected to be magnified in cKO93 mice. Using unbiased stereological analysis, we show that neither conventional Sim1 heterozygotes nor conditional Sim1 homozygotes have significant hypocellularity. We cannot rule out a small, selective deficit of a subpopulation of PVN neurons, but as all PVN neurons are affected in Sim1−/− mice, we consider this possibility unlikely. The PVN cell count in adult cKO93 mice argues that hypocellularity is not the mechanism of hyperphagia in Sim1 deficiency and dissociates the hyperphagic obesity of these mice from the formation of the PVN.
Another possible developmental defect that could cause the hyperphagia of these mice is the abnormal development of PVN neuronal projections. Neurogenesis of the mouse and rat PVN is completed by 13–15 d postcoitum, 8–10 d before birth (Angevine, 1970; Shimada and Nakamura, 1973; Karim and Sloper, 1980), and therefore before the expression of our Cre93 and 159 lines. However, PVN neuronal projections—in particular, oxytocinergic neurons projecting to the nucleus tractus solitarius (NTS)—continue to develop postnatally. Data from mice are not available, but in rats, the development of PVN to hindbrain projections (for review, see Rinaman, 2006) is completed by postnatal day 20. We examined the projections from the PVN to the hindbrain as well as the ME in conventional Sim1 heterozygotes and wild-type littermates and saw no qualitative difference. Together with the results from the conditional heterozygotes and homozygotes, these results argue strongly that the hyperphagic obesity of these mice is not attributable to a fixed developmental defect (Michaud et al., 2001) and support the hypothesis that Sim1 plays a physiological role in feeding regulation (Kublaoui et al., 2006a,b; Yang et al., 2006).
Sim1 is closely associated evolutionarily with oxytocin neurons (Eaton and Glasgow, 2006). The previous observation of reduced Oxt expression in Sim1 heterozygotes (Kublaoui et al., 2008) was reproduced in mice with conditional postnatal Sim1 deficiency. The present findings show that the amount of Sim1 reduction correlates with the amount of Oxt reduction, which in turn correlates with the severity of hyperphagic obesity. These results support previous findings indicating the importance of Oxt deficiency in mediating the phenotype of Sim1-deficient mice (Kublaoui et al., 2008). Although the most likely cause of the differing severity of obesity between the cKO93 and cKO159 mice is the difference in the levels of Sim1 and Oxt reduction, we cannot rule out the possibility that later expression of the Cre159 line could also be a factor.
We previously showed that PVN neurons of Sim1+/− mice are hyporesponsive to melanotan II (MTII), a Mc3r/Mc4r agonist (Kublaoui et al., 2006a), with no reduction of Mc4r expression in whole hypothalamus of these mice (Holder et al., 2004). However, in the present study using LCM to isolate the PVN, we found that Mc4r expression was decreased by >30% in Sim1+/− mice and >70% in cKO93 compared with their respective control littermates. To our knowledge, this is the first time that another gene has been shown to affect Mc4r expression.
It is notable that decreased Mc4r expression is consistent with our previous data showing resistance of Sim1 heterozygous mice to the effect of MTII on food intake as well as c-Fos activation in the PVN (Kublaoui et al., 2006a). Although the decrease in PVN Mc4r expression is intriguing, we do not yet know whether this deficiency is partially or fully responsible for the obesity phenotype of Sim1-deficient mice. Inactivation of Mecp2 in Sim1 neurons is sufficient to cause hyperphagic obesity without a decrease in Mc4r (Fyffe et al., 2008), but it has also been demonstrated that Mc4r expression in Sim1 neurons controls food intake (Balthasar et al., 2005). It is not clear whether there is direct regulation of Mc4r or Oxt by Sim1, or Oxt by Mc4r, but PVN Oxt neurons and Oxt itself are known to interact with leptin and cholecystokinin in the NTS to control food intake (Blevins et al., 2003, 2004). In addition, we showed that intracerebroventricular replacement of Oxt rescued the hyperphagia of Sim1 heterozygous mice (Kublaoui et al., 2008). It is unclear whether Mc4r activation and Oxt expression and activity are in a linear pathway, or whether they function in parallel, and if so, which pathway is the predominant cause of the hyperphagic obesity of Sim1-deficient mice.
Whether these decreases in Oxt and Mc4r represent defects in specific signaling pathways or are part of a global dysfunction of these neurons has yet to be determined. Neither gene has been shown to be a direct transcriptional target of Sim1 (Liu et al., 2003). The previously observed abnormal response of PVN neurons in Sim1+/− mice to MTII but not to hypertonic saline (Kublaoui et al., 2006a) suggests a selective defect. However, it is possible that Sim1 is required to maintain the differentiated gene expression program of PVN neurons, and, as with neuroanatomic lesions (Heinbecker et al., 1944; Leibowitz et al., 1981), the predominant phenotypic effect of global PVN dysfunction is a change in feeding regulation. Additional neuroendocrine studies of conditional Sim1 homozygotes are needed to resolve this issue.
Regardless of the specific mechanism(s) by which Sim1 deficiency causes hyperphagia, our results corroborate previous findings that Sim1 acts postnatally in a dosage-sensitive manner to regulate feeding (Yang et al., 2006). Sim1 and its yet to be identified transcriptional target genes are thus potential targets for pharmacological agents for the treatment obesity. Importantly, Sim1 neurons in the PVN (and/or possibly amygdala) that express Mc4r regulate food intake but not energy expenditure, and the predominant phenotype of Sim1 deficiency appears to be hyperphagia. Therefore, targeting Sim1 neurons for appetite suppression may have fewer side effects than other therapeutic strategies.
Footnotes
This work was supported by American Heart Association Grants 0865266F and 0665077Y (B.M.K.); American Diabetes Association Grant 1-07-RA-41 (L.G., J.K.E.); and National Institutes of Health Grants DK79986 (A.R.Z.), DK071320, DK53301, and DK081185 (J.K.E.); and National Institutes of Health Grants 5UL1DE019584 (Jay Horton) and 5RL1DK081185 (J.K.E.) supporting the Task Force for Obesity Research at Southwestern. We thank Ying-Hue Lee, Rudolph Jaenisch, Alan Elliott, Viren Amin, Lane Jaeckle Santos, Amelia Eisch, John Shelton, James Richardson, Tamy Frank-Cannon, and Neal Melvin for their assistance.
References
- Abercrombie M, Johnson ML. Quantitative histology of Wallerian degeneration: I. Nuclear population in rabbit sciatic nerve. J Anat. 1946;80:37–50. [PubMed] [Google Scholar]
- Angevine JB., Jr Time of neuron origin in the diencephalon of the mouse. An autoradiographic study. J Comp Neurol. 1970;139:129–187. doi: 10.1002/cne.901390202. [DOI] [PubMed] [Google Scholar]
- Balthasar N, Dalgaard LT, Lee CE, Yu J, Funahashi H, Williams T, Ferreira M, Tang V, McGovern RA, Kenny CD, Christiansen LM, Edelstein E, Choi B, Boss O, Aschkenasi C, Zhang CY, Mountjoy K, Kishi T, Elmquist JK, Lowell BB. Divergence of melanocortin pathways in the control of food intake and energy expenditure. Cell. 2005;123:493–505. doi: 10.1016/j.cell.2005.08.035. [DOI] [PubMed] [Google Scholar]
- Beuckmann CT, Sinton CM, Williams SC, Richardson JA, Hammer RE, Sakurai T, Yanagisawa M. Expression of a poly-glutamine-ataxin-3 transgene in orexin neurons induces narcolepsy–cataplexy in the rat. J Neurosci. 2004;24:4469–4477. doi: 10.1523/JNEUROSCI.5560-03.2004. [DOI] [PMC free article] [PubMed] [Google Scholar]
- Blevins JE, Eakin TJ, Murphy JA, Schwartz MW, Baskin DG. Oxytocin innervation of caudal brainstem nuclei activated by cholecystokinin. Brain Res. 2003;993:30–41. doi: 10.1016/j.brainres.2003.08.036. [DOI] [PubMed] [Google Scholar]
- Blevins JE, Schwartz MW, Baskin DG. Evidence that paraventricular nucleus oxytocin neurons link hypothalamic leptin action to caudal brain stem nuclei controlling meal size. Am J Physiol Regul Integr Comp Physiol. 2004;287:R87–R96. doi: 10.1152/ajpregu.00604.2003. [DOI] [PubMed] [Google Scholar]
- Chakraborty TR, Hof PR, Ng L, Gore AC. Stereologic analysis of estrogen receptor alpha (ER alpha) expression in rat hypothalamus and its regulation by aging and estrogen. J Comp Neurol. 2003;466:409–421. doi: 10.1002/cne.10906. [DOI] [PubMed] [Google Scholar]
- Chakraborty S, Sachdev A, Salton SR, Chakraborty TR. Stereological analysis of estrogen receptor expression in the hypothalamic arcuate nucleus of ob/ob and agouti mice. Brain Res. 2008;1217:86–95. doi: 10.1016/j.brainres.2008.04.031. [DOI] [PubMed] [Google Scholar]
- Coggeshall RE, Lekan HA. Methods for determining numbers of cells and synapses: a case for more uniform standards of review. J Comp Neurol. 1996;364:6–15. doi: 10.1002/(SICI)1096-9861(19960101)364:1<6::AID-CNE2>3.0.CO;2-9. [DOI] [PubMed] [Google Scholar]
- Eaton JL, Glasgow E. The zebrafish bHLH PAS transcriptional regulator, single-minded 1 (sim1), is required for isotocin cell development. Dev Dyn. 2006;235:2071–2082. doi: 10.1002/dvdy.20848. [DOI] [PubMed] [Google Scholar]
- Farooqi IS, O'Rahilly S. Monogenic obesity in humans. Annu Rev Med. 2005;56:443–458. doi: 10.1146/annurev.med.56.062904.144924. [DOI] [PubMed] [Google Scholar]
- Füzesi T, Sánchez E, Wittmann G, Singru PS, Fekete C, Lechan RM. Regulation of cocaine- and amphetamine-regulated transcript-synthesising neurons of the hypothalamic paraventricular nucleus by endotoxin; implications for lipopolysaccharide-induced regulation of energy homeostasis. J Neuroendocrinol. 2008;20:1058–1066. doi: 10.1111/j.1365-2826.2008.01758.x. [DOI] [PMC free article] [PubMed] [Google Scholar]
- Fyffe SL, Neul JL, Samaco RC, Chao HT, Ben-Shachar S, Moretti P, McGill BE, Goulding EH, Sullivan E, Tecott LH, Zoghbi HY. Deletion of Mecp2 in Sim1-expressing neurons reveals a critical role for MeCP2 in feeding behavior, aggression, and the response to stress. Neuron. 2008;59:947–958. doi: 10.1016/j.neuron.2008.07.030. [DOI] [PMC free article] [PubMed] [Google Scholar]
- Gerfen CR. Basic neuroanatomical methods. Curr Protoc Neurosci. 2003:1.1.7–1.1.8. doi: 10.1002/0471142301.ns0101s23. [DOI] [PubMed] [Google Scholar]
- Heinbecker P, White HL, Rolf D. Experimental obesity in the dog. Am J Physiol. 1944;141:549–565. [Google Scholar]
- Holder JL, Jr, Butte NF, Zinn AR. Profound obesity associated with a balanced translocation that disrupts the SIM1 gene. Hum Mol Genet. 2000;9:101–108. doi: 10.1093/hmg/9.1.101. [DOI] [PubMed] [Google Scholar]
- Holder JL, Jr, Zhang L, Kublaoui BM, DiLeone RJ, Oz OK, Bair CH, Lee YH, Zinn AR. Sim1 gene dosage modulates the homeostatic feeding response to increased dietary fat in mice. Am J Physiol Endocrinol Metab. 2004;287:E105–E113. doi: 10.1152/ajpendo.00446.2003. [DOI] [PubMed] [Google Scholar]
- Holtwick R, Gotthardt M, Skryabin B, Steinmetz M, Potthast R, Zetsche B, Hammer RE, Herz J, Kuhn M. Smooth muscle-selective deletion of guanylyl cyclase-A prevents the acute but not chronic effects of ANP on blood pressure. Proc Natl Acad Sci U S A. 2002;99:7142–7147. doi: 10.1073/pnas.102650499. [DOI] [PMC free article] [PubMed] [Google Scholar]
- Horvath TL. An alternate pathway for visual signal integration into the hypothalamo-pituitary axis: retinorecipient intergeniculate neurons project to various regions of the hypothalamus and innervate neuroendocrine cells including those producing dopamine. J Neurosci. 1998;18:1546–1558. doi: 10.1523/JNEUROSCI.18-04-01546.1998. [DOI] [PMC free article] [PubMed] [Google Scholar]
- Huang X, Charbeneau RA, Fu Y, Kaur K, Gerin I, MacDougald OA, Neubig RR. Resistance to diet-induced obesity and improved insulin sensitivity in mice with a regulator of G protein signaling-insensitive G184S Gnai2 allele. Diabetes. 2008;57:77–85. doi: 10.2337/db07-0599. [DOI] [PubMed] [Google Scholar]
- Hwang LL, Wang CH, Li TL, Chang SD, Lin LC, Chen CP, Chen CT, Liang KC, Ho IK, Yang WS, Chiou LC. Sex differences in high-fat diet-induced obesity, metabolic alterations and learning, and synaptic plasticity deficits in mice. Obesity. 2010;18:463–469. doi: 10.1038/oby.2009.273. [DOI] [PubMed] [Google Scholar]
- Karim MA, Sloper JC. Histogenesis of the supraoptic and paraventricular neurosecretory cells of the mouse hypothalamus. J Anat. 1980;130:341–347. [PMC free article] [PubMed] [Google Scholar]
- Kaufling J, Veinante P, Pawlowski SA, Freund-Mercier MJ, Barrot M. Afferents to the GABAergic tail of the ventral tegmental area in the rat. J Comp Neurol. 2009;513:597–621. doi: 10.1002/cne.21983. [DOI] [PubMed] [Google Scholar]
- Kennedy A, Gettys TW, Watson P, Wallace P, Ganaway E, Pan Q, Garvey WT. The metabolic significance of leptin in humans: gender-based differences in relationship to adiposity, insulin sensitivity, and energy expenditure. J Clin Endocrinol Metab. 1997;82:1293–1300. doi: 10.1210/jcem.82.4.3859. [DOI] [PubMed] [Google Scholar]
- Kublaoui BM, Holder JL, Jr, Gemelli T, Zinn AR. Sim1 haploinsufficiency impairs melanocortin-mediated anorexia and activation of paraventricular nucleus neurons. Mol Endocrinol. 2006a;20:2483–2492. doi: 10.1210/me.2005-0483. [DOI] [PubMed] [Google Scholar]
- Kublaoui BM, Holder JL, Jr, Tolson KP, Gemelli T, Zinn AR. SIM1 overexpression partially rescues agouti yellow and diet-induced obesity by normalizing food intake. Endocrinology. 2006b;147:4542–4549. doi: 10.1210/en.2006-0453. [DOI] [PubMed] [Google Scholar]
- Kublaoui BM, Gemelli T, Tolson KP, Wang Y, Zinn AR. Oxytocin deficiency mediates hyperphagic obesity of Sim1 haploinsufficient mice. Mol Endocrinol. 2008;22:1723–1734. doi: 10.1210/me.2008-0067. [DOI] [PMC free article] [PubMed] [Google Scholar]
- Lakso M, Pichel JG, Gorman JR, Sauer B, Okamoto Y, Lee E, Alt FW, Westphal H. Efficient in vivo manipulation of mouse genomic sequences at the zygote stage. Proc Natl Acad Sci U S A. 1996;93:5860–5865. doi: 10.1073/pnas.93.12.5860. [DOI] [PMC free article] [PubMed] [Google Scholar]
- Leibowitz SF, Hammer NJ, Chang K. Hypothalamic paraventricular nucleus lesions produce overeating and obesity in the rat. Physiol Behav. 1981;27:1031–1040. doi: 10.1016/0031-9384(81)90366-8. [DOI] [PubMed] [Google Scholar]
- Liu C, Goshu E, Wells A, Fan CM. Identification of the downstream targets of SIM1 and ARNT2, a pair of transcription factors essential for neuroendocrine cell differentiation. J Biol Chem. 2003;278:44857–44867. doi: 10.1074/jbc.M304489200. [DOI] [PubMed] [Google Scholar]
- Michaud JL, Rosenquist T, May NR, Fan CM. Development of neuroendocrine lineages requires the bHLH-PAS transcription factor SIM1. Genes Dev. 1998;12:3264–3275. doi: 10.1101/gad.12.20.3264. [DOI] [PMC free article] [PubMed] [Google Scholar]
- Michaud JL, Boucher F, Melnyk A, Gauthier F, Goshu E, Lévy E, Mitchell GA, Himms-Hagen J, Fan CM. Sim1 haploinsufficiency causes hyperphagia, obesity and reduction of the paraventricular nucleus of the hypothalamus. Hum Mol Genet. 2001;10:1465–1473. doi: 10.1093/hmg/10.14.1465. [DOI] [PubMed] [Google Scholar]
- Minichiello L, Korte M, Wolfer D, Kühn R, Unsicker K, Cestari V, Rossi-Arnaud C, Lipp HP, Bonhoeffer T, Klein R. Essential role for TrkB receptors in hippocampus-mediated learning. Neuron. 1999;24:401–414. doi: 10.1016/s0896-6273(00)80853-3. [DOI] [PubMed] [Google Scholar]
- Paxinos G, Franklin KBJ. The mouse brain in stereotaxic coordinates. Ed 2. San Diego: Academic; 2001. [Google Scholar]
- Rinaman L. Ontogeny of hypothalamic-hindbrain feeding control circuits. Dev Psychobiol. 2006;48:389–396. doi: 10.1002/dev.20146. [DOI] [PubMed] [Google Scholar]
- Rios M, Fan G, Fekete C, Kelly J, Bates B, Kuehn R, Lechan RM, Jaenisch R. Conditional deletion of brain-derived neurotrophic factor in the postnatal brain leads to obesity and hyperactivity. Mol Endocrinol. 2001;15:1748–1757. doi: 10.1210/mend.15.10.0706. [DOI] [PubMed] [Google Scholar]
- Saper CB, Loewy AD, Swanson LW, Cowan WM. Direct hypothalamo-autonomic connections. Brain Res. 1976;117:305–312. doi: 10.1016/0006-8993(76)90738-1. [DOI] [PubMed] [Google Scholar]
- Schmidt-Supprian M, Rajewsky K. Vagaries of conditional gene targeting. Nat Immunol. 2007;8:665–668. doi: 10.1038/ni0707-665. [DOI] [PubMed] [Google Scholar]
- Shimada M, Nakamura T. Time of neuron origin in mouse hypothalamic nuclei. Exp Neurol. 1973;41:163–173. doi: 10.1016/0014-4886(73)90187-8. [DOI] [PubMed] [Google Scholar]
- Srinivas S, Watanabe T, Lin CS, William CM, Tanabe Y, Jessell TM, Costantini F. Cre reporter strains produced by targeted insertion of EYFP and ECFP into the ROSA26 locus. BMC Dev Biol. 2001;1:4. doi: 10.1186/1471-213X-1-4. [DOI] [PMC free article] [PubMed] [Google Scholar]
- Truett GE, Heeger P, Mynatt RL, Truett AA, Walker JA, Warman ML. Preparation of PCR-quality mouse genomic DNA with hot sodium hydroxide and tris (HotSHOT) Biotechniques. 2000;29:52, 54. doi: 10.2144/00291bm09. [DOI] [PubMed] [Google Scholar]
- Ward MP, Mosher JT, Crews ST. Regulation of bHLH-PAS protein subcellular localization during Drosophila embryogenesis. Development. 1998;125:1599–1608. doi: 10.1242/dev.125.9.1599. [DOI] [PubMed] [Google Scholar]
- West MJ, Slomianka L, Gundersen HJ. Unbiased stereological estimation of the total number of neurons in the subdivisions of the rat hippocampus using the optical fractionator. Anat Rec. 1991;231:482–497. doi: 10.1002/ar.1092310411. [DOI] [PubMed] [Google Scholar]
- Xu C, Fan CM. Allocation of paraventricular and supraoptic neurons requires Sim1 function: a role for a Sim1 downstream gene PlexinC1. Mol Endocrinol. 2007;21:1234–1245. doi: 10.1210/me.2007-0034. [DOI] [PubMed] [Google Scholar]
- Yang C, Gagnon D, Vachon P, Tremblay A, Levy E, Massie B, Michaud JL. Adenoviral-mediated modulation of Sim1 expression in the paraventricular nucleus affects food intake. J Neurosci. 2006;26:7116–7120. doi: 10.1523/JNEUROSCI.0672-06.2006. [DOI] [PMC free article] [PubMed] [Google Scholar]
- Zammaretti F, Panzica G, Eva C. Sex-dependent regulation of hypothalamic neuropeptide Y-Y1 receptor gene expression in moderate/high fat, high-energy diet-fed mice. J Physiol. 2007;583:445–454. doi: 10.1113/jphysiol.2007.133470. [DOI] [PMC free article] [PubMed] [Google Scholar]