

Abstract
Objective
Ovarian cancer has very heterogeneous histological classification, and response to therapy of the same grade and type varies. We studied genes in the Wnt and hedgehog (Hh) pathways, which are essential for embryonic development and which play critical roles in proliferation in a variety of human cancers. Variations in these pathway genes causing proliferation could play a role in the variation in tumor progression and response to therapy.
Methods/Materials
Using real-time polymerase chain reaction, we studied 16 primary grade 3 International Federation of Gynecology and Obstetrics stage III serous ovarian cancer samples for expression of the Wnt pathway gene AXIN2, fibroblast growth factor 9, and Hh pathway gene expressions of glioma-associated oncogene 1, glioma-associated oncogene 2, patched homolog 1, patched homolog 2, Indian Hedgehog (HH), sonic HH, and Smoothened, a G protein–coupled receptor protein. Normal ovary epithelial cell line was used as control.
Results
We found wide variation of up-regulation of pathway component and target genes in the primary tumor samples and apparent cross talk between the pathways. AXIN2, a Wnt target gene, showed increased expression in all serous ovarian cancer samples. Fibroblast growth factor 9 was also overexpressed in all tumors with greater than1000-fold increase in gene expression in 4 tumors. Expression of Hh pathway genes varied greatly. More than half of the tumor samples showed involvement of Hh signaling or pathway activation either by expression of transcription factors and Hh ligands or by overexpression of Indian HH/sonic HH and the receptor-encoding patched homolog 1/patched homolog 2.
Conclusion
We found a wide variation in fold expression of genes involved in the Wnt and Hh pathway between patient samples.
Keywords: Ovarian cancer, Wnt, Hedgehog
Ovarian cancer is the leading cause of death from gynecological cancer in the United States, with estimated 13,850 deaths in 2010. Most patients are initially diagnosed with stage III or IV disease. Despite good responses to the initial treatment, which includes surgery followed by che-motherapy, less than 30% of these patients survive 5 years after diagnosis.1 The origin and pathogenesis of epithelial ovarian cancer, which accounts for 80% to 90% of all ovarian malignancies is still controversial. The most common histological type of epithelial ovarian cancer is serous papillary (55% to 60%). Less common subtypes are endometrioid, clear cell, mucinous, and undifferentiated. There is accumulating evidence that high-grade serous ovarian cancer does not originate from the ovarian surface epithelium but arises in the fimbrial epithelium of the fallopian tube, which secondarily implants to the ovary.2,3 Epithelial ovarian tumors exhibit a considerable intratumoral heterogeneity, where the final pathological classification of the tumor depends on the predominant histological characteristics of the specimen. Thus, the histological subtypes represent not distinct sub-groups but rather overlapping entities.
Molecular pathways such as the Wnt or Hedgehog (Hh) signaling pathways participate in and propagate many phys-iologic developmental events in normal embryogenesis, as differentiation and proliferation are known to lead to tumor formation when aberrantly activated. Wnt and Hh signaling is active in many cancers.4
The Wnt pathway has been well studied in a number of cancers, where β-catenin mutations could be identified, no-tably colorectal cancer.5 In ovarian carcinoma, however, the detection of a high-rate (approximately 40%) of β-catenin mutations was confined to the endometrioid subtype of epithelial ovarian cancer.6-8 Further studies of this subtype showed that the fibroblast growth factor 9 (FGF9) was sig-nificantly overexpressed in the endometrioid ovarian cancer specimens that carried Wnt/β-catenin pathway deregulations.9 Axis inhibition protein 2 (AXIN2) is a negative regulator of the Wnt/β-catenin pathway and functions by participating in a negative feedback loop to limit the duration and intensity of a Wnt initiated signal. This effect is demonstrated in some solid tumors such as colorectal carcinoma, colorectal and liver tumors, craniopharyngiomas, hepatoblastoma, and rare pancreatic tumors. Little is known about the expression level of AXIN2 in ovarian cancer.
Sonic hedgehog (SHH) and Indian HH (IHH) are se-creted proteins in the Hh pathway. Sonic hedgehog functions by binding and inactivating its receptor proteins, patched homolog 1 (PTCH-1) and PTCH-2 on target cells. Patched homolog 1 (and, possibly, PTCH-2), inhibits signaling through a physical interaction with a 7-span transmembrane protein, Smoothened (SMO), a signal transducer (or oncogene). On Hh ligand binding to PTCH, repression of SMO is abolished and signals are transduced through several kinases to the nucleus, which activates the GLI transcription factors.10
Hedgehog signaling pathway was shown to be associated with the tumorigenesis of basal cell, pancreas, prostate, digestive tract, glioma, and non–small cell lung cancers.11 Recently, data implicated the Hh pathway in ovarian cancer.12-14 However, the data are inconsistent, and more research is clearly needed. Yauch et al15 described a paracrine requirement for Hh signaling in the development of Hh-dependent tumor growth. Now there is evidence for an intrin-sic intratumoral and extrinsic microenvironment Hh signaling.
In this report, we studied the activation of Wnt-related and Hh signaling genes in 16 primary grade 3 International Federation of Gynecology and Obstetrics (FIGO) stage III serous papillary ovarian tumors. For the Wnt pathway level, we looked at the expression of AXIN2 (negative feedback) and FGF9, which may function as a downstream growth factor in tumors. The Hh pathway activation was studied by the gene expressions of glioma-associated oncogene 1 (GLI1), GLI2, SMO, PTCH1, PTCH2, IHH, and SHH.
MATERIALS AND METHODS
Primary Tumor Samples
Sixteen primary grade 3 FIGO stage III serous papillary ovarian tumor samples (solid tumor samples or tumor cells from ascites) samples were obtained at the time of primary ovarian cancer surgery at Stanford (Division of Gynecologic Oncology). All tumors were diagnosed by Stanford Pathology at an advanced stage according to the FIGO cri-teria. The analysis of tissue from human subjects was ap-proved by the Stanford University Institutional Review Board (IRB Protocol ID: 13939; IRB Number 6208).
Tumor Sample Processing
Ascites samples were removed immediately upon entry into the abdomen. Ascites samples were centrifuged to yield a cell pellet. In samples with significant blood contamination, a red blood cell lysis step was performed using a solution of 0.14-mol/L ammonium chloride (Gibco, Invitrogen, Carlsbad, Calif). The remaining cells were washed in Hanks balanced salt solution supplemented with 2% fetal bovine serum (FBS) and counted. The cells not used for immediate experimenta-tion were frozen in liquid nitrogen with 90% FBS and 10% dimethyl sulfoxide. Solid tumor specimens were processed by mechanical and enzymatic dissociation. Samples were finely minced with a scalpel to produce maximal surface area, then incubated in dissociating solution (medium 199 with collagenase D; Roche Applied Science USA), 200 Units/mL; 14-μL/mL liberase 2 (Roche); 14-μL/mL liberase 4 (Roche); and 200-μL/mL DNase (Roche) at 37°C for 1 to 3 hours. The cells were then filtered through a 70-μm nylon mesh (BD Falcon, Franklin Lakes, NJ), washed with Hanks balanced salt solution/2% FBS and counted. An aliquot of the cells was stained with antibodies and analyzed on an LSRII flow cy-tometer (BD Bioscience Rockeville, Md) running Cell Quest to determine percentage of tumor cells.
Cell Lines
IOSE-398 cells (normal human ovarian surface epithelial cells immortalized with SV40 T/t) were a gift of the Canadian Ovarian Tissue Bank and Dr D Huntsman (University of British Columbia, Vancouver, British Columbia, Canada). The cells were cultured in 1:1 mixture of MCDB 105 medium and medium 199 with 5% FBS and 50-g/mL gentamycin.
RNA Isolation and cDNA Synthesis
Total RNA was extracted using RNeasy Mini Kit and RNase-Free DNase Set (Qiagen, Valencia, Calif). Total RNA concentrations were measured using NanoDrop 1000 (Thermo Scientific, Waltham, Mass). Complementary DNA was synthesized from 1-μg total RNA using iScript cDNA Synthesis kit (Bio-Rad, Hercules, Calif).
Quantitative Real-Time Polymerase Chain Reaction
Wnt and Hh pathway gene expression were quantitatively assessed by Taqman quantitative real-time polymerase chain reaction (qRT-PCR), and transcript levels were normalized to the housekeeping genes TBP and GUSB, respectively. Results are expressed as normalized expression values relative to the values of the control cell line IOSE 398. For AXIN2, FGF9, GLI2, and TATA box-binding protein (TBP), inventoried Taqman assays (Applied Biosystems, Carlsbad, Calif) were used. TATA box-binding protein was used as the housekeeping gene. For GLI1, PTCH1, PTCH2, SHH, IHH, and SMO, we used β-glucuronidase (GUSB) as the housekeeping gene. The same custom-made primer/probes (Applied Biosystems) were used as deployed in the experiments by Yauch et al.15 All experiments were run on Applied Biosystems 7300 Fast Real-Time PCR System using the Taqman Universal PCR Master Mix (Applied Biosystems) for the reactions following the manufacturers’ protocols for the 2-step qRT-PCR.
RESULTS
Gene expression in 16 primary grade 3 FIGO stage III serous ovarian cancer tumors were assayed compared to the gene expression level in the IOSE-398 (normal human ovarian surface epithelial) cells that were used as normalizing control. IOSE-398 was used as a baseline control for all assays because of the difficulty of obtaining normal ovarian epithelial cells. We found a striking up-regulation of the Wnt pathway gene AXIN2 and target gene FGF9 in all serous papillary ovarian cancer samples (Table 1). AXIN2 and FGF9 were consistently up-regulated in advanced serous ovarian cancer indicating probable translocation of β-catenin and transcription of FGF9 RNA. The messenger RNA (mRNA) level of AXIN2 and FGF9 varied widely but was increased in serous papillary ovarian cancer samples 55- and more than 1600-fold, respectively, compared to the control values of IOSE-398 (Fig. 1). There was no correlation between degree of fold increase of FGF9 and the Wnt suppressor, AXIN2.
TABLE 1.
Wnt pathway gene expression was quantitatively assessed by Taqman qRT-PCR and transcript levels were normalized to the housekeeping gene TBP
| Sample | FIGO Stage* | Grade† | Age | AXIN2 | AXIN2 SD | FGF9 | FGF9 SD |
|---|---|---|---|---|---|---|---|
| 20 | III | 3 | 58 | 5.90 | 0.43 | 101.47 | 7.82 |
| 22 | III | 3 | 66 | 10.46 | 1.37 | 26.44 | 3.45 |
| 52A | IIIC | 3 | 60 | 16.20 | 0.89 | 154.80 | 24.23 |
| 53A | IIIC | 3 | 67 | 14.66 | 2.11 | 928.93 | 109.46 |
| 56A | IIIC | 3 | 63 | 9.04 | 1.93 | 489.14 | 35.23 |
| 58M | IIIC | 3 | 70 | 6.89 | 0.29 | 332.97 | 25.73 |
| 60M | IIIC | 3 | 66 | 75.84 | 4.97 | 10085.25 | 1161.01 |
| 66A | IIIC | 3 | 84 | 11.80 | 2.16 | 1831.14 | 60.41 |
| 68M | IIIC | 3 | 52 | 53.52 | 4.77 | 110.65 | 51.35 |
| 73P | IIIC | 3 | 62 | 344.56 | 30.68 | 398.63 | 32.19 |
| 76P | IIIC | 3 | 63 | 55.10 | 17.72 | 885.67 | 163.04 |
| 78M | IIIC | 3 | 67 | 133.02 | 39.29 | 1320.56 | 91.83 |
| 79P | IIIA | 3 | 46 | 54.38 | 3.22 | 278.46 | 54.15 |
| 80A | IIIC | 3 | 80 | 51.42 | 4.19 | 10182.95 | 2016.78 |
| 84 | IIIC | 3 | 45 | 83.39 | 11.81 | 312.16 | 56.89 |
| 87A | IIIC | 3 | 69 | 12.34 | 0.86 | 242.24 | 64.23 |
Results are expressed as normalized expression values relative to the values of the control cell line IOSE 398.
Staging was based on Pecorelli S, Ngan HYS, Hacker NF, editors. Staging Classifications and Clinical Practice Guidelines for Gynaecological Cancers. A collaboration between FIGO and IGCS. 3rd ed. London: FIGO; 2006.
Grading was based on AJCC Cancer Staging Manual, 7th Edition (2010).
Superscripted A, Ascites; superscripted M, metastasis (omentum, pararectal tumor mass); superscripted P, primary tumor (ovary); AXIN2, gene that encodes Axin2 (axis inhibition protein 2); FGF9, gene that encodes FGF9 (fibroblast growth factor 9).
FIGURE 1.
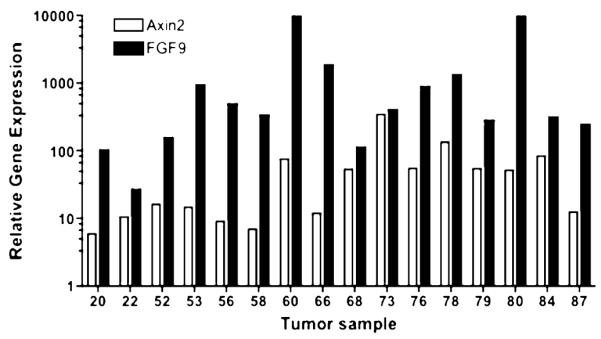
Relative gene expression of AXIN2 and FGF9 normalized to normal ovary epithelial cell line IOSE 398 for 16 primary grade 3 serous ovarian cancer samples.
Hedgehog pathway gene expression was variable (Table 2; Fig. 2). The Hh pathway was active in 4 tumors (2 or more genes) with expression of either PTCH1 or PTCH 2 and activated transcription genes GLI1 or GLI2. Five tumors had up-regulation of IHH/SHH and PTCH without an increase in the transcription factors. In all samples, there was no increase in SMO (transducer) mRNA expression. Tumor samples with expression of IHH and/or SHH genes showed a higher expression of FGF9 mRNA than those without expression, indicating FGF9 activation may occur through Hh ligand activation, although independent activation was not ruled out. Interestingly, most samples with expression of the Hh ligand used IHH, an alternate gene.
TABLE 2.
Hedgehog pathway gene expression was quantitatively assessed by Taqman qRT-PCR, and transcript levels were normalized to the housekeeping genes TBP and GUSB, respectively
| Sample | FIGO Stage* |
Grade† | Age | GLI1 | GLI1 SD |
GLI2 | GLI2 SD |
SMO | SMO SD |
PTCH1 | PTCH1 SD |
PTCH2 | PTCH2 SD |
IHH | IHH SD |
SHH | SHH SD |
|---|---|---|---|---|---|---|---|---|---|---|---|---|---|---|---|---|---|
| 20 | III | G3 | 58 | 0.02 | 0.01 | 0.01 | 0.00 | 0.18 | 0.01 | 1.16 | 0.09 | 4.16 | 0.61 | 0.90 | 0.53 | 0.00 | 0.00 |
| 22 | III | G3 | 66 | 0.04 | 0.02 | 0.10 | 0.01 | 0.21 | 0.03 | 2.82 | 0.16 | 0.83 | 0.10 | 1.25 | 0.26 | 0.00 | 0.00 |
| 52A | IIIC | G3 | 60 | 0.05 | 0.01 | 0.10 | 0.02 | 0.06 | 0.00 | 0.20 | 0.01 | 1.60 | 0.08 | 0.72 | 0.33 | 0.00 | 0.00 |
| 53A | IIIC | G3 | 67 | 0.13 | 0.02 | 0.32 | 0.05 | 0.06 | 0.01 | 0.37 | 0.03 | 0.69 | 0.06 | 0.29 | 0.12 | 0.02 | 0.02 |
| 56A | IIIC | G3 | 63 | 0.03 | 0.01 | 0.19 | 0.02 | 0.05 | 0.01 | 0.11 | 0.03 | 0.16 | 0.01 | 0.05 | 0.03 | 0.20 | 0.12 |
| 58M | IIIC | G3 | 70 | 0.05 | 0.01 | 0.13 | 0.03 | 0.04 | 0.01 | 0.10 | 0.01 | 0.29 | 0.04 | 0.73 | 0.22 | 0.00 | 0.00 |
| 60M | IIIC | G3 | 66 | 0.21 | 0.04 | 0.67 | 0.07 | 1.02 | 0.09 | 7.19 | 0.86 | 1.86 | 0.35 | 6.18 | 2.61 | 0.23 | 0.00 |
| 66A | IIIC | G3 | 84 | 10.76 | 2.26 | 1.40 | 0.13 | 0.10 | 0.01 | 3.43 | 0.50 | 2.10 | 0.22 | 1.43 | 0.19 | 0.57 | 0.09 |
| 68M | IIIC | G3 | 52 | 0.09 | 0.03 | 0.16 | 0.03 | 0.04 | 0.01 | 0.29 | 0.07 | 3.33 | 0.26 | 3.90 | 1.62 | 0.00 | 0.00 |
| 73P | IIIC | G3 | 62 | 0.28 | 0.04 | 1.70 | 0.05 | 0.19 | 0.04 | 2.24 | 0.21 | 2.59 | 0.20 | 2.37 | 1.12 | 3.63 | 1.08 |
| 76P | IIIC | G3 | 63 | 0.26 | 0.17 | 1.26 | 0.85 | 0.50 | 0.07 | 2.11 | 0.14 | 0.87 | 0.11 | 0.45 | 0.33 | 0.00 | 0.00 |
| 78M | IIIC | G3 | 67 | 1.25 | 0.09 | 1.17 | 0.24 | 0.74 | 0.10 | 1.22 | 0.03 | 1.48 | 0.42 | 10.52 | 1.37 | 0.76 | 0.93 |
| 79P | IIIA | G3 | 46 | 0.28 | 0.08 | 0.89 | 0.04 | 0.79 | 0.04 | 1.75 | 0.20 | 1.54 | 0.21 | 41.96 | 13.09 | 1.64 | 0.00 |
| 80A | IIIC | G3 | 80 | 3.18 | 0.72 | 7.34 | 1.46 | 1.19 | 0.24 | 6.21 | 0.95 | 1.13 | 0.11 | 3.63 | 0.09 | 36.80 | 13.81 |
| 84 | IIIC | G3 | 45 | 0.25 | 0.19 | 1.57 | 0.26 | 0.68 | 0.20 | 5.35 | 0.58 | 4.68 | 1.02 | 2.12 | 0.30 | 1.85 | 0.69 |
| 87A | IIIC | G3 | 69 | 0.56 | 0.05 | 0.04 | 0.01 | 0.77 | 0.24 | 3.53 | 0.38 | 7.25 | 1.30 | 2.91 | 0.64 | 12.27 | 1.63 |
Results are expressed as normalized expression values relative to the values of the control cell line IOSE 398.
Stages are based on Pecorelli S, Ngan HYS, Hacker NF, editors. Staging Classifications and Clinical Practice Guidelines for Gynaecological Cancers. A collaboration between FIGO and IGCS. 3rd ed. London: FIGO; 2006.
Grades are based on AJCC Cancer Staging Manual, 7th Edition (2010).
GLI1, gene that encodes glioma-associated oncogene 1 (Gli1); GLI2, gene that encodes Gli2; IHH, gene that encodes Indian HH; PTCH1, gene that encodes the receptor protein patched homolog 1 (Patched1); PTCH2, gene that encodes the receptor protein Patched2; SHH, gene that encodes sonic hedgehog; SMO, gene that encodes Smoothened, a G proteinYcoupled receptor protein.
FIGURE 2.
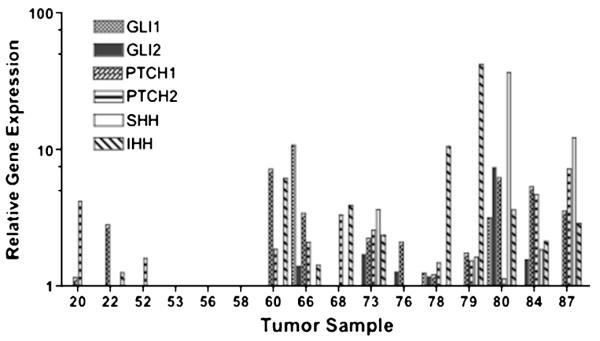
Relative gene expression of Hh pathway genes normalized to normal ovary epithelial cell line IOSE 398 for 16 primary grade 3 serous ovarian cancer samples.
DISCUSSION
The published data concerning the Hh signaling pathway in ovarian cancer are contradictory.12-14 Whereas some authors use immunohistochemistry to define and classify Hh pathway activation, others use in situ hybridization and/or semiquantitative and qRT-PCR. One of the main obstacles to compare the results of the published data is that each group uses arbitrary and often nonreproducible “normal” controls for the experiments as well as tumor samples with heterogeneous histological type and stage.
One subset of patients (25%) in our study had increased expression of the Hh signaling and transcription factors GLI2. Five patients showed expression of Hh ligand genes and PTCH without up-regulating transcription. This lower percentage of expressed Hh ligand genes and GLI correlates with that described by Yang et al14 using gene expression.
There was no increase in the expression of SMO. Currently, there are 2 promising small molecule inhibitors of SMO being studied in clinical trials (IPI-926 and GDC-0449), both including patients with ovarian cancer. However, in the 16 patients with serous ovarian carcinoma, assayed pathway activation did not involve SMO. Hedgehog pathway can be deregulated/hyperactivated without overexpression of SMO, as in the case of loss of function of PTCH mutation or down-regulation of PTCH, and in these cases, SMO inhibitors can inhibit the Hh signaling.16
This heterogeneity is consistent with the recent pub-lications15,17 on the paracrine requirement for Hh signaling in cancer where tumor cells activate the Hh pathway of the cells of their microenvironment by secreting Hh ligand proteins, thus activating the pathway in nonmalignant stromal cells. Our data, however, indicate that besides paracrine Hh signaling, there is an additional autocrine signaling mechanism involved in certain tumors.
Wnt pathway–associated genes AXIN2 and FGF9 were overexpressed in all tumors compared to IOSE-398. The research of Wnt signaling pathway in epithelial ovarian cancer has mostly focused on studying the endometrioid subtype in which consistently high rates of β-catenin mutations can be detected.7,18 Studies conducted on endometrioid ovarian tumors comparing those with mutant β-catenin to those without mutation described FGF9 as an indirect downstream target gene of the Wnt pathway in endometrioid ovarian cancer.9 Serous ovarian cancer does not carry significant β-catenin mutations.19 However, our data show overexpressed AXIN2 and FGF9 genes in serous papillary ovarian cancers. AXIN2 is established as a direct target gene of the Wnt pathway in an increasing number of solid tumors.4,20 A recent paper from the Ovarian Cancer Association Consortium using functional suppression of tumorgenicity and microarray analysis identified AXIN2 as one of 9 genes associated with ovarian cancer. Using transcribed single nucleotide polymorphism, loss of heterozygosity was found for AXIN2 in 64% of samples.21 Dimova et al22 published potential genomic markers for ovarian cancer, using comparative genomic hybridization analysis. One of those markers is the locus of the AXIN2 gene on chromosome 17. Activation of the Wnt pathway may be due to AXIN2 mutations, which abrogate its function as a Wnt suppressor.
Although identified as a downstream gene of the Wnt pathway, FGF9 is an important growth factor in morpho-genesis in the embryo and can activate the Hh pathway.23,24 The high expression of this growth factor by various activating mechanisms may be an important component in all ovarian cancers.
A cross talk between the Hh and Wnt signaling in cancer was reported in gastric and skin cancer. Liao et al25 recently reported the interaction of GLI1 and β-catenin in endometrial cancer cell lines, in which overexpression of GLI1 led to increased nuclear β-catenin expression.
This study shows a wide variation in fold expression of assayed genes as well as heterogeneity of expression of genes between patient samples of the same histological type and grade. The heterogeneity of gene expression and interactions of the Wnt and the Hh pathway activation is possibly one of the reasons for drug resistance in ovarian cancer. Developing gene screening assays and targeted therapies aiming not only at one, but all, affected pathways may be pivotal to overcome the so far unsatisfactory long-term results of conventional therapeutic regimen in advanced ovarian cancer.
Acknowledgments
The United States Department of Defense funded this work through Grant No. W81XWH-07-1-0467.
REFERENCES
- 1.Jemal A, Siegel R, Xu J, et al. Cancer statistics, 2010. CA Cancer J Clin. 2010;60:277–300. doi: 10.3322/caac.20073. [DOI] [PubMed] [Google Scholar]
- 2.Kurman RJ, Shih Ie M. The origin and pathogenesis of epithelial ovarian cancer: a proposed unifying theory. Am J Surg Pathol. 2010;34:433–443. doi: 10.1097/PAS.0b013e3181cf3d79. [DOI] [PMC free article] [PubMed] [Google Scholar]
- 3.Auersperg N. The origin of ovarian carcinomas: a unifying hypothesis. Int J Gynecol Pathol. 2011;30:12–21. doi: 10.1097/PGP.0b013e3181f45f3e. [DOI] [PubMed] [Google Scholar]
- 4.MacDonald BT, Tamai K, He X. Wnt/beta-catenin signaling: components, mechanisms, and diseases. Dev Cell. 2009;17:9–26. doi: 10.1016/j.devcel.2009.06.016. [DOI] [PMC free article] [PubMed] [Google Scholar]
- 5.Morin PJ, Sparks AB, Korinek V, et al. Activation of beta-catenin-Tcf signaling in colon cancer by mutations in beta-catenin or APC. Science. 1997;275:1787–1790. doi: 10.1126/science.275.5307.1787. [DOI] [PubMed] [Google Scholar]
- 6.Wu R, Zhai Y, Fearon ER, et al. Diverse mechanisms of beta-catenin deregulation in ovarian endometrioid adenocarcinomas. Cancer Res. 2001;61:8247–8255. [PubMed] [Google Scholar]
- 7.Palacios J, Gamallo C. Mutations in the beta-catenin gene (CTNNB1) in endometrioid ovarian carcinomas. Cancer Res. 1998;58:1344–1347. [PubMed] [Google Scholar]
- 8.Gatcliffe TA, Monk BJ, Planutis K, et al. Wnt signaling in ovarian tumorigenesis. Int J Gynecol Cancer. 2008;18:954–962. doi: 10.1111/j.1525-1438.2007.01127.x. [DOI] [PMC free article] [PubMed] [Google Scholar]
- 9.Hendrix ND, Wu R, Kuick R, et al. Fibroblast growth factor 9 has oncogenic activity and is a downstream target of Wnt signaling in ovarian endometrioid adenocarcinomas. Cancer Res. 2006;66:1354–1362. doi: 10.1158/0008-5472.CAN-05-3694. [DOI] [PubMed] [Google Scholar]
- 10.Ruiz i Altaba A. Hedgehog-Gli Signaling in Human Disease. Landes Bioscience, Springer; Austin, TX: 2006. [Google Scholar]
- 11.Merchant AA, Matsui W. Targeting hedgehog—a cancer stem cell pathway. Clin Cancer Res. 2010;16:3130–3140. doi: 10.1158/1078-0432.CCR-09-2846. [DOI] [PMC free article] [PubMed] [Google Scholar]
- 12.Liao X, Siu MK, Au CW, et al. Aberrant activation of hedgehog signaling pathway in ovarian cancers: effect on prognosis, cell invasion and differentiation. Carcinogenesis. 2009;30:131–140. doi: 10.1093/carcin/bgn230. [DOI] [PMC free article] [PubMed] [Google Scholar]
- 13.Bhattacharya R, Kwon J, Ali B, et al. Role of hedgehog signaling in ovarian cancer. Clin Cancer Res. 2008;14:7659–7666. doi: 10.1158/1078-0432.CCR-08-1414. [DOI] [PubMed] [Google Scholar]
- 14.Yang L, He J, Huang S, et al. Activation of hedgehog signaling is not a frequent event in ovarian cancers. Mol Cancer. 2009;8:112. doi: 10.1186/1476-4598-8-112. [DOI] [PMC free article] [PubMed] [Google Scholar]
- 15.Yauch RL, Gould SE, Scales SJ, et al. A paracrine requirement for hedgehog signalling in cancer. Nature. 2008;455:406–410. doi: 10.1038/nature07275. [DOI] [PubMed] [Google Scholar]
- 16.Nolan-Stevaux O, Lau J, Truitt ML, et al. GLI1 is regulated through Smoothened-independent mechanisms in neoplastic pancreatic ducts and mediates PDAC cell survival and transformation. Genes Dev. 2009;23:24–36. doi: 10.1101/gad.1753809. [DOI] [PMC free article] [PubMed] [Google Scholar]
- 17.Theunissen JW, de Sauvage FJ. Paracrine Hedgehog signaling in cancer. Cancer Res. 2009;69:6007–6010. doi: 10.1158/0008-5472.CAN-09-0756. [DOI] [PubMed] [Google Scholar]
- 18.Schwartz DR, Wu R, Kardia SL, et al. Novel candidate targets of beta-catenin/T-cell factor signaling identified by gene expression profiling of ovarian endometrioid adenocarcinomas. Cancer Res. 2003;63:2913–2922. [PubMed] [Google Scholar]
- 19.Sarrio D, Moreno-Bueno G, Sanchez-Estevez C, et al. Expression of cadherins and catenins correlates with distinct histologic types of ovarian carcinomas. Hum Pathol. 2006;37:1042–1049. doi: 10.1016/j.humpath.2006.03.003. [DOI] [PubMed] [Google Scholar]
- 20.Jho EH, Zhang T, Domon C, et al. Wnt/beta-catenin/Tcf signaling induces the transcription of Axin2, a negative regulator of the signaling pathway. Mol Cell Biol. 2002;22:1172–1183. doi: 10.1128/MCB.22.4.1172-1183.2002. [DOI] [PMC free article] [PubMed] [Google Scholar]
- 21.Notaridou M, Quaye L, Dafou D, et al. Common alleles in candidate susceptibility genes associated with risk and development of epithelial ovarian cancer. Int J Cancer. 2011;128:2063–2074. doi: 10.1002/ijc.25554. [DOI] [PMC free article] [PubMed] [Google Scholar]
- 22.Dimova I, Orsetti B, Negre V, et al. Genomic markers for ovarian cancer at chromosomes 1, 8 and 17 revealed by array CGH analysis. Tumori. 2009;95:357–366. doi: 10.1177/030089160909500315. [DOI] [PubMed] [Google Scholar]
- 23.Lavine KJ, White AC, Park C, et al. Fibroblast growth factor signals regulate a wave of Hedgehog activation that is essential for coronary vascular development. Genes Dev. 2006;20:1651–1666. doi: 10.1101/gad.1411406. [DOI] [PMC free article] [PubMed] [Google Scholar]
- 24.White AC, Xu J, Yin Y, et al. FGF9 and SHH signaling coordinate lung growth and development through regulation of distinct mesenchymal domains. Development. 2006;133:1507–1517. doi: 10.1242/dev.02313. [DOI] [PubMed] [Google Scholar]
- 25.Liao X, Siu MK, Au CW, et al. Aberrant activation of hedgehog signaling pathway contributes to endometrial carcinogenesis through beta-catenin. Mod Pathol. 2009;22:839–847. doi: 10.1038/modpathol.2009.45. [DOI] [PubMed] [Google Scholar]