Abstract
Objective
This study aims to analyze how much heart rate variability (HRV) indices discriminatively respond to age and severity of sleep apnea in the obstructive sleep apnea syndrome (OSAS).
Methods
176 male OSAS patients were classified into four groups according to their age and apnea-hypopnea index (AHI). The HRV indices were compared via analysis of covariance (ANCOVA). In particular, the partial correlation method was performed to identify the most statistically significant HRV indices in the time and frequency domains. Stepwise multiple linear regressions were further executed to examine the effects of age, AHI, body mass index (BMI), systolic blood pressure (SBP), diastolic blood pressure (DBP), and sleep parameters on the significant HRV indices.
Results
The partial correlation analysis yielded the NN50 count (defined as the number of adjacent R-wave to R-wave intervals differing by more than 50 ms) and low frequency/high frequency (LF/HF) ratio to be two most statistically significant HRV indices in both time and frequency domains. The two indices showed significant differences between the groups. The NN50 count was affected by age (p<0.001) and DBP (p=0.039), while the LF/HF ratio was affected by AHI (p<0.001), the amount of Stage 2 sleep (p=0.005), and age (p=0.021) in the order named in the regression analysis.
Conclusion
The NN50 count more sensitively responded to age than to AHI, suggesting that the index is mainly associated with an age-related parasympathetic system. On the contrary, the LF/HF ratio responded to AHI more sensitively than to age, suggesting that it is mainly associated with a sympathetic tone likely reflecting the severity of sleep apnea.
Keywords: Heart rate variability index, Obstructive sleep apnea syndrome, Apnea-hypopnea index, Age
INTRODUCTION
Obstructive sleep apnea syndrome (OSAS) is caused by recurrent obstructions of the upper airway that last for over 10 seconds during sleep despite breathing effort. OSAS is a common disease, with an incidence of 3-7% in adult males and 2-5% in adult females.1 Clinically, this syndrome has considerable influence on personal health, causing excessive sleepiness during daytime, narcolepsy, mental disorders including cognitive decline, and displeasure or depression, as well as physical complications such as obesity, diabetes, gastroesophageal reflux, stroke, pulmonary hypertension, systematic hypertension, coronary artery disease, and cardiac arrhythmia.2-4 Impairment of cardiovascular system control can also occur in OSAS patients.5 Significant changes in heart rate variability (HRV) and blood pressure can be observed in OSAS patients, which seem to increase the risk of cardiovascular disease.6-8
HRV is physiological variability in the heart rate over time due to the interaction between the sympathetic and parasympathetic nervous systems, and it is influenced by the effect of changes in the autonomic nervous system on the sinoatrial node caused by both internal and external stimuli.9 HRV monitoring is a non-invasive method of measuring autonomic nerve function in the cardiovascular system. Decreased HRV (i.e., decreased variability) indicates abnormal adaptability of the autonomic nervous system and is reportedly associated with several diseases, such as renal failure, hepatic insufficiency, and diabetes, as well as cardiovascular conditions such as congestive heart failure and myocardial infarction.10
Changes in HRV indices were previously suggested as an alternative diagnostic tool for OSAS.11,12 Patients with more severe OSAS exhibited a higher low frequency/high frequency (LF/HF) ratio, which reflects the balance between the sympathetic and parasympathetic nervous systems.13,14 Another study suggested that the marked rise in very low frequency (VLF) signal during sleep in severe OSAS patients, in contrast to the lack of such a change in mild OSAS patients, may represent a tool for determining the severity of OSAS.15 Narkiewicz et al. reported that patients with moderate to severe OSAS had shorter RR intervals (defined as the time between two consecutive R waves in the electrocardiogram) and increased sympathetic burst frequency compared with control subjects.16 Furthermore, blood pressure variability in patients with moderate to severe OSAS was more than double that in controls. Mild OSAS patients exhibited reduced RR variability compared with controls in the absence of any significant difference in absolute RR interval. For all patients with OSAS, linear regression analysis showed a positive correlation between sleep apnea severity and blood pressure variability.16 However, no clear conclusion can be drawn regarding a correlation between HRV indices and OSAS severity due to inconsistent data.
In addition to OSAS severity, age is an important factor contributing to HRV changes. In general, regulation of the autonomic nervous system declines with age, and so HRV indices are affected by aging.17,18 Vagal activity decreases with age, which also affects HRV.19 This decreased HRV can be explained by the fact that the reactions of the autonomic nervous system to external stimulation decrease with age.20 Several HRV indices change with age, so that 40% of the SDANN (standard deviation of average NN interval) indices and SDNN [standard deviation of the NN (normal RR) interval] decrease slowly for about 20 years, and 55% of the SDNN index (standard deviation of NN interval) decreases for about 20 years. Furthermore, pNN50 (the proportion of NN50 divided by total number of NN) and RMMSD (the square root of the mean squared difference of successive NNs) decrease more rapidly than all other time-domain HRV indices.21 One study considering both age and sex suggested that both time- and frequency-domain HRV indices associated with parasympathetic tone were significantly lower in older than in younger men, whereas only the short-term HRV index decreased with age in women. This study suggests that the regulatory function of the autonomic nervous system as a whole decreases in males with age, and so HRV decreases. However, there is no significant change in the autonomic nervous system in women with age, except in the short-term HRV index. Thus, while HRV tends to decrease with both age and increased severity of OSAS, changes in HRV indices of OSAS patients reflect the effects of several factors.22 This study aimed to examine how HRV indices are affected by OSAS severity and aging in male subjects under the assumption that HRV decreases with age and more severe OSAS.
METHODS
Subjects
This study was conducted on 176 drug-free adult males who were diagnosed with OSAS based on a score of >5 on the apnea-hypopnea index (AHI) by nocturnal polysomnography. All subjects met the following inclusion criteria: 1) male; 2) >18 and <60 years old; 3) normal electrocardiogram during wakefulness; and 4) AHI >5. Exclusion criteria were history of intake of alcohol or other drugs within 7 days of the nocturnal polysomnographic study, current antihypertensive treatment, previous or current cardiovascular diseases, pulmonary disorders, diabetes mellitus, psychiatric disorders, other sleep disorders, disorders of the autonomic nervous system or endocrine system that can alter blood pressure, and history of operations or continuous positive airway pressure (CPAP) treatment for OSAS. Informed consent was obtained prior to the study. Basic information on education level, residence, weight, and stature was obtained. Self-reported scales including the Pittsburgh Sleep Quality Index (PSQI), Epworth Sleepiness Scale (ESS), Stanford Sleepiness Scale (SSS), Morningness-Eveningness Questionnaire (MEQ), Beck Depression Inventory (BDI), Beck Anxiety Inventory (BAI), and State-Trait Anxiety Inventory (STAI) were conducted to measure symptoms such as insomnia, daytime sleepiness, depression, and anxiety. All participants provided written informed consent, and the protocol was approved by the institutional review board.
Subjects were classified into four groups according to age and severity of sleep apnea. Subjects under 40 years old were termed young (18-39 years), and those over 40 years old, middle-aged (40-60 years). In terms of sleep apnea severity, patients with AHI <30 were called mild to moderate (AHI=5-29), and those with AHI >30 as severe (AHI=30-120). The young and mild to moderate group (n=45), the young and severe group (n=40), the middle-aged and mild to moderate group (n=45), and the middle-aged and severe group (n=46) were identified as groups 1, 2, 3 and 4, respectively.
Polysomnography
Nocturnal polysomnographic recordings were performed using an Embla N7000 system (Medcare-Embla®, Reykjavik, Iceland) and Somnologica version 3.3.1 software (Medcare-Embla®, Reykjavik, Iceland) during the period when subjects were in bed from lights-off to lights-on. Electroencephalography was monitored using C3/A2 and C4/A1 lead pairs and O1/A2 and O2/A1 lead pairs. Two pairs of electrooculographic leads were used. Electromyographic leads were placed on the submentalis and tibialis anterior muscles. Airflow was continuously measured by a thermistor and nasal pressure cannula. Respiratory movements were monitored using respiratory inductive plethysmographic belts around the chest and abdomen. Oxygen saturation was measured by a pulse oximeter sensor on the left second finger.
Sleep stage and events were scored according to the American Academy of Sleep Medicine (AASM) manual.23 As variables related to sleep structure, time in bed (TIB), sleep period time (SPT), total sleep time (TST), sleep latency (SL), sleep efficiency (SE), stage 1 sleep (S1), stage 2 sleep (S2), slow-wave sleep (SWS), rapid eye movement (REM) sleep, wake, stage 1 and 2 sleep fraction, slow-wave sleep fraction, REM sleep fraction, wake fraction, and arousal index were calculated. The oxygen desaturation event index (ODI) was defined as the number of events per hour in which oxygen saturation decreased by 4% or more. Hypopnea was defined as a reduction in airflow by 50-80% for at least 10 s associated with an oxygen desaturation of at least 4% or arousal. Apnea was defined as an 80% or greater reduction in airflow for at least 10 s.24 AHI was calculated by dividing the total number of apnea and hypopnea events by the number of hours of sleep.
Data acquisition and analysis
Electrocardiographic signals acquired by the polysomnographic machine were digitized at a sampling rate of 250 Hz. The RR interval was also used in the analysis. Artifacts were eliminated, and an analysis was performed only for normal beats. These processes were conducted using an Embla N7000 system (Medcare-Embla®, Reykjavik, Iceland) using Somnologica version 3.3.1 (Medcare-Embla®, Reykjavik, Iceland). This system and software are used in many sleep studies.25-28
Time-domain variables were mean RR, SDNN, SDNN index, RMSSD (defined as the square root of the mean of the sum of the squares of differences between adjacent RR intervals), NN50 count, NN50 of total HR (%), SDANN, and HRV triangular index. SDNN is the standard deviation of all RR intervals. RMSSD is the square root of the mean of the sum of the squares of differences between adjacent RR intervals. SDANN is the standard deviation of the averages of RR intervals in all 5-min segments. The SDNN index is the mean of the standard deviation of all RR intervals for all 5-min segments. NN50 count means the number of pairs of adjacent RR intervals differing by more than 50 ms during the entire analysis period. NN50 of total HR (%) is the NN50 count divided by the total number of all RR intervals. The HRV triangular index means the total number of RR intervals divided by the maximum height of the histogram, excluding boundaries. In the frequency-domain analysis, the power was calculated for very low-frequency (VLF, 0.0033-0.04 Hz), low-frequency (LF, 0.04-0.15 Hz), and high-frequency bands (HF, 0.15-0.40 Hz). The LF/HF ratio was also calculated.
ANOVA was conducted to compare the demographic and polysomnographic data of the four groups. ANCOVA was conducted to compare HRV indices between the groups, controlling for systolic blood pressure (SBP), diastolic blood pressure (DBP), body mass index (BMI), and sleep efficiency (SE). A contrast test was conducted to check differences between groups. A partial correlation was performed to select the most statistically significant parameter in each of the time- and frequency-domain HRV indices, controlling for SBP, DBP, BMI, and SE. Stepwise multiple linear regression analysis was executed for the NN50 count and LF/HF ratio that showed the most statistically significant value in each time- and frequency-domain HRV index through partial correlation to examine the effects of age, AHI, BMI, SBP, DBP, and sleep parameter indices (stage 1 sleep, stage 2 sleep, slow wave sleep, and wake time). Stepwise multiple linear regression analysis was conducted with each NN50 count and LF/HF ratio as a dependent variable, and age, AHI, BMI, SBP, DBP, and sleep parameter indices as independent variables. Statistical significance was defined as p<0.05. SPSS 17.0 was used for data analysis.
RESULTS
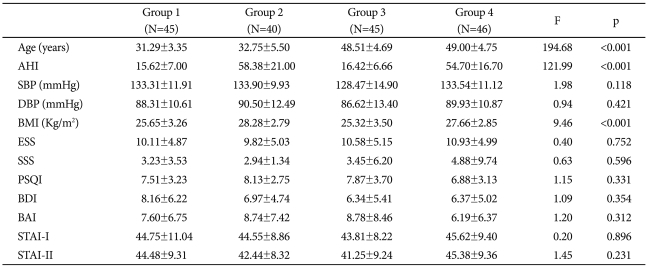
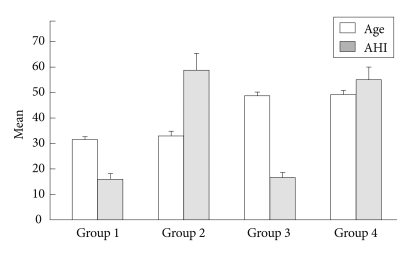
The mean age of the 176 subjects was 40.65±9.58 years. Table 1 shows the participants' demographic characteristics. Mean age and AHI of each group are shown in Figure 1. BMI (kg/meter2) showed significant differences between groups 1 and 2 (p<0.002), groups 1 and 4 (p<0.027), groups 2 and 3 (p<0.001), and groups 3 and 4 (p<0.006), as determined by the contrast test. There were no significant differences in PSQI, ESS, SSS, MEQ, BDI, BAI, and STAI.
Table 1.
Demographic data of OSAS patients, classified into four groups according to their age and AHI (Mean±SD)
Group 1: young, mild to moderate OSAS group, Group2: young, severe OSAS group, Group3: middle-aged, mild to moderate OSAS group, Group 4: middle-aged, severe OSAS group. OSAS: obstructive sleep apnea syndrome, N: number, SD: standard deviation, AHI: Apnea-Hypopnea Index, SBP: systolic blood pressure, DBP: diastolic blood pressure, BMI: Body Mass Index, ESS: Epworth Sleepiness Scale, SSS: Stanford sleepiness scale, PSQI: Pittsburg Sleep Quality Index, BDI: Beck Depression Inventory, BAI: Beck Anxiety Inventory, STAI: State Trait Anxiety Inventory
Figure 1.
Comparison of age and apnea-hypopnea index (AHI) of 4 OSAS groups. The ages were significant differences between young groups (1, 2) and middle-aged groups (3, 4), F=194.68, p<0.001, and the AHI were also significantly different between mild to moderate OSAS groups (1, 3) and severe OSAS groups (2, 4), F=121.99, p<0.001. Group 1: young, mild to moderate OSAS group, Group 2: young, severe OSAS group, Group 3: middle-aged, mild to moderate OSAS group, Group 4: middle-aged, severe OSAS group. OSAS: obstructive sleep apnea syndrome.
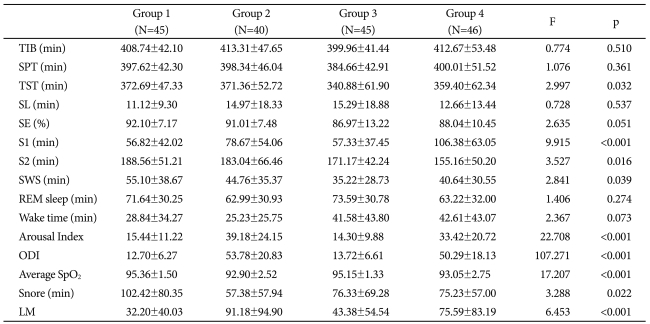
Variables related to sleep structure and sleep events of each group are described in Table 2. Of these, TST, S1, S2, SWS, arousal index, ODI, average SpO2, snoring time, and number of limb movements showed significant differences among groups.
Table 2.
Polysomnographic data of OSAS patients, classified into four groups according to their age and AHI (Mean±SD)
AHI: apnea-hypopnea index, SD: standard deviation, N: number, OSAS: obstructive sleep apnea syndrome, TIB: time in bed, SPT: sleep period time, TST: total sleep time, SL: sleep latency, SE: sleep efficiency, S1: stage 1 sleep, S2: stage 2 sleep, SWS: slow wave sleep, REM: rapid eye movement, ODI: oxygen desaturation index, LM: limb movement
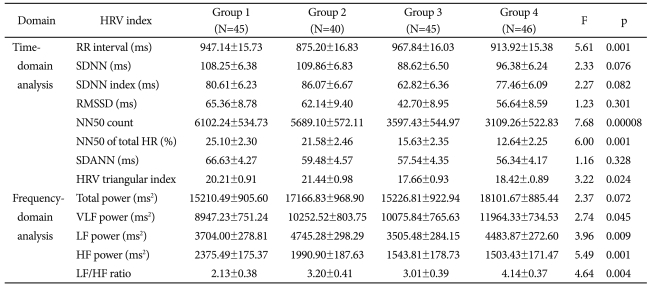
HRV-related variables for each group are described in Table 3. In the time-domain analysis, RR interval, NN50 count, NN50 of total HR (%), and HRV triangular index showed significant differences among groups, and of these, NN50 count showed the greatest statistical significance. Frequency-domain analysis showed that VLF power, LF power, HF power, and LF/HF ratio showed significant differences, and of these, HF power showed the highest statistical significance, followed by LF/HF ratio.
Table 3.
Comparison of heart rate variability (HRV) indices between 4 groups in OSAS patients (Mean±SD)
OSAS: obstructive sleep apnea syndrome, SDNN: standard deviation of all RR intervals, SDNN index: mean of the standard deviation of all RR intervals for all 5-min segments, RMSSD: square root of the mean of the sum of the squares of differences between adjacent RR intervals, NN50 count: the number of pairs of adjacent RR intervals differing by more than 50 ms in the entire analysis interval, NN50 of total HR (%): the NN50 count divided by the total number of all RR intervals, SDANN: the standard deviation of the averages of RR intervals in all 5-min segments, HRV triangular index: total number of RR intervals divided by maximum height of the histogram excluding boundaries, VLF: very low frequency, LF: low frequency, HF: high frequency, RR interval: the time between two consecutive R waves in the electrocardiogram, HR: Heart rate
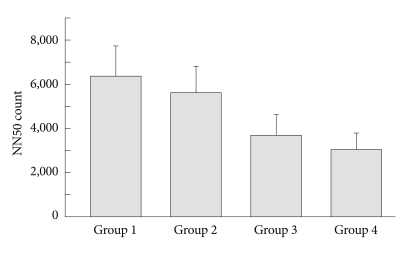
The mean NN50 count was significantly different among groups (p=0.00008). As determined by the NN50 contrast test, statistically significant differences were identified between groups 1 and 3 (p=0.001), groups 1 and 4 (p<0.001), groups 2 and 3 (p=0.011), and groups 2 and 4 (p=0.001) (Figure 2). RR intervals were statistically different between groups 1 and 2 (p=0.002), groups 2 and 3 (p=0.0002), and groups 3 and 4 (p=0.018). The HRV triangular index also showed statistically significant differences among groups (p=0.024). Specifically, the HRV triangular index was significantly different between groups 2 and 3 (p=0.007, and groups 2 and 4 (p=0.022), as determined by the contrast test.
Figure 2.
Comparison of the NN50 count between the four OSAS groups. The NN50 count was significantly different (F=7.68, p=0.00008) when adjusted by systolic blood pressure (SBP), diastolic blood pressure (DBP), body mass index (BMI) and sleep efficiency (SE). The contrast test further showed that Group 1 was significantly different from Group 3 (p=0.001) and Group 4 (p<0.001). Similarly, Group 2 was significantly different from Group 3 (p=0.011) and Group 4 (p=0.001). OSAS: obstructive sleep apnea syndrome, NN50 count: the number of pairs of adjacent RR intervals differing by more than 50 ms in the entire analysis interval.
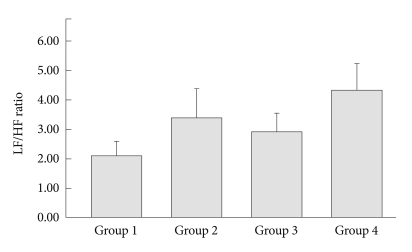
Additionally, there were statistically significant differences in VLF power, LF power, HF power, and LF/HF ratio, as determined by frequency-domain analysis. Specifically, there were statistically significant differences between groups 1 and 4 (p=0.005) in VLF power, between groups 1 and 2 (p=0.013), groups 2 and 3 (p=0.004), and groups 3 and 4 (p=0.015) in LF power; and between groups 1 and 3 (p=0.001) and groups 1 and 4 (p=0.001) in HF power, all as determined by the contrast test. The mean LF/HF ratio of was significantly different between groups 1 and 4 (p<0.001) and groups 3 and 4 (p=0.040), as determined by the contrast test (Figure 3).
Figure 3.
Comparison of the LF/HF ratio between the four OSAS groups. The ratio was significantly different (F=4.64, p=0.004) when adjusted by systolic blood pressure (SBP), diastolic blood pressure (DBP), body mass index (BMI) and sleep efficiency (SE). The contrast test further showed that Group 1 was significantly different from Group 4 (p<0.001). Similarly, Group 3 was significantly different from Group 4 (p=0.040). OSAS: obstructive sleep apnea syndrome, LF/HF ratio: Low frequency/High frequency ratio.
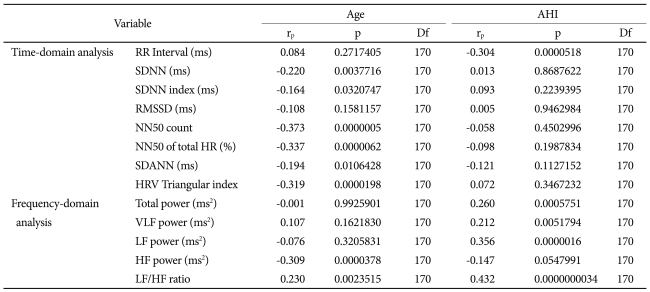
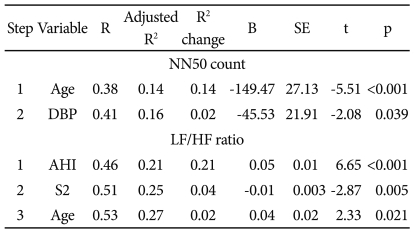
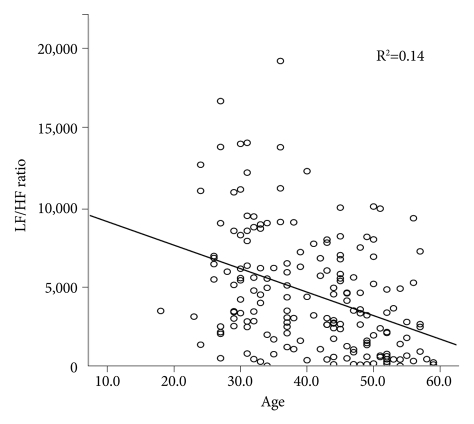
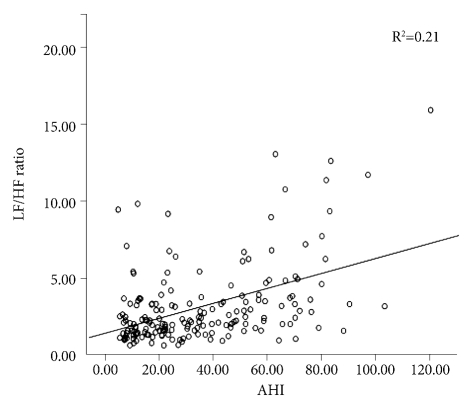
By partial correlation, controlling for SBP, DBP, BMI, and sleep efficiency, the parameters with the greatest statistical significance for each time- and frequency-domain HRV index were identified as NN50 count (rp=-0.373, p=0.0000005) and LF/HF ratio (rp=0.432, p=0.0000000034), respectively (Table 4). To determine which variables had the greatest effect on NN50 count and LF/HF ratio, a stepwise multiple linear regression analysis was conducted (Table 5). Of age, AHI, BMI, SBP, DBP, S1, S2, SWS, and wake time, the NN50 count was most affected by age (p<0.001) and DBP (p=0.039), and the LF/HF ratio was most affected by AHI (p<0.001), stage 2 sleep (p=0.005), and age (p=0.021), in the order named (Figures 4 and 5).
Table 4.
Partial correlation of age and apnea-hypopnea index (AHI) with heart rate variability (HRV) indices controlling systolic, diastolic blood pressure, body mass index and sleep efficiency of OSAS patients
OSAS: obstructive sleep apnea syndrome, RR interval: the time between two consecutive R waves in the electrocardiogram, SDNN: standard deviation of all RR intervals, SDNN index: mean of the standard deviation of all RR intervals for all 5-min segments, RMSSD: square root of the mean of the sum of the squares of differences between adjacent RR intervals, NN50 count: the number of pairs of adjacent RR intervals differing by more than 50 ms in the entire analysis interval, NN50 of total HR (%): the NN50 count divided by the total number of all RR intervals, SDANN: the standard deviation of the averages of RR intervals in all 5-min segments, HRV triangular index: total number of RR intervals divided by maximum height of the histogram excluding boundaries, VLF: very low frequency, LF: low frequency, HF: high frequency
Table 5.
Stepwise multiple linear regression analysis of variables' relationships to the NN50 count and LF/HF ratio in OSAS patients
NN50 count: the number of pairs of adjacent RR intervals differing by more than 50 ms in the entire analysis interval, LF/HF ratio: Low frequency/high frequency ratio, OSAS: obstructive sleep apnea syndrome, SE: standard errors, DBP: diastolic blood pressure, AHI: Apnea-hyponea index, S2: stage 2 sleep
Figure 4.
The linear regression between age and NN50 count of the four OSAS groups. The NN50 count was affected by age (p<0.001) and diastolic blood pressure (p=0.039) in the order named in the stepwise multiple linear regression analysis. LF: low frequency, HF: high frequency, NN50 count: the number of parts of adjacent RR intervals differing by more than 50 ms in the entire analysis interval, OSAS: obstructive sleep apnea syndrome.
Figure 5.
The linear regression between AHI and LF/HF ratio of the four OSAS groups. The LF/HF ratio was affected by AHI (p<0.001), Stage 2 sleep (p=0.005) and age (p=0.021) in the order named in the stepwise multiple linear regression analysis. LF/HF raito: Low frequency/high frequency index, AHI: Apnea-Hyponea Index, OSAS: obstructive sleep apnea syndrome.
DISCUSSION
Of the time-domain HRV indices, RR interval, NN50 count, NN50 of total heart rate, and HRV triangular index showed statistically significant differences, and of the frequency-domain indices, VLF power, LF power, HF power, and LF/HF ratio showed statistically significant differences among the four groups, according to age and the severity of OSAS. NN50 count and LF/HF ratio tended to decrease with age and with increased AHI. This result confirms those of previous studies.13,14,21,29 Our data suggested that NN50 and LF/HF ratio responded differently to aging and AHI severity. NN50 count decreased more with age than with AHI severity, and the LF/HF ratio increased more with AHI severity than with age.
Thus NN50 count and LF/HF ratio showed the greatest statistical significance. Therefore, we determined the effect of several variables on NN50 count and LF/HF ratio by stepwise multiple linear regression analysis. Only age had a significant effect on NN50 count. In the case of LF/HF ratio, AHI was found to have the greatest effect, followed by S2 and age.
The NN50 count indicates how often the RR interval differs by over 50 ms from the average RR interval, and it strongly reflects the activities of the parasympathetic nervous system. In general, the function of the parasympathetic nervous system is known to decrease with age.30 Therefore, NN50 count will decrease with age. This is consistent with our data; age showed the greatest correlation with NN50 count, and only age was found to have significant affect in the stepwise multiple linear regression analysis.
LF/HF ratio reflects the overall balance of the autonomic nervous system. In some cases, this ratio is used as an index of activity of the sympathetic nervous system. Hypercapnia and hypoxia occur in OSAS patients due to repeated sleep apnea, which, in turn, increases sympathetic activity through other mechanisms, including the chemoreceptor reflex, and accentuates sympathetic nerve activity.31,32 Sympathetic nervous system activity is known to increase with age.33 In this study, the LF/HF ratio increased with AHI and age, which is consistent with the fact that sympathetic nervous system activity increases with both age and AHI and that the LF/HF ratio reflects the sympathetic nerve activity. The LF/HF ratio showed the highest correlation with AHI, and in the stepwise multiple linear regression analysis, the LF/HF ratio was found to be most affected by AHI. Therefore, the LF/HF ratio, which is closely related to sympathetic nervous system activity, may be affected more by the severity of sleep apnea than by aging, which confirms the conclusions of previous studies.13 S2 had a greater effect on the LF/HF ratio than did age, perhaps because S2 increases with AHI severity.34
Although this study used a large population (n=176), it has several limitations. First, female subjects were not included, and so changes in female subjects could not be examined. However, this can also be regarded as an advantage, as the study population was more homogenous. In a previous study, time- and frequency-domain analyses associated with aging showed many significant changes in male subjects, but only the short-term HRV index changed in female subjects.22 Therefore, inclusion of only male subjects may lead to a superior evaluation of changes in HRV. Second, the first-night effect was not considered in this study. Increased sleep latency, decreased overall sleep time, increased wake frequency, and invasion of alpha in non-REM sleep may occur due to first-night effects.35 However, polysomnography was conducted under the same conditions on all subjects, and thus first-night effects likely did not influence the comparisons among groups. Third, this study did not compare OSAS patients with normal controls. Thus, the ability to determine whether changes in HRV indices were quantitatively meaningful compared with controls was limited.
This study analyzed the effects of age and OSAS severity on HRV indices and indicated that these effects differed among HRV indices. The LF/HF ratio, which mainly is associated with sympathetic tone, is more likely to reflect changes in sleep apnea severity. NN50 count, which reflects mainly the parasympathetic system, is more likely to reflect changes in age. Therefore, our data suggest that age and severity of sleep apnea exhibit different effects on various HRV indices.
Acknowledgments
This paper was supported financially by Konkuk University (Seoul, Korea) in 2008.
References
- 1.Punjabi NM. The epidemiology of adult obstructive sleep apnea. Proc Am Thorac Soc. 2008;5:136–143. doi: 10.1513/pats.200709-155MG. [DOI] [PMC free article] [PubMed] [Google Scholar]
- 2.Bradley TD, Phillipson EA. Pathogenesis and pathophysiology of the obstructive sleep apnea syndrome. Med Clin North Am. 1985;69:1169–1185. doi: 10.1016/s0025-7125(16)30981-6. [DOI] [PubMed] [Google Scholar]
- 3.Millman RP. Snoring and apnea. Clin Chest Med. 1987;8:253–264. [PubMed] [Google Scholar]
- 4.Tarasiuk A, Greenberg-Dotan S, Brin YS, Simon T, Tal A, Reuveni H. Determinants affecting health-care utilization in obstructive sleep apnea syndrome patients. Chest. 2005;128:1310–1314. doi: 10.1378/chest.128.3.1310. [DOI] [PubMed] [Google Scholar]
- 5.Pashayan AG, Passannante AN, Rock P. Pathophysiology of obstructive sleep apnea. Anesthesiol Clin North America. 2005;23:431–443. doi: 10.1016/j.atc.2005.02.004. [DOI] [PubMed] [Google Scholar]
- 6.He J, Kryger MH, Zorick FJ, Conway W, Roth T. Mortality and apnea index in obstructive sleep apnea. Experience in 385 male patients. Chest. 1988;94:9–14. [PubMed] [Google Scholar]
- 7.Tilkian AG, Guilleminault C, Schroeder JS, Lehrman KL, Simmons FB, Dement WC. Hemodynamics in sleep-induced apnea. Studies during wakefulness and sleep. Ann Intern Med. 1976;85:714–719. doi: 10.7326/0003-4819-85-6-714. [DOI] [PubMed] [Google Scholar]
- 8.Hung J, Whitford EG, Parsons RW, Hillman DR. Association of sleep apnoea with myocardial infarction in men. Lancet. 1990;336:261–264. doi: 10.1016/0140-6736(90)91799-g. [DOI] [PubMed] [Google Scholar]
- 9.Sztajzel J. Heart rate variability: a noninvasive electrocardiographic method to measure the autonomic nervous system. Swiss Med Wkly. 2004;134:514–522. doi: 10.4414/smw.2004.10321. [DOI] [PubMed] [Google Scholar]
- 10.Rajendra Acharya U, Paul Joseph K, Kannathal N, Lim CM, Suri JS. Heart rate variability: a review. Med Biol Eng Comput. 2006;44:1031–1051. doi: 10.1007/s11517-006-0119-0. [DOI] [PubMed] [Google Scholar]
- 11.Bauer T, Ewig S, Schafer H, Jelen E, Omran H, Luderitz B. Heart rate variability in patients with sleep-related breathing disorders. Cardiology. 1996;87:492–496. doi: 10.1159/000177144. [DOI] [PubMed] [Google Scholar]
- 12.Roche F, Gaspoz JM, Court-Fortune I, Minini P, Pichot V, Duverney D, et al. Screening of obstructive sleep apnea syndrome by heart rate variability analysis. Circulation. 1999;100:1411–1415. doi: 10.1161/01.cir.100.13.1411. [DOI] [PubMed] [Google Scholar]
- 13.Park DH, Shin CJ, Hong SC, Yu J, Ryu SH, Kim EJ, et al. Correlation between the severity of obstructive sleep apnea and heart rate variability indices. J Korean Med Sci. 2008;23:226–231. doi: 10.3346/jkms.2008.23.2.226. [DOI] [PMC free article] [PubMed] [Google Scholar]
- 14.Gula LJ, Krahn AD, Skanes A, Ferguson KA, George C, Yee R, et al. Heart rate variability in obstructive sleep apnea: a prospective study and frequency domain analysis. Ann Noninvasive Electrocardiol. 2003;8:144–149. doi: 10.1046/j.1542-474X.2003.08209.x. [DOI] [PMC free article] [PubMed] [Google Scholar]
- 15.Wakai M, Samejima Y, Goshima K, Yamamoto J. Altered heart rate variability in severe sleep apnea syndrome. Sleep Biol Rhythms. 2004;2:87–88. [Google Scholar]
- 16.Narkiewicz K, Montano N, Cogliati C, van de Borne PJ, Dyken ME, Somers VK. Altered cardiovascular variability in obstructive sleep apnea. Circulation. 1998;98:1071–1077. doi: 10.1161/01.cir.98.11.1071. [DOI] [PubMed] [Google Scholar]
- 17.Jensen-Urstad K, Storck N, Bouvier F, Ericson M, Lindblad LE, Jensen-Urstad M. Heart rate variability in healthy subjects is related to age and gender. Acta Physiol Scand. 1997;160:235–241. doi: 10.1046/j.1365-201X.1997.00142.x. [DOI] [PubMed] [Google Scholar]
- 18.O'Brien IA, O'Hare P, Corrall RJ. Heart rate variability in healthy subjects: effect of age and the derivation of normal ranges for tests of autonomic function. Br Heart J. 1986;55:348–354. doi: 10.1136/hrt.55.4.348. [DOI] [PMC free article] [PubMed] [Google Scholar]
- 19.Stein PK, Domitrovich PP, Hui N, Rautaharju P, Gottdiener J. Sometimes higher heart rate variability is not better heart rate variability: results of graphical and nonlinear analyses. J Cardiovasc Electrophysiol. 2005;16:954–959. doi: 10.1111/j.1540-8167.2005.40788.x. [DOI] [PubMed] [Google Scholar]
- 20.Reardon M, Malik M. Changes in heart rate variability with age. Pacing Clin Electrophysiol. 1996;19:1863–1866. doi: 10.1111/j.1540-8159.1996.tb03241.x. [DOI] [PubMed] [Google Scholar]
- 21.Umetani K, Singer DH, McCraty R, Atkinson M. Twenty-four hour time domain heart rate variability and heart rate: relations to age and gender over nine decades. J Am Coll Cardiol. 1998;31:593–601. doi: 10.1016/s0735-1097(97)00554-8. [DOI] [PubMed] [Google Scholar]
- 22.Stein PK, Kleiger RE, Rottman JN. Differing effects of age on heart rate variability in men and women. Am J Cardiol. 1997;80:302–305. doi: 10.1016/s0002-9149(97)00350-0. [DOI] [PubMed] [Google Scholar]
- 23.Grigg-Damberger MM. The AASM scoring manual: a critical appraisal. Curr Opin Pulm Med. 2009 doi: 10.1097/MCP.0b013e328331a2bf. inpress. [DOI] [PubMed] [Google Scholar]
- 24.Tsai WH, Flemons WW, Whitelaw WA, Remmers JE. A comparison of apnea-hypopnea indices derived from different definitions of hypopnea. Am J Respir Crit Care Med. 1999;159:43–48. doi: 10.1164/ajrccm.159.1.9709017. [DOI] [PubMed] [Google Scholar]
- 25.Martinho FL, Tangerina RP, Moura SM, Gregorio LC, Tufik S, Bittencourt LR. Systematic head and neck physical examination as a predictor of obstructive sleep apnea in class III obese patients. Braz J Med Biol Res. 2008;41:1093–1097. doi: 10.1590/s0100-879x2008001200008. [DOI] [PubMed] [Google Scholar]
- 26.Lee HK, Park DH, Shin HS, Hong SC. Comparison of low resolution electromagnetic tomography imaging between subjects with mild and severe obstructive sleep apnea syndrome: a preliminary study. Psychiatry Investig. 2008;5:45–51. doi: 10.4306/pi.2008.5.1.45. [DOI] [PMC free article] [PubMed] [Google Scholar]
- 27.Kasikcioglu HA, Karasulu L, Durgun E, Oflaz H, Kasikcioglu E, Cuhadaroglu C. Aortic elastic properties and left ventricular diastolic dysfunction in patients with obstructive sleep apnea. Heart Vessels. 2005;20:239–244. doi: 10.1007/s00380-005-0839-3. [DOI] [PubMed] [Google Scholar]
- 28.Louis M, Punjabi NM. Effects of acute intermittent hypoxia on glucose metabolism in awake healthy volunteers. J Appl Physiol. 2009;106:1538–1544. doi: 10.1152/japplphysiol.91523.2008. [DOI] [PMC free article] [PubMed] [Google Scholar]
- 29.Bonnemeier H, Richardt G, Potratz J, Wiegand UK, Brandes A, Kluge N, et al. Circadian profile of cardiac autonomic nervous modulation in healthy subjects: differing effects of aging and gender on heart rate variability. J Cardiovasc Electrophysiol. 2003;14:791–799. doi: 10.1046/j.1540-8167.2003.03078.x. [DOI] [PubMed] [Google Scholar]
- 30.Pfeifer MA, Weinberg CR, Cook D, Best JD, Reenan A, Halter JB. Differential changes of autonomic nervous system function with age in man. Am J Med. 1983;75:249–258. doi: 10.1016/0002-9343(83)91201-9. [DOI] [PubMed] [Google Scholar]
- 31.Narkiewicz K, Somers VK. Sympathetic nerve activity in obstructive sleep apnoea. Acta Physiol Scand. 2003;177:385–390. doi: 10.1046/j.1365-201X.2003.01091.x. [DOI] [PubMed] [Google Scholar]
- 32.Carlson JT, Hedner J, Elam M, Ejnell H, Sellgren J, Wallin BG. Augmented resting sympathetic activity in awake patients with obstructive sleep apnea. Chest. 1993;103:1763–1768. doi: 10.1378/chest.103.6.1763. [DOI] [PubMed] [Google Scholar]
- 33.Ferrari AU, Radaelli A, Centola M. Invited review: aging and the cardiovascular system. J Appl Physiol. 2003;95:2591–2597. doi: 10.1152/japplphysiol.00601.2003. [DOI] [PubMed] [Google Scholar]
- 34.Lopes C, Esteves AM, Bittencourt LR, Tufik S, Mello MT. Relationship between the quality of life and the severity of obstructive sleep apnea syndrome. Braz J Med Biol Res. 2008;41:908–913. doi: 10.1590/s0100-879x2008005000036. [DOI] [PubMed] [Google Scholar]
- 35.Meyer TJ, Eveloff SE, Kline LR, Millman RP. One negative polysomnogram does not exclude obstructive sleep apnea. Chest. 1993;103:756–760. doi: 10.1378/chest.103.3.756. [DOI] [PubMed] [Google Scholar]


